
Table 1.
Main obligations of EU member states to reduce antimicrobial resistance imposed by Regulation (UE) 2019/6 (22)
| 1. | To only allow preventive use of antimicrobials in single animals and small groups following veterinary assessment |
| 2. | To restrict the metaphylactic use of antimicrobials |
| 3. | To ban specific antimicrobials from non-humans use (electively) |
| 4. | To collect data on the sales and use of antimicrobials |
| 5. | To prohibit the import of animals and animal products from third countries where antimicrobials have been used in a manner not compliant with EU rules |
Table 2.
Providers of the data on the volume of sales of veterinary antimicrobials reported by EU member states and EEA countries to the European Medicines Agency for 2023 (10, 11)
| Data provider | Countries |
|---|---|
| Marketing Authorisation Holders | Austria, Belgium, Bulgaria, Croatia, France, Germany, Greece, Ireland, Netherlands, Portugal, Romania, Spain |
| Wholesalers | Austria, Bulgaria, Croatia, Cyprus, Czechia, Estonia, Finland, Germany, Greece, Hungary, Iceland, Latvia, Lithuania, Luxembourg, Malta, Norway, Poland, Portugal, Slovakia, Slovenia |
| Feed mills | Belgium, Cyprus, Czechia, Italy, Malta, Norway |
| Pharmacies | Denmark, Italy, Sweden |
| Retailers | Italy |
| Veterinarians | Sweden |
Table 3.
Antimicrobial veterinary medical products based on the ATCvet classification (5) grouped as products mandatory to report sales of and products voluntary to report sales of (5)
| Reporting | Antimicrobial substance group | ATCvet code |
|---|---|---|
| antidiarrhoeals, intestinal anti-inflammatory and anti-infective agents | QA07AA, QA07AB, QA07AX03, QA07AX04 | |
| gynaecological anti-infectives and antiseptics | QG01AA, QG01AE, QG01BA, QG01BE | |
| anti-infectives and antiseptics for intrauterine use | QG51AA, QG51AG | |
| Mandatory | antibacterials for systemic use | QJ01 |
| antibacterials for intramammary use | QJ51 | |
| antiprotozoals (with antibacterial effect) | QP51AG | |
| antimycobacterials for intramammary use | QJ54 | |
| antiprotozoals (other than QP51AG) | QP51 | |
| antifungals for topical use | QD01A | |
| antifungals for systemic use | QD01B | |
| antimycotics for systemic use | QJ02 | |
| antimycobacterials | QJ04 | |
| Voluntary | antivirals for systemic use | QJ05 |
| antibiotics and chemotherapeutics for dermatological use | QD06 | |
| other nasal preparations | QR01AX06, QR01AX08 | |
| ophthalmological anti-infectives | QS01AA, QS01AB, QS01AD, QS01AE, QS01CA, QS01C | |
| otological anti-infectives | QS02AA, QS02CA, QS03AA, QS03CA |
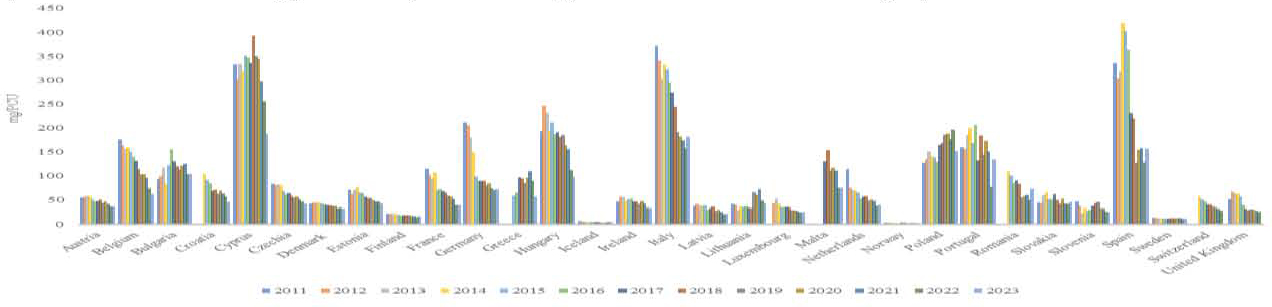
Fig. 1.
Overall sales of antimicrobial veterinary medical products primarily for food-producing animals for EU and EEA countries reported in mg/PCU during 2011–2023 (10–21). PCU - population correction unit
Table 4.
Decrease in antimicrobial veterinary medicinal product sales in EU and EEA countries between 2011 and 2023 (10, 21)
| 0–20.0% | 20.1–40.0% | 40.1–60.0% | 60.1–80.0% |
|---|---|---|---|
| Portugal (16.2%) | Austria (33.8%) | Czechia (49.2%) | Belgium (64.7%) |
| Sweden (14.5%) | Denmark (24.2%) | Cyprus (43.8%) | Germany (66.4%) |
| Estonia (39.7%) | Hungary (49.6%) | France (70.4%) | |
| Finland (24.4%) | Italy (51.4%) | Netherlands (65.3%) | |
| Iceland (28.3%) | Latvia (41.4%) | ||
| Ireland (28.0%) | Slovenia (47.2%) | ||
| Norway (40.0%) | Spain (53.4%) | ||
| United Kingdom (49.6%)* |
Table 5.
Comparison of antimicrobial veterinary medicinal product sales indicators in Poland and selected EU countries (11)
| Country | 2011 sales (mg/PCU) | 2023 sales (mg/PCU) | 2011–2023 trend |
|---|---|---|---|
| Poland | 126.3 | 150.9 | Increasing |
| Belgium | 175.1 | 61.8 | Decreasing |
| Denmark | 42.1 | 31.9 | Decreasing |
| Germany | 211.5 | 71.1 | Decreasing |
| France | 133.6 | 39.5 | Decreasing |
Table 6.
Year-to-year percentage changes (%) in antimicrobial veterinary medicinal product sales (mg/PCU) in Poland and in Europe during 2011–2023 (10–21)
| Region | 2011 | 2012 | 2013 | 2014 | 2015 | 2016 | 2017 | 2018 | 2019 | 2020 | 2021 | 2022 | 2023 |
|---|---|---|---|---|---|---|---|---|---|---|---|---|---|
| Poland | 123.6 | +7.0 | +14.4 | −7.7 | −1.1 | −6.9 | +27.6 | +2.7 | +10.0 | +1.5 | −6.6 | +11.7 | −23.0 |
| Rest of EU + EEA(mean) | 161.2 | −19.3 | +0.6 | −17.6 | +28.8 | −10.3 | −14.1 | −3.6 | −18.4 | +5.7 | −5.2 | −12.4 | +14.5 |
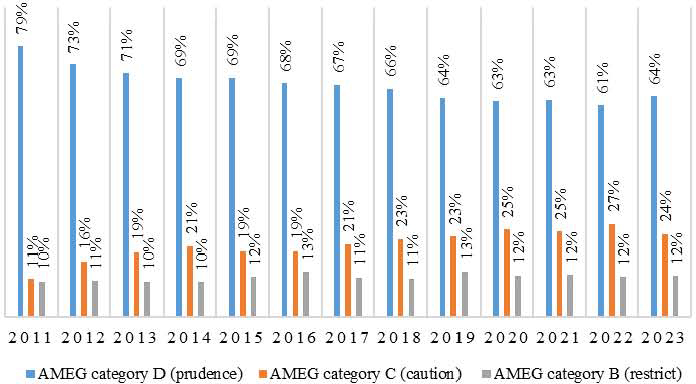
Fig. 2.
Sales of antimicrobial veterinary medical products in Poland during 2011–2023 excluding preparations in AMEG category A (avoid) (10–21)
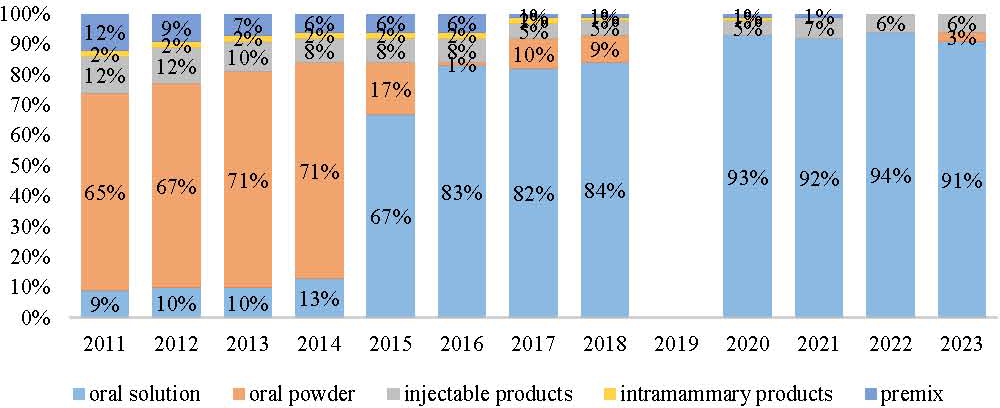
Fig. 3.
Proportions of Polish sales of antimicrobial veterinary medicinal products primarily for food-producing animals by administration route during 2011–2023 (10–21). Data for 2019 were not available
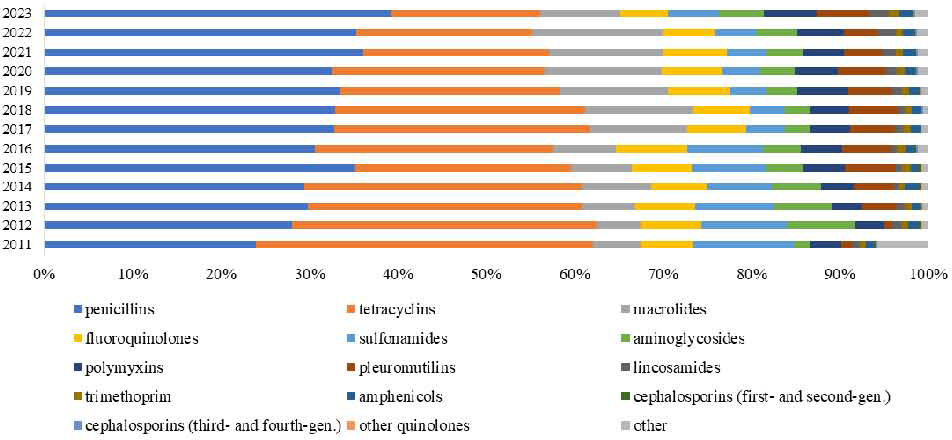
Fig. 4.
Proportions of sales of antimicrobial veterinary medicinal products primarily for food-producing animals by antimicrobial class in Poland during 2011–2023 (10–21)