
Table 1.
Primer sequences used in a qRT-PCR for analysing expression of E. coli O101 genes after treatment with Radix Paeoniae Rubra aqueous extract
| Gene | Primer | Sequence (5ʹ–3ʹ) | Length (bp) |
|---|---|---|---|
| marA | marA-F marA-R | TTCATAGCATTTTGGACTGG ATCCGCAGCCGTAAGATGA | 158 |
| soxS | soxS-F soxS-R | TGACGCATCAGACGCTTGGC AAATCGGACGCTCGGTGGT | 188 |
| ompC | ompC-F ompC-R | GGTGGCTGGGGGGTAGATACTGG GCTTCTTTTGAATACATGGTCGATC | 184 |
| ompF | ompF-F ompF-R | ACCTGGCAGCGAACTACG AACATCACCGATACCTTCTACG | 174 |
| 16S | 16S-F 16S-R | AACTCTGTTATTAGGGAAGAACA GCTTTACGCCCAGTAATTCC | 196 |
Table 2.
Effect of Radix Paeoniae Rubra aqueous extract (RPRE) on the proliferation of E. coli O101
| RPRE (mg/mL) | Bacterial growth rate (%) |
|---|---|
| 0 | 100.00 ± 0.00 |
| 1 | 86.75 ± 0.37 |
| 2 | 87.68 ± 0.33 |
| 4 | 84.66 ± 0.15 |
| 8 | 85.36 ± 0.40 |
| 16 | 85.15 ± 0.19 |
| 32 | 85.81 ± 0.40 |
| 64 | 75.71 ± 0.33 |
| 128 | 70.61 ± 0.36 |
Table 3.
Minimum inhibitory concentrations (MIC) of antibiotics against E. coli O101 used with Radix Paeoniae Rubra aqueous extract
| Type | Antibiotic | MIC (μg/mL) | CLSI M100 33rd edition E. coli breakpoint (μg/mL) | Low resistance (R ≤ MIC < 2R) (μg/mL)† | Moderate resistance (2R ≤ MIC < 4R) (μg/mL)† | High resistance (MIC ≥ 4R) (μg/mL)† | Noted resistance | ||
|---|---|---|---|---|---|---|---|---|---|
| S | I | R | |||||||
| Aminoglycosides | Gentamicin | 16 | ≤4 | 8 | ≥16 | 16–31 | 32–63 | ≥64 | Low |
| Kanamycin | 128 | ≤16 | 32 | ≥64 | 64–127 | 128–255 | ≥256 | Moderate | |
| Streptomycin | 32 | — | — | — | Moderate‡ | ||||
| Spectinomycin | 128 | ≤32 | 64 | ≥128 | 128–255 | 256–511 | ≥512 | Low | |
| Tetracyclines | Tetracycline hydrochloride | 16 | ≤4 | 8 | ≥16 | 16–31 | 32–63 | ≥64 | Low |
| Doxycycline | 16 | ≤4 | 8 | ≥16 | 16–31 | 32–63 | ≥64 | Low | |
| Cephalosporins | Cephalexin | 64 | ≤8 | 16 | ≥32 | 32–63 | 64–127 | ≥128 | Moderate |
| Sulphonamides | Sulphadimethoxine§ | >256 | ≤256 | — | ≥512 | 512–1,023 | 1,024–2,047 | ≥2,048 | Low |
| Macrolides | Tilmicosin | >256 | — | — | ≥16 | 16–31 | 32–63 | ≥64 | High |
| Amphenicols | Florfenicol | 16 | ≤8 | — | ≥16 | 16–31 | 32–63 | ≥64 | Low |
| Quinolones | Enrofloxacin | 16 | ≤1 | — | ≥4 | 4–7 | 8–16 | ≥16 | High |
1‡ – based on the CLSI breakpoint for gentamicin as a same-class antimicrobial in the absence of one for streptomycin against E. coli;
1§ – an MIC of >256 μg/mL was noted (the highest concentration tested); bacterial growth was only inhibited by ~22% at 256 μg/mL. Therefore, E. coli O101 was classified as low-level resistant. For drugs without a CLSI specified resistance concentration below which E. coli resistance is known, but with a determined MIC higher than the breakpoints of similar drugs, E. coli O101 was marked as resistant
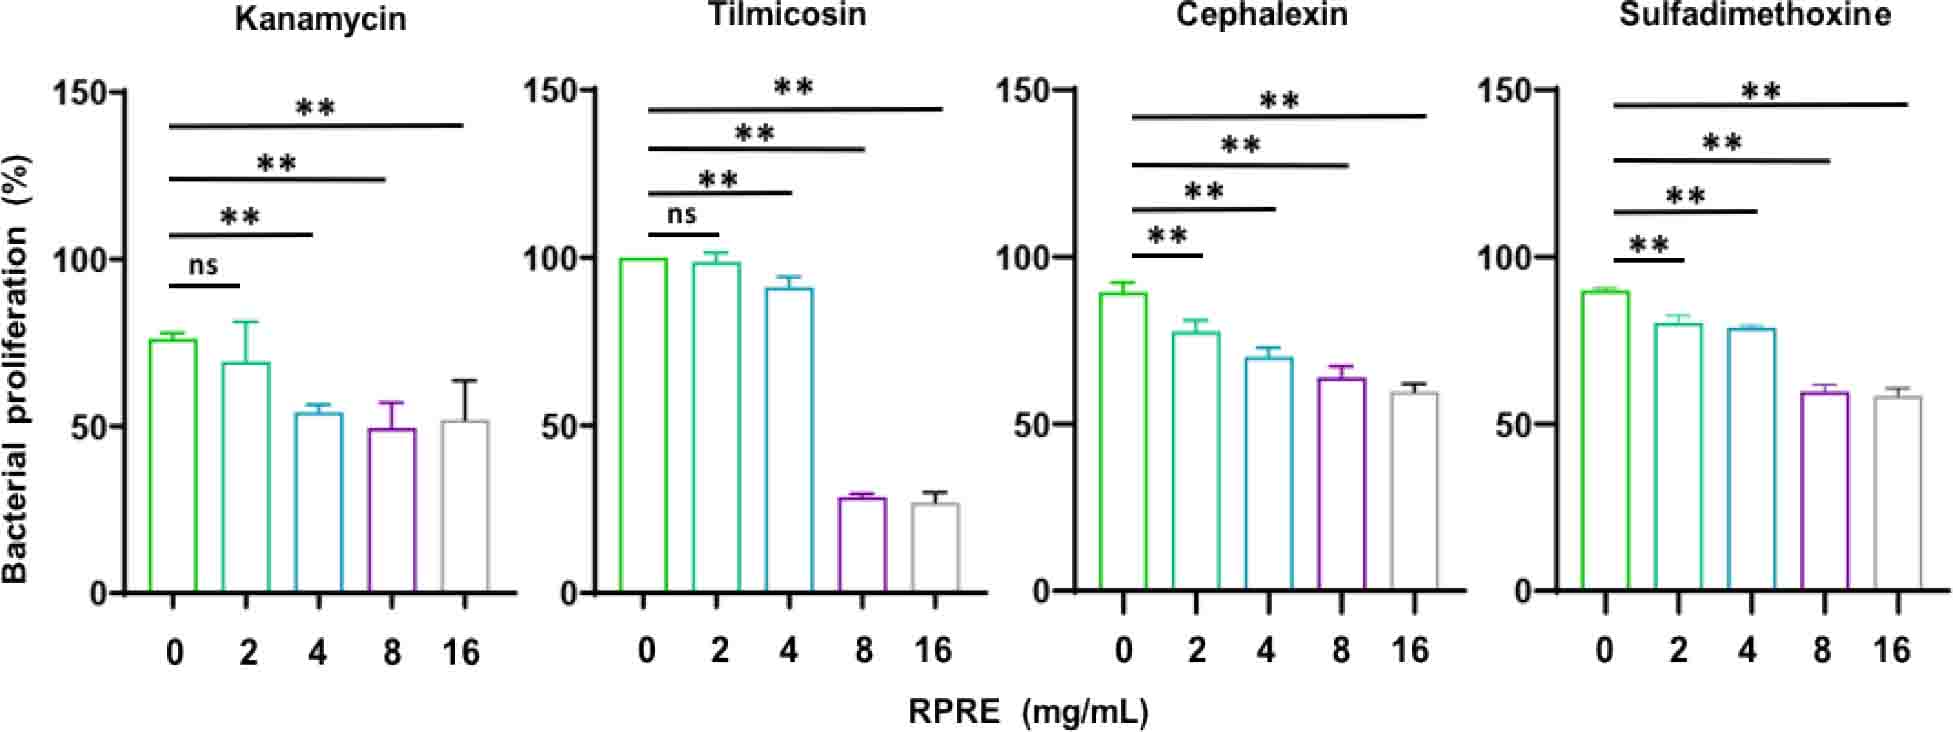
Fig. 1.
Effect of Radix Paeoniae Rubra aqueous extract (RPRE) on the antimicrobial resistance of E. coli O101. Growth of untreated control E. coli was taken as 100%, and bacterial growth in the treatment groups was calculated in relation to that benchmark. Data are expressed as mean ± SD (n = 3). ** – P < 0.01; ns – not significant (P > 0.05)
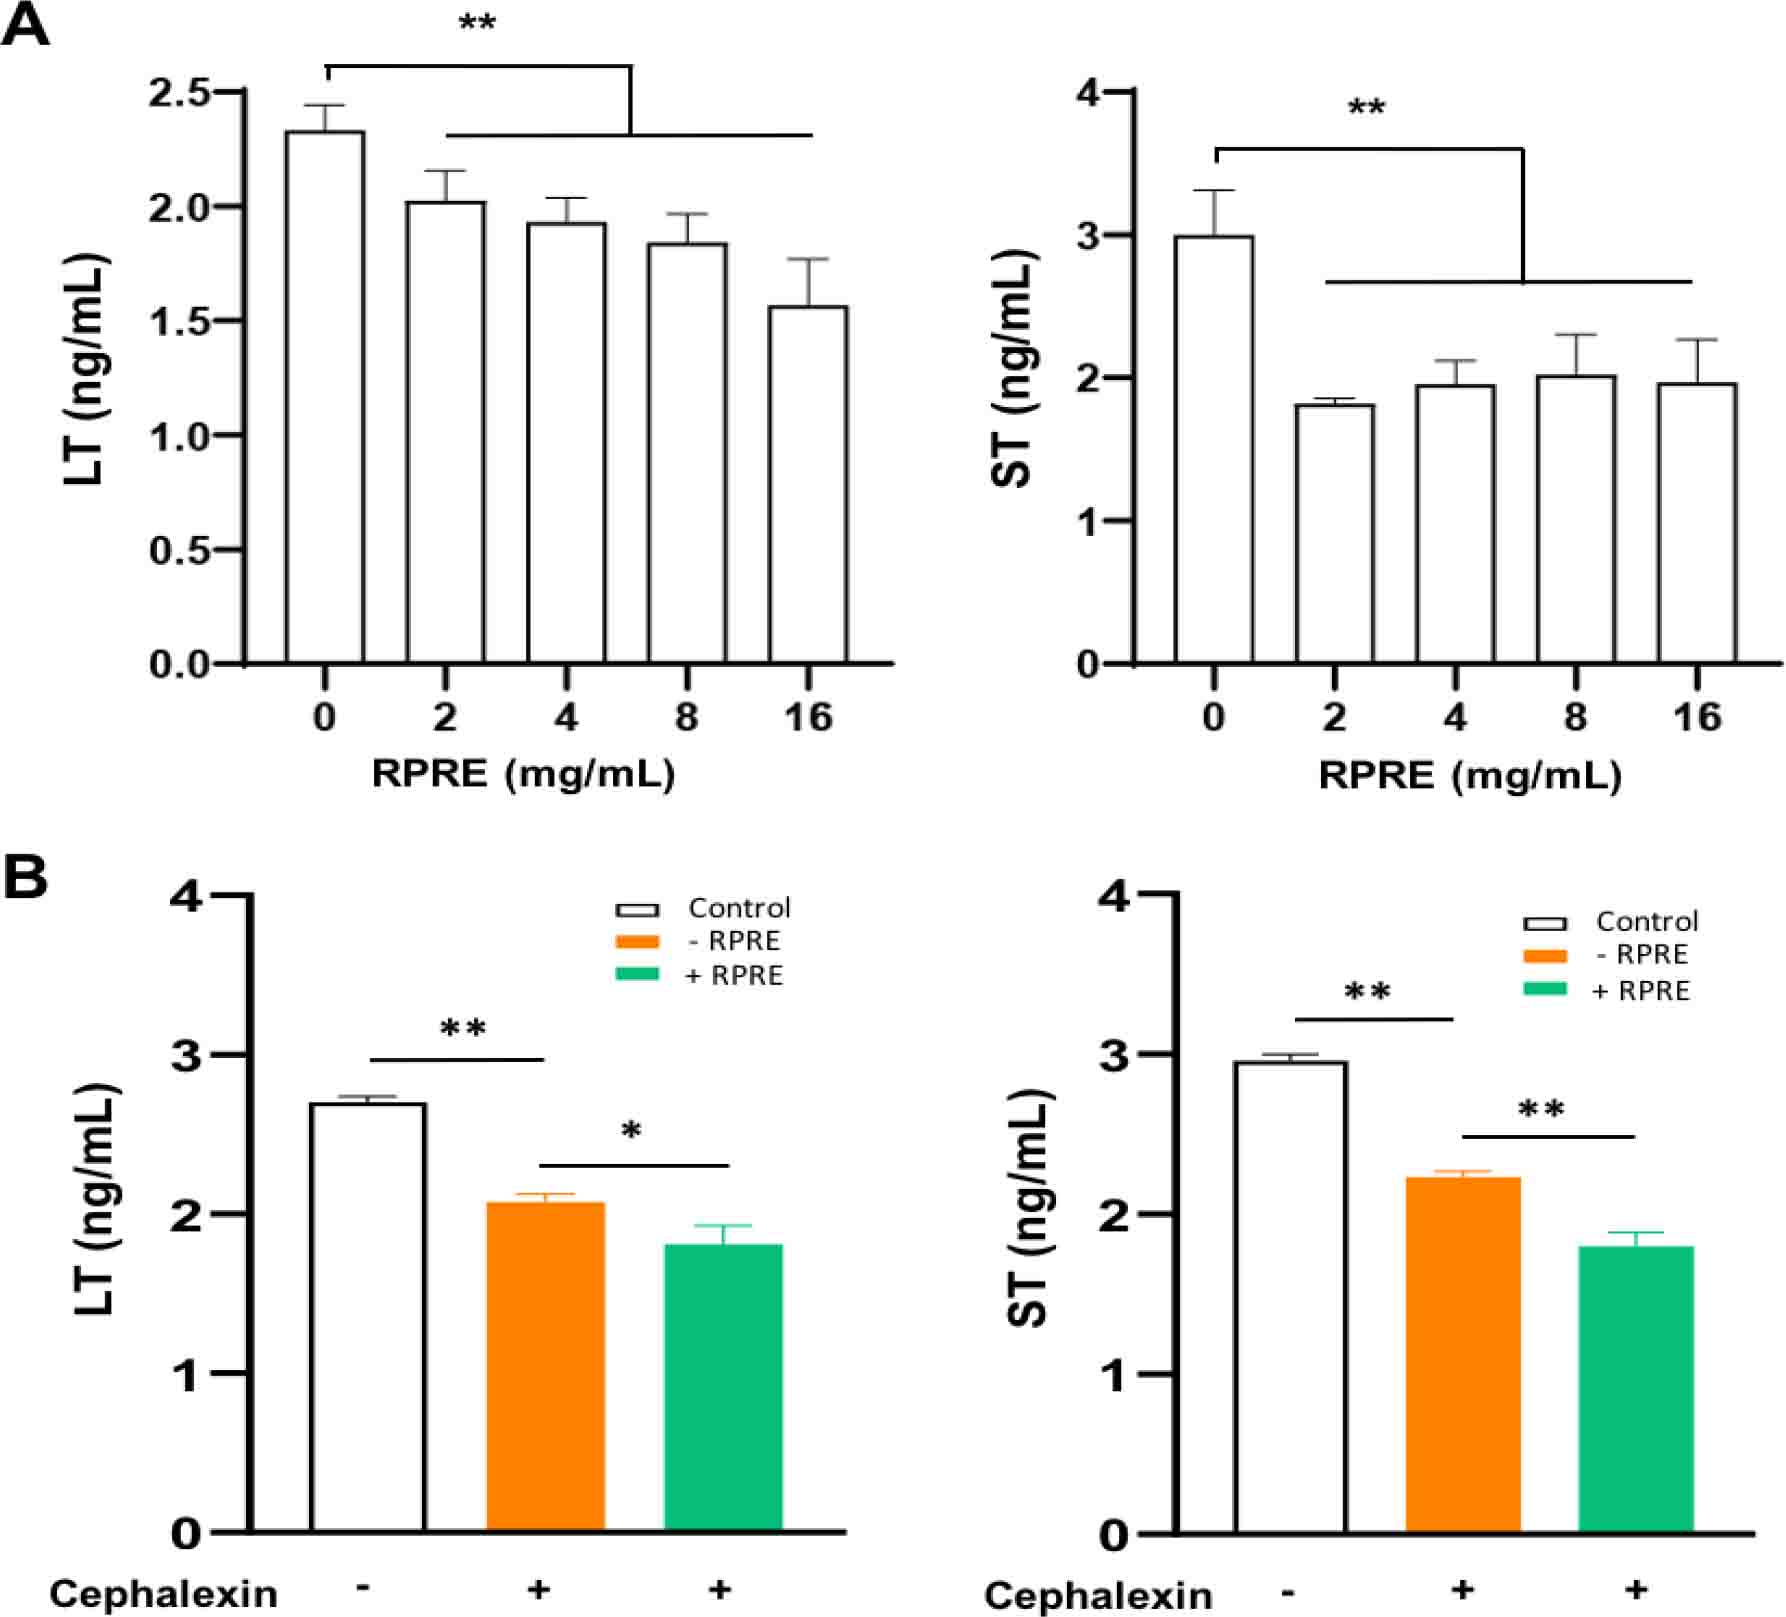
Fig. 2.
Effect on the secretion of E. coli O101 virulence factor proteins of 24-h incubation in Radix Paeoniae Rubra aqueous extract (RPRE). A – secretion with RPRE at concentrations ranging 0–16 mg/mL and without cephalexin; B – secretion with RPRE at 4 mg/mL and cephalexin at 4 μg/mL. Data are expressed as mean ± SD (n = 3). * – P < 0.05; ** – P < 0.01
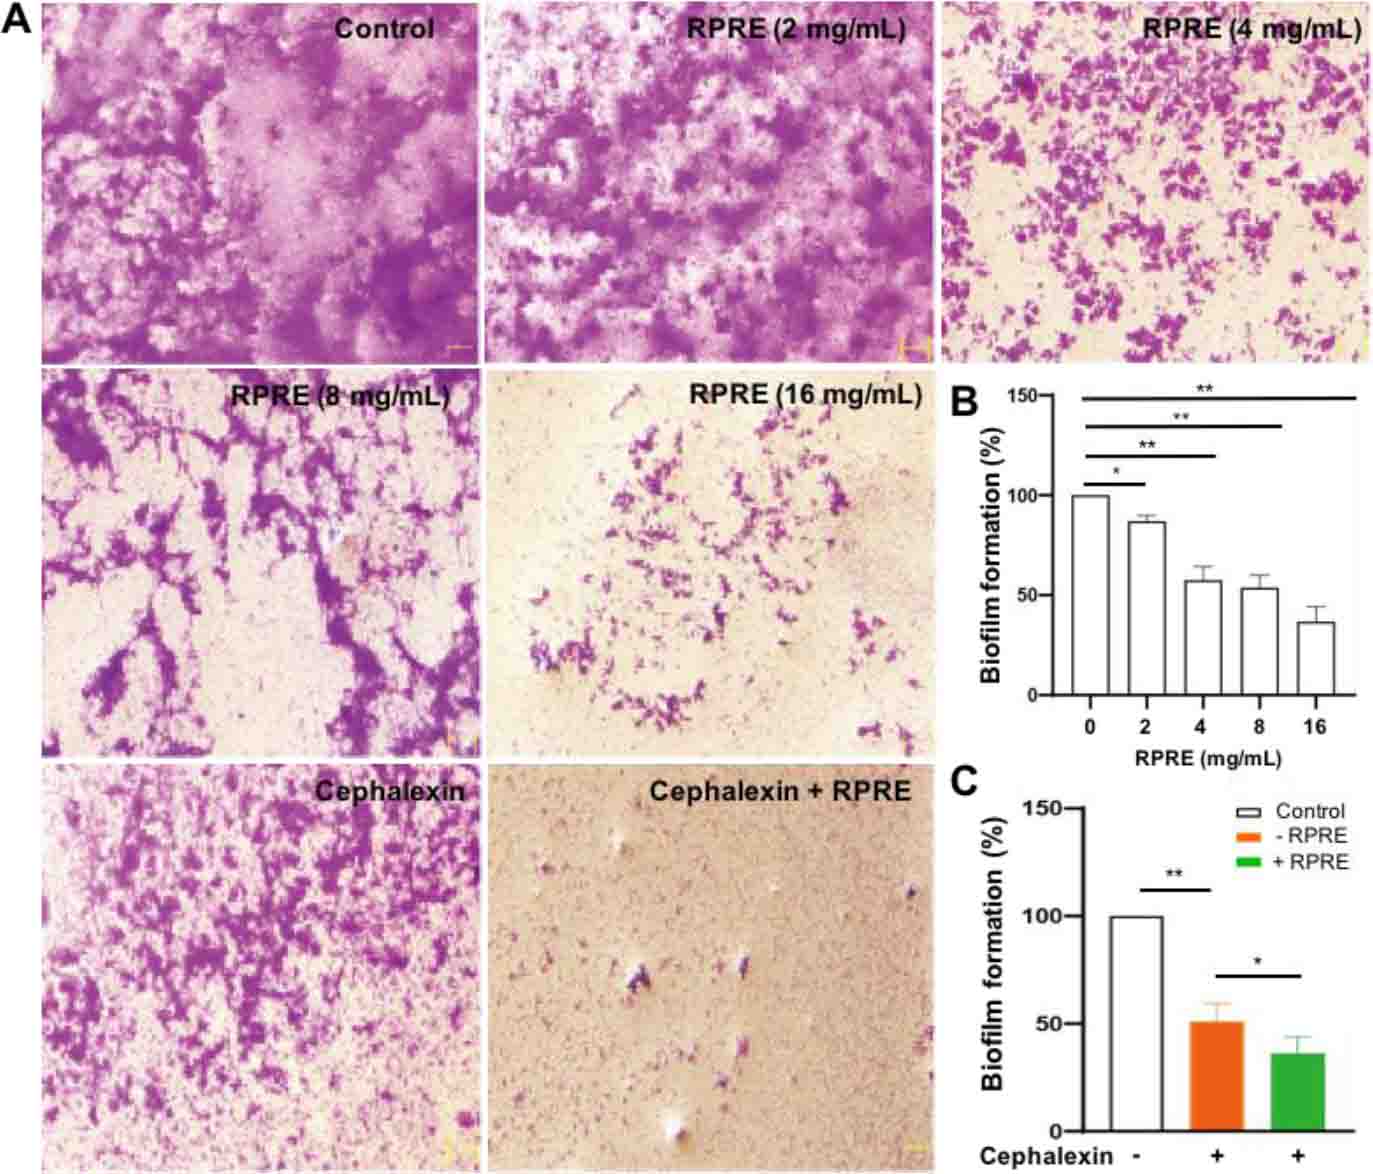
Fig. 3.
Effect on the biofilm formation of E. coli O101 of three-day incubation in Radix Paeoniae Rubra aqueous extract (RPRE) with or without treatment with cephalexin at 32 μg/mL. A – micrographs of crystal violet–stained biofilm; B and C – biofilm formation by untreated E. coli was taken as 100%, and the biofilm formation in the treatment groups was calculated in relation to that benchmark. Data are expressed as mean ± SD (n = 3). * – P < 0.05; ** – P < 0.01
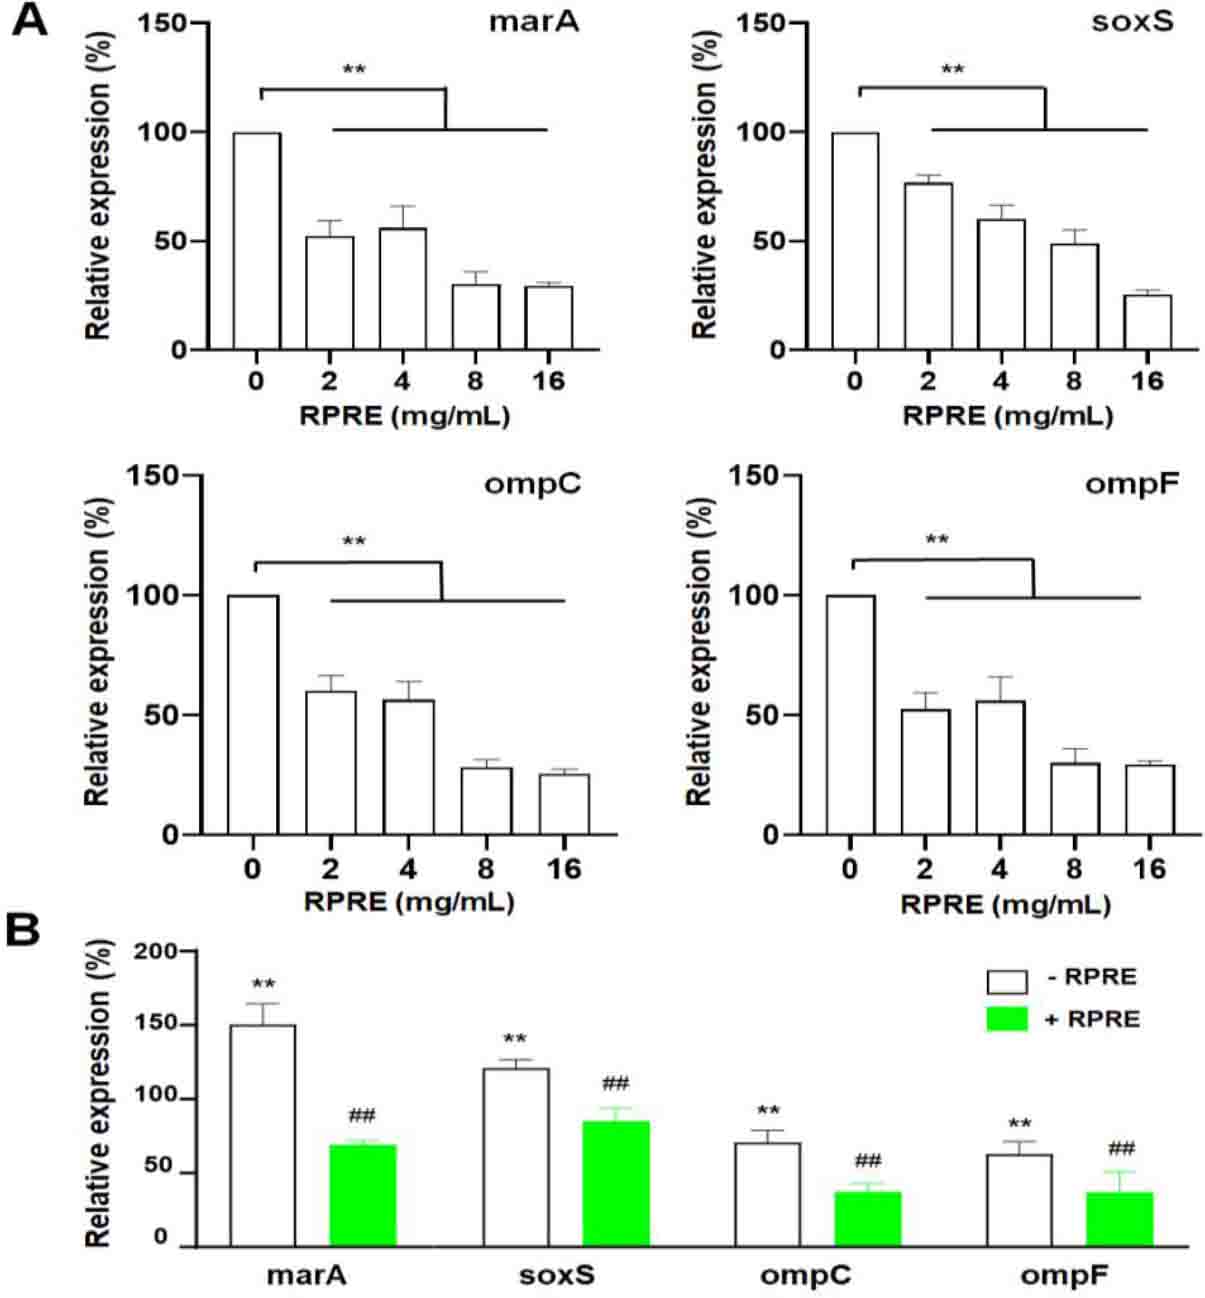
Fig. 4.
Effect on the expression of E. coli O101 efflux pump and outer membrane porin genes of 24-h incubation in Radix Paeoniae Rubra aqueous extract (RPRE) with or without treatment with cephalexin at 32 μg/mL. A – expression with RPRE in concentrations ranging 0–16 mg/mL; B – expression with RPRE at 4 mg/mL and cephalexin at 32 μg/mL. Expression by untreated E. coli was taken as 100%, and the expression in the treatment groups was calculated in relation to that benchmark. Data are expressed as mean ± SD (n = 3). ** – significant difference compared with the blank control (P < 0.01); ## – significant difference compared with the group without RPRE treatment (P < 0.01)