Fig 1.
Fig 2.
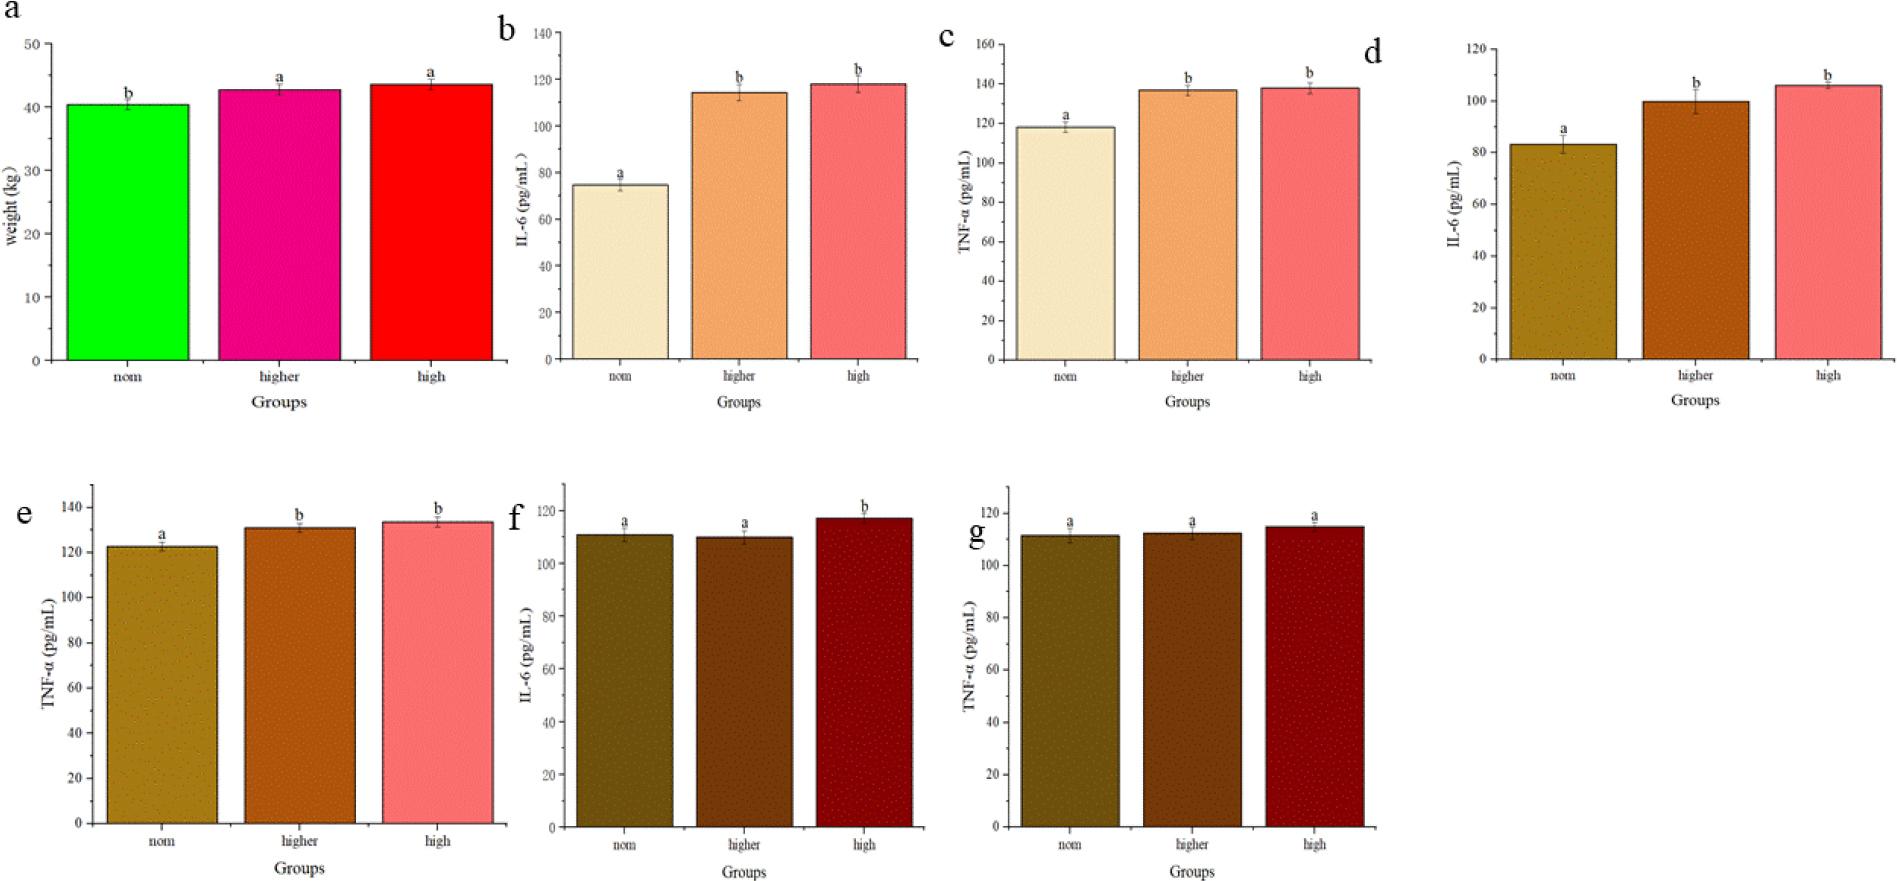
Fig. 3.
Fig. 4.
Fig. 5.
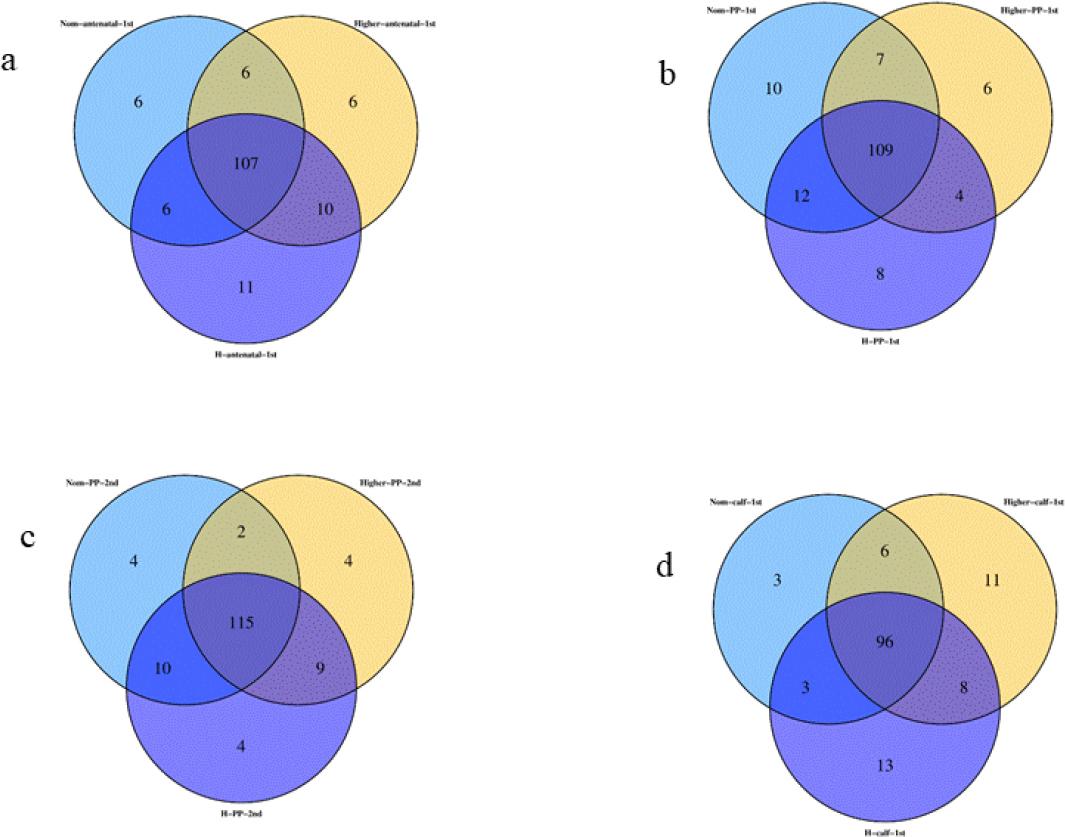
Fig. 6.
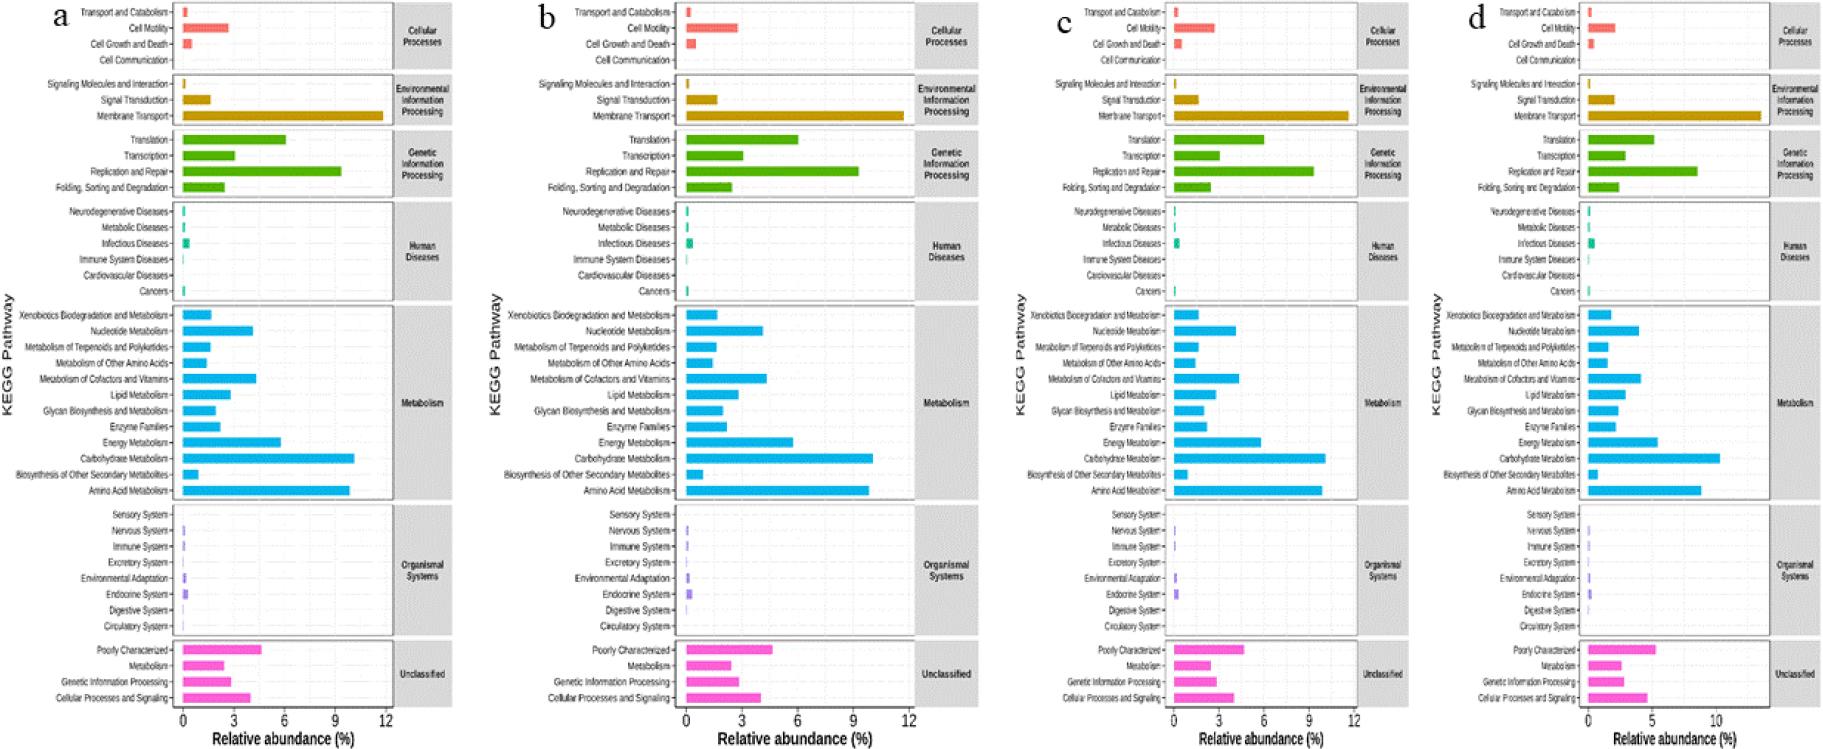
Fig.7.

© 2025 Liang Chi, Yukun Yue, Rui Cao, Xinxin Zhang, Sishuang Wang, Jingxian Li, Yuhan Bing, Ruiguo Wang, Huanqi Liu, published by National Veterinary Research Institute in Pulawy
This work is licensed under the Creative Commons Attribution 4.0 License.