
Table 1.
Experimental groups of rainbow trout challenged with fliC gene–repressed (024) and fliC gene–expressing (R57) Yersinia ruckeri strains
| Group | Bacterial strain | Infectious dose (CFU/fish) | n | Repetitions |
|---|---|---|---|---|
| C | - | - | 10 | 1 |
| 024-L | 024PP2020 | 2 × 10⁵ | 10 | 2 |
| 024-H | 024PP2020 | 2 × 10⁶ | 10 | 2 |
| R57-L | R57 | 2 × 10⁵ | 10 | 2 |
| R57-H | R57 | 2 × 10⁶ | 10 | 2 |
Table 2.
Multi-locus sequence typing (MLST) and core-genome MLST (cgMLST) for Yersinia ruckeri infection model strains
| Isolate | Typing scheme | Sequence type | Housekeeping genes in the scheme (reference) | ||||||
|---|---|---|---|---|---|---|---|---|---|
| Y. ruckeri 024PP2020 Y. ruckeri R57 | MLST McNally (12) | 44 44 | aarF (13) aarF (13) | dfp (10) dfp (10) | galR (14) galR (14) | glnS (13) glnS (13) | hemA (15) hemA (15) | rfaE (14) rfaE (14) | speA (14) speA (14) |
| Y ruckeri 024PP2020 Y. ruckeri R57 | MLST Bastardo (4) | 33 33 | dnaJ (1) dnaJ (1) | glnA (1) glnA (1) | gyrB(1) gyrB(1) | hsp60 (1) hsp60 (1) | recA (5) recA (5) | thrA (5) thrA (5) | - - |
| Y ruckeri 024PP2020 Y ruckeri R57 | cgMLST | 1927 1927 | - - | ||||||
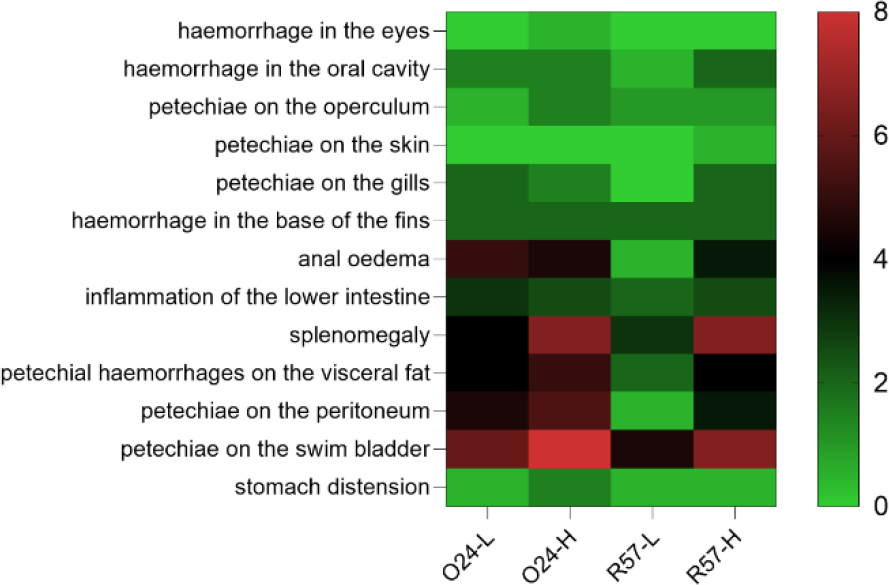
Fig. 1.
Frequency of clinical symptoms and pathological changes in rainbow trout challenged with fliC gene–repressed (024) and fliC gene–expressing (R57) Yersinia ruckeri strains. The result is the average of two repetitions. L – low infectious dose; H – high infectious dose. Colour gradient corresponds to the mean number of individuals showing clinical symptoms
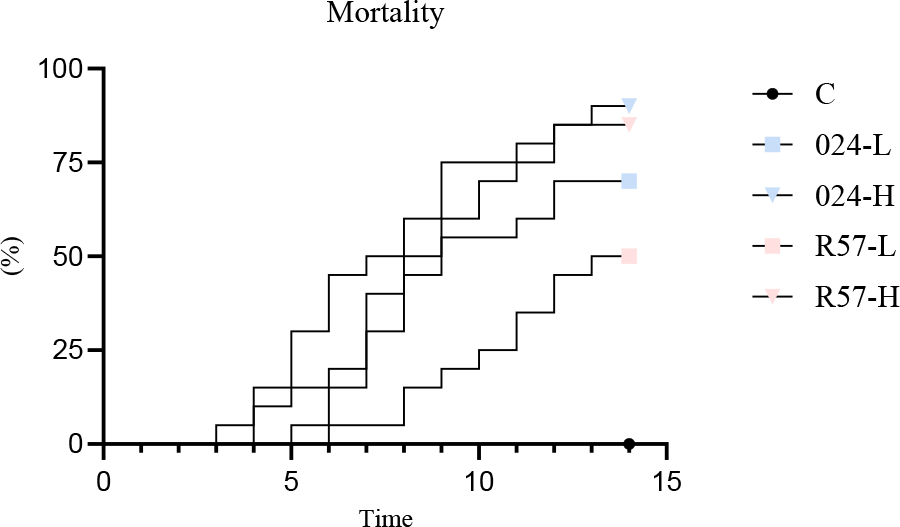
Fig. 2.
Mortality of rainbow trout challenged with fliC gene–repressed (024) and fliC gene–expressing (R57) Yersinia ruckeri strains. Mortality in the negative control group lies along the X-axis. L – low infectious dose; H – high infectious dose
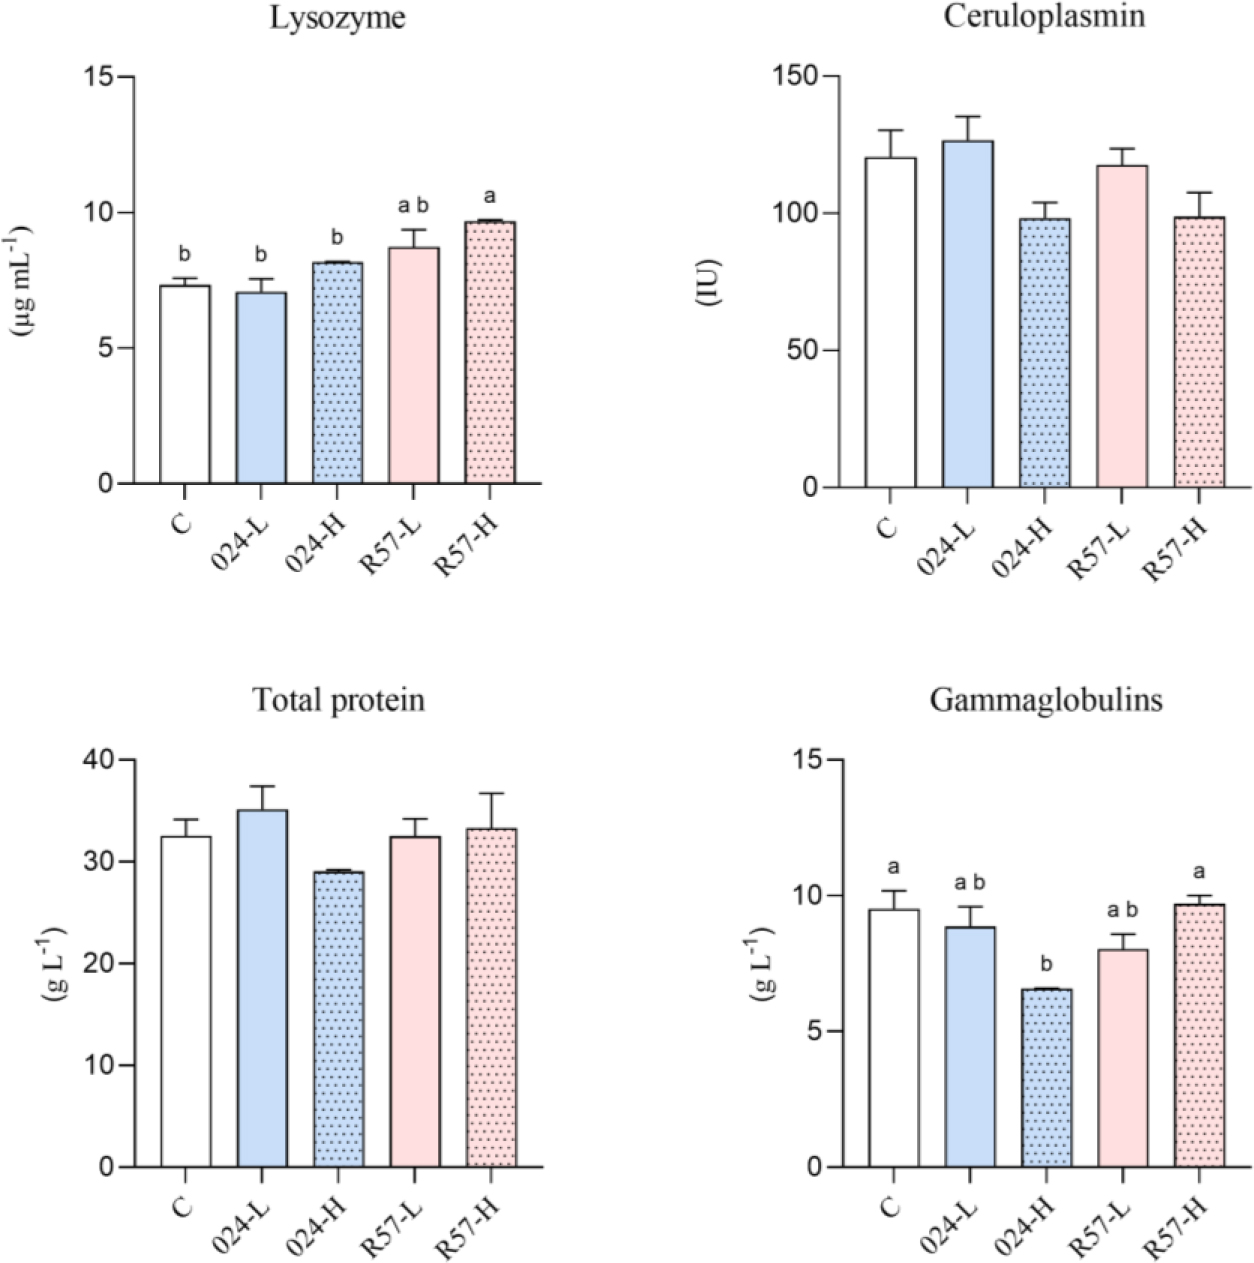
Fig. 3.
The humoral-mediated immune parameters in serum of rainbow trout challenged with fliC gene–repressed (024) and fliC gene–expressing (R57) Yersinia ruckeri strains. All data are expressed as mean + standard error of the mean. Different letters indicate significant differences (P-value < 0.05), shared or the same letters indicate no significant differences between groups
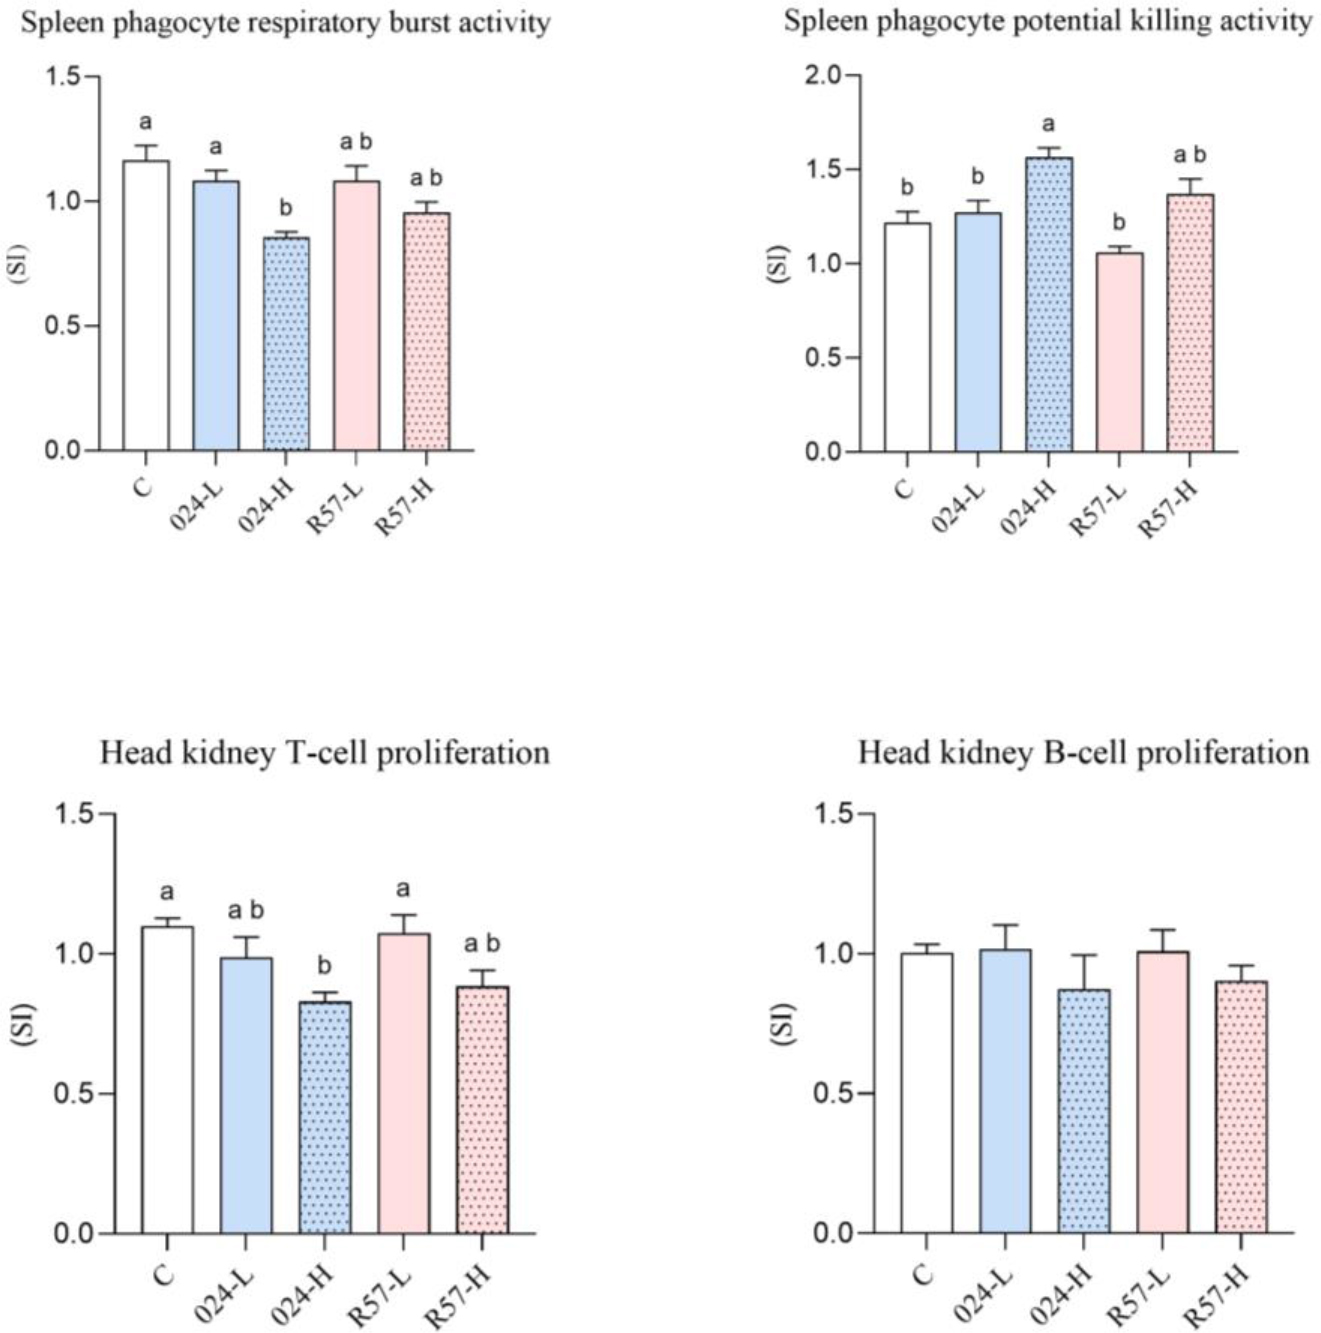
Fig. 4.
The cell-mediated immune parameters of rainbow trout challenged with fliC gene–repressed (024) and fliC gene–expressing (R57) Yersinia ruckeri strains. All data are expressed as stimulation index + standard error of the mean. Different letters indicate significant differences (P-value < 0.05), and shared or the same letters indicate no significant differences between groups