
Table 1.
Comparison of the number of wild boar serum samples collected in 2023 from particular voivodeships tested for the presence of anti-Brucella antibodies using the ELISA
| Voivodeships | Number of the serum samples | ||
|---|---|---|---|
| tested | positive | negative | |
| Dolnośląskie | 51 | 10 | 41 |
| Kujawsko-Pomorskie | 31 | 11 | 20 |
| Lelskie | 37 | 9 | 28 |
| Lubuskie | 26 | 2 | 24 |
| Łódzkie | 31 | 21 | 10 |
| Małopolskie | 31 | 4 | 27 |
| Mazowieckie | 14 | 5 | 9 |
| Opolskie | 31 | 14 | 17 |
| Podkarpackie | 45 | 23 | 22 |
| Pomorskie | 31 | 5 | 26 |
| Śląskie | 31 | 5 | 26 |
| Świętokrzyskie | 31 | 7 | 24 |
| Warmińsko-Mazurskie | 31 | 9 | 22 |
| Wielkopolskie | 34 | 7 | 27 |
| Zachodniopomorskie | 45 | 9 | 36 |
| TOTAL | 500 | 141 | 359 |
Table 2.
Comparison of the number of wild boar serum samples collected in 2024 from particular voivodeships tested for the presence of anti-Brucella antibodies using the ELISA
| Voivodeships | Number of the serum samples | ||
|---|---|---|---|
| tested | positive | negative | |
| Kujawsko-Pomorskie | 217 | 76 | 141 |
| Lubelskie | 56 | 27 | 29 |
| Łódzkie | 99 | 12 | 87 |
| Opolskie | 25 | 3 | 22 |
| Podkarpackie | 13 | 3 | 10 |
| Warmińsko-Mazurskie | 90 | 22 | 68 |
| TOTAL | 500 | 143 | 357 |
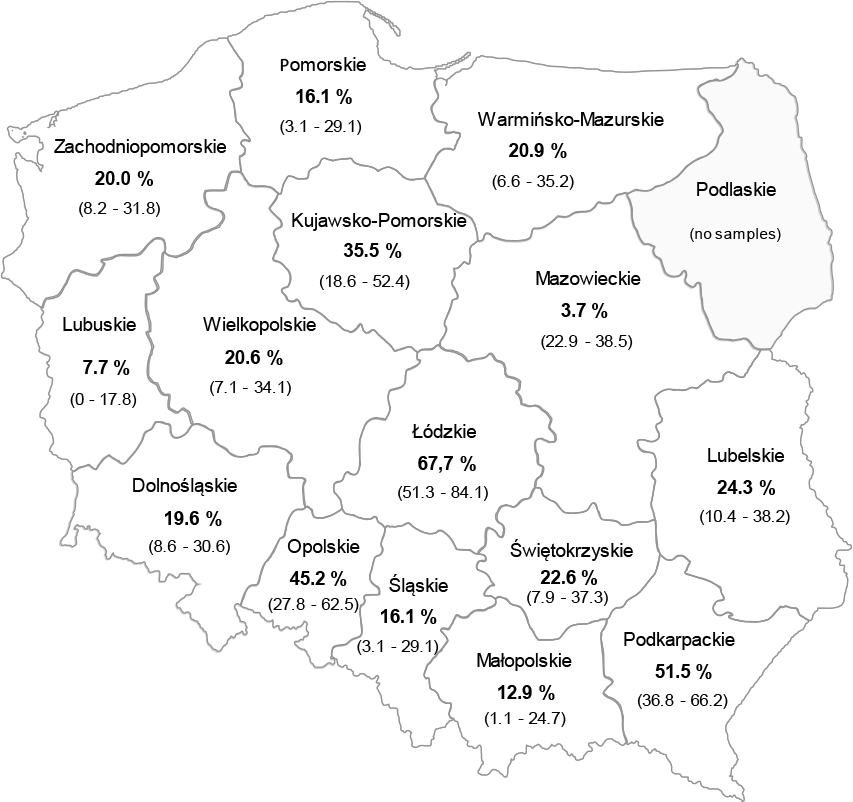
Fig. 1.
Percentage distribution of serum samples with positive ELISA results for anti-Brucella antibodies in individual voivodeships in 2023. The ranges of 95 % confidence intervals are presented in parentheses
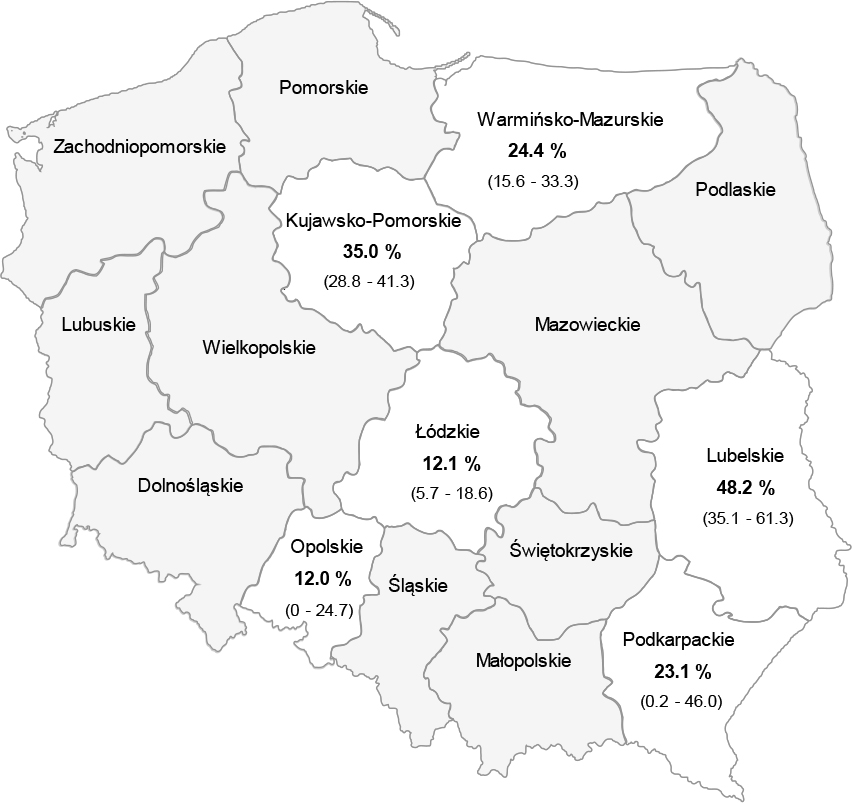
Fig. 2.
Percentage distribution of serum samples with positive ELISA results in 2024 from selected voivodeships that showed increased seroprevalence in the previous year. The ranges of 95 % confidence intervals are presented in parentheses