
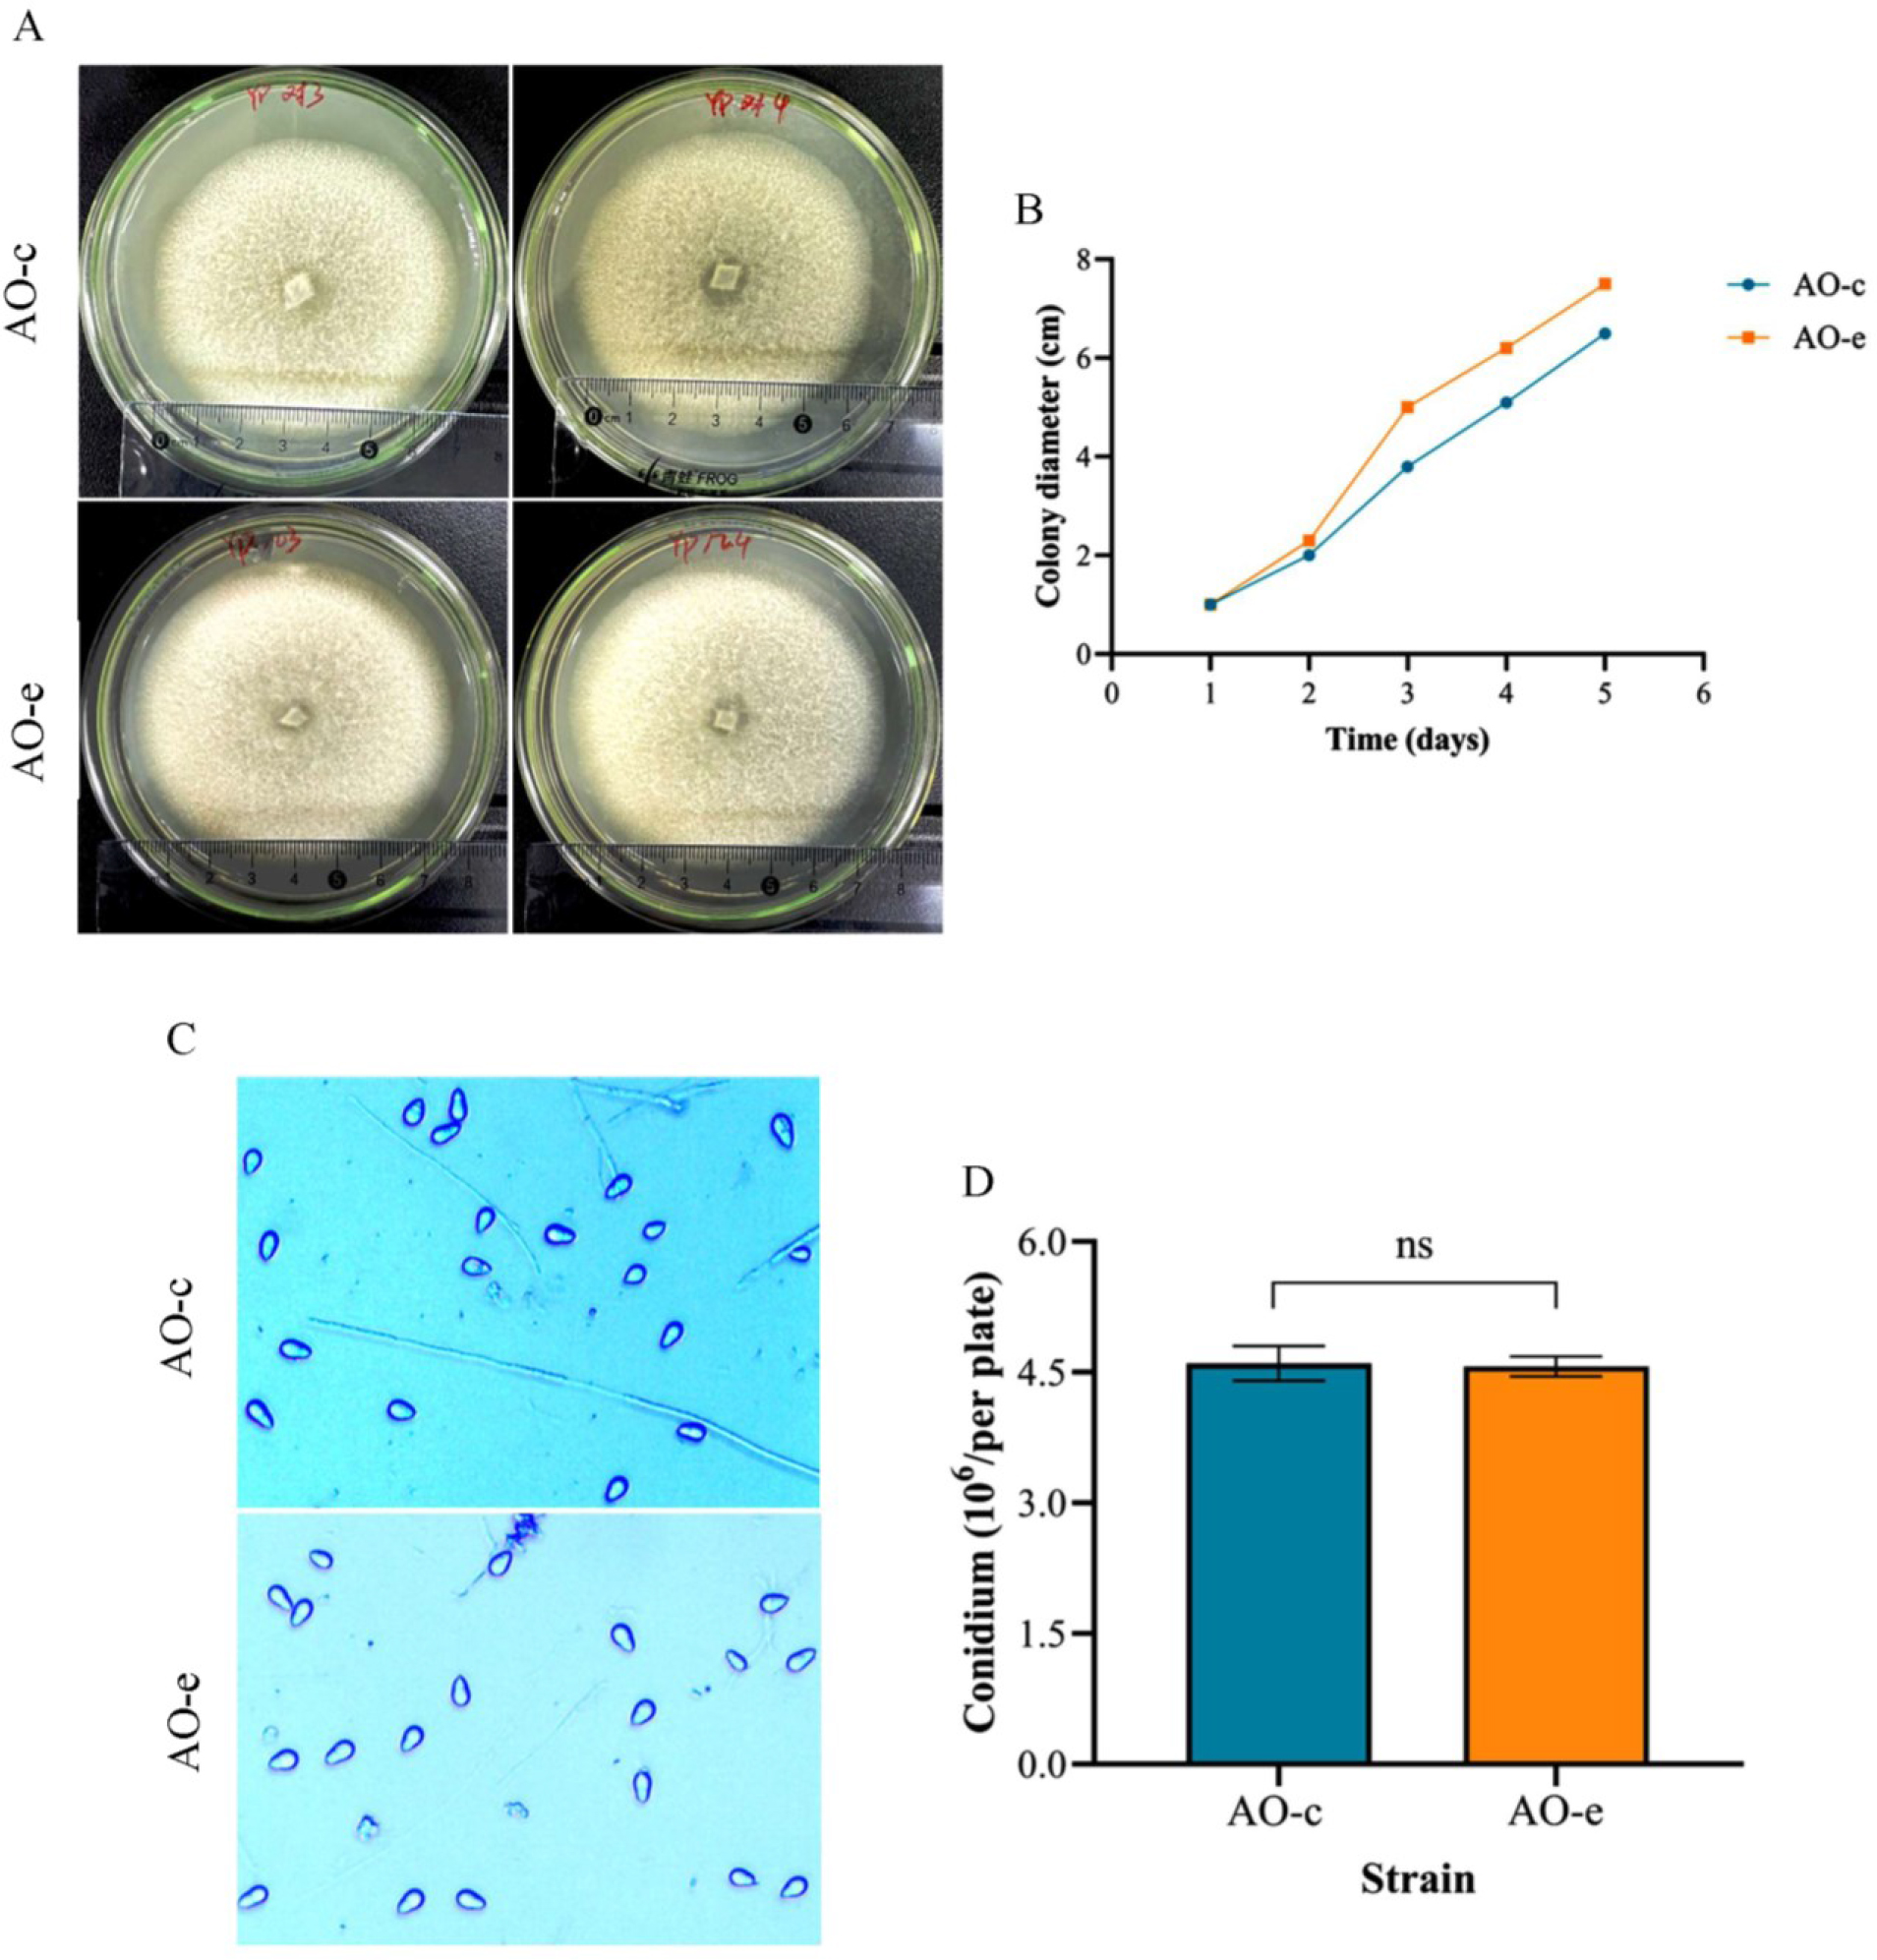
Fig. 1.
Comparison of the growth rate and sporulation capacity of mycelia in Arthrobotrys oligospora before and after chitin interaction. A and B – the colony morphology and its mycelial growth rate; C and D – sporulation ability. AO-c – control group; AO-e – experimental group
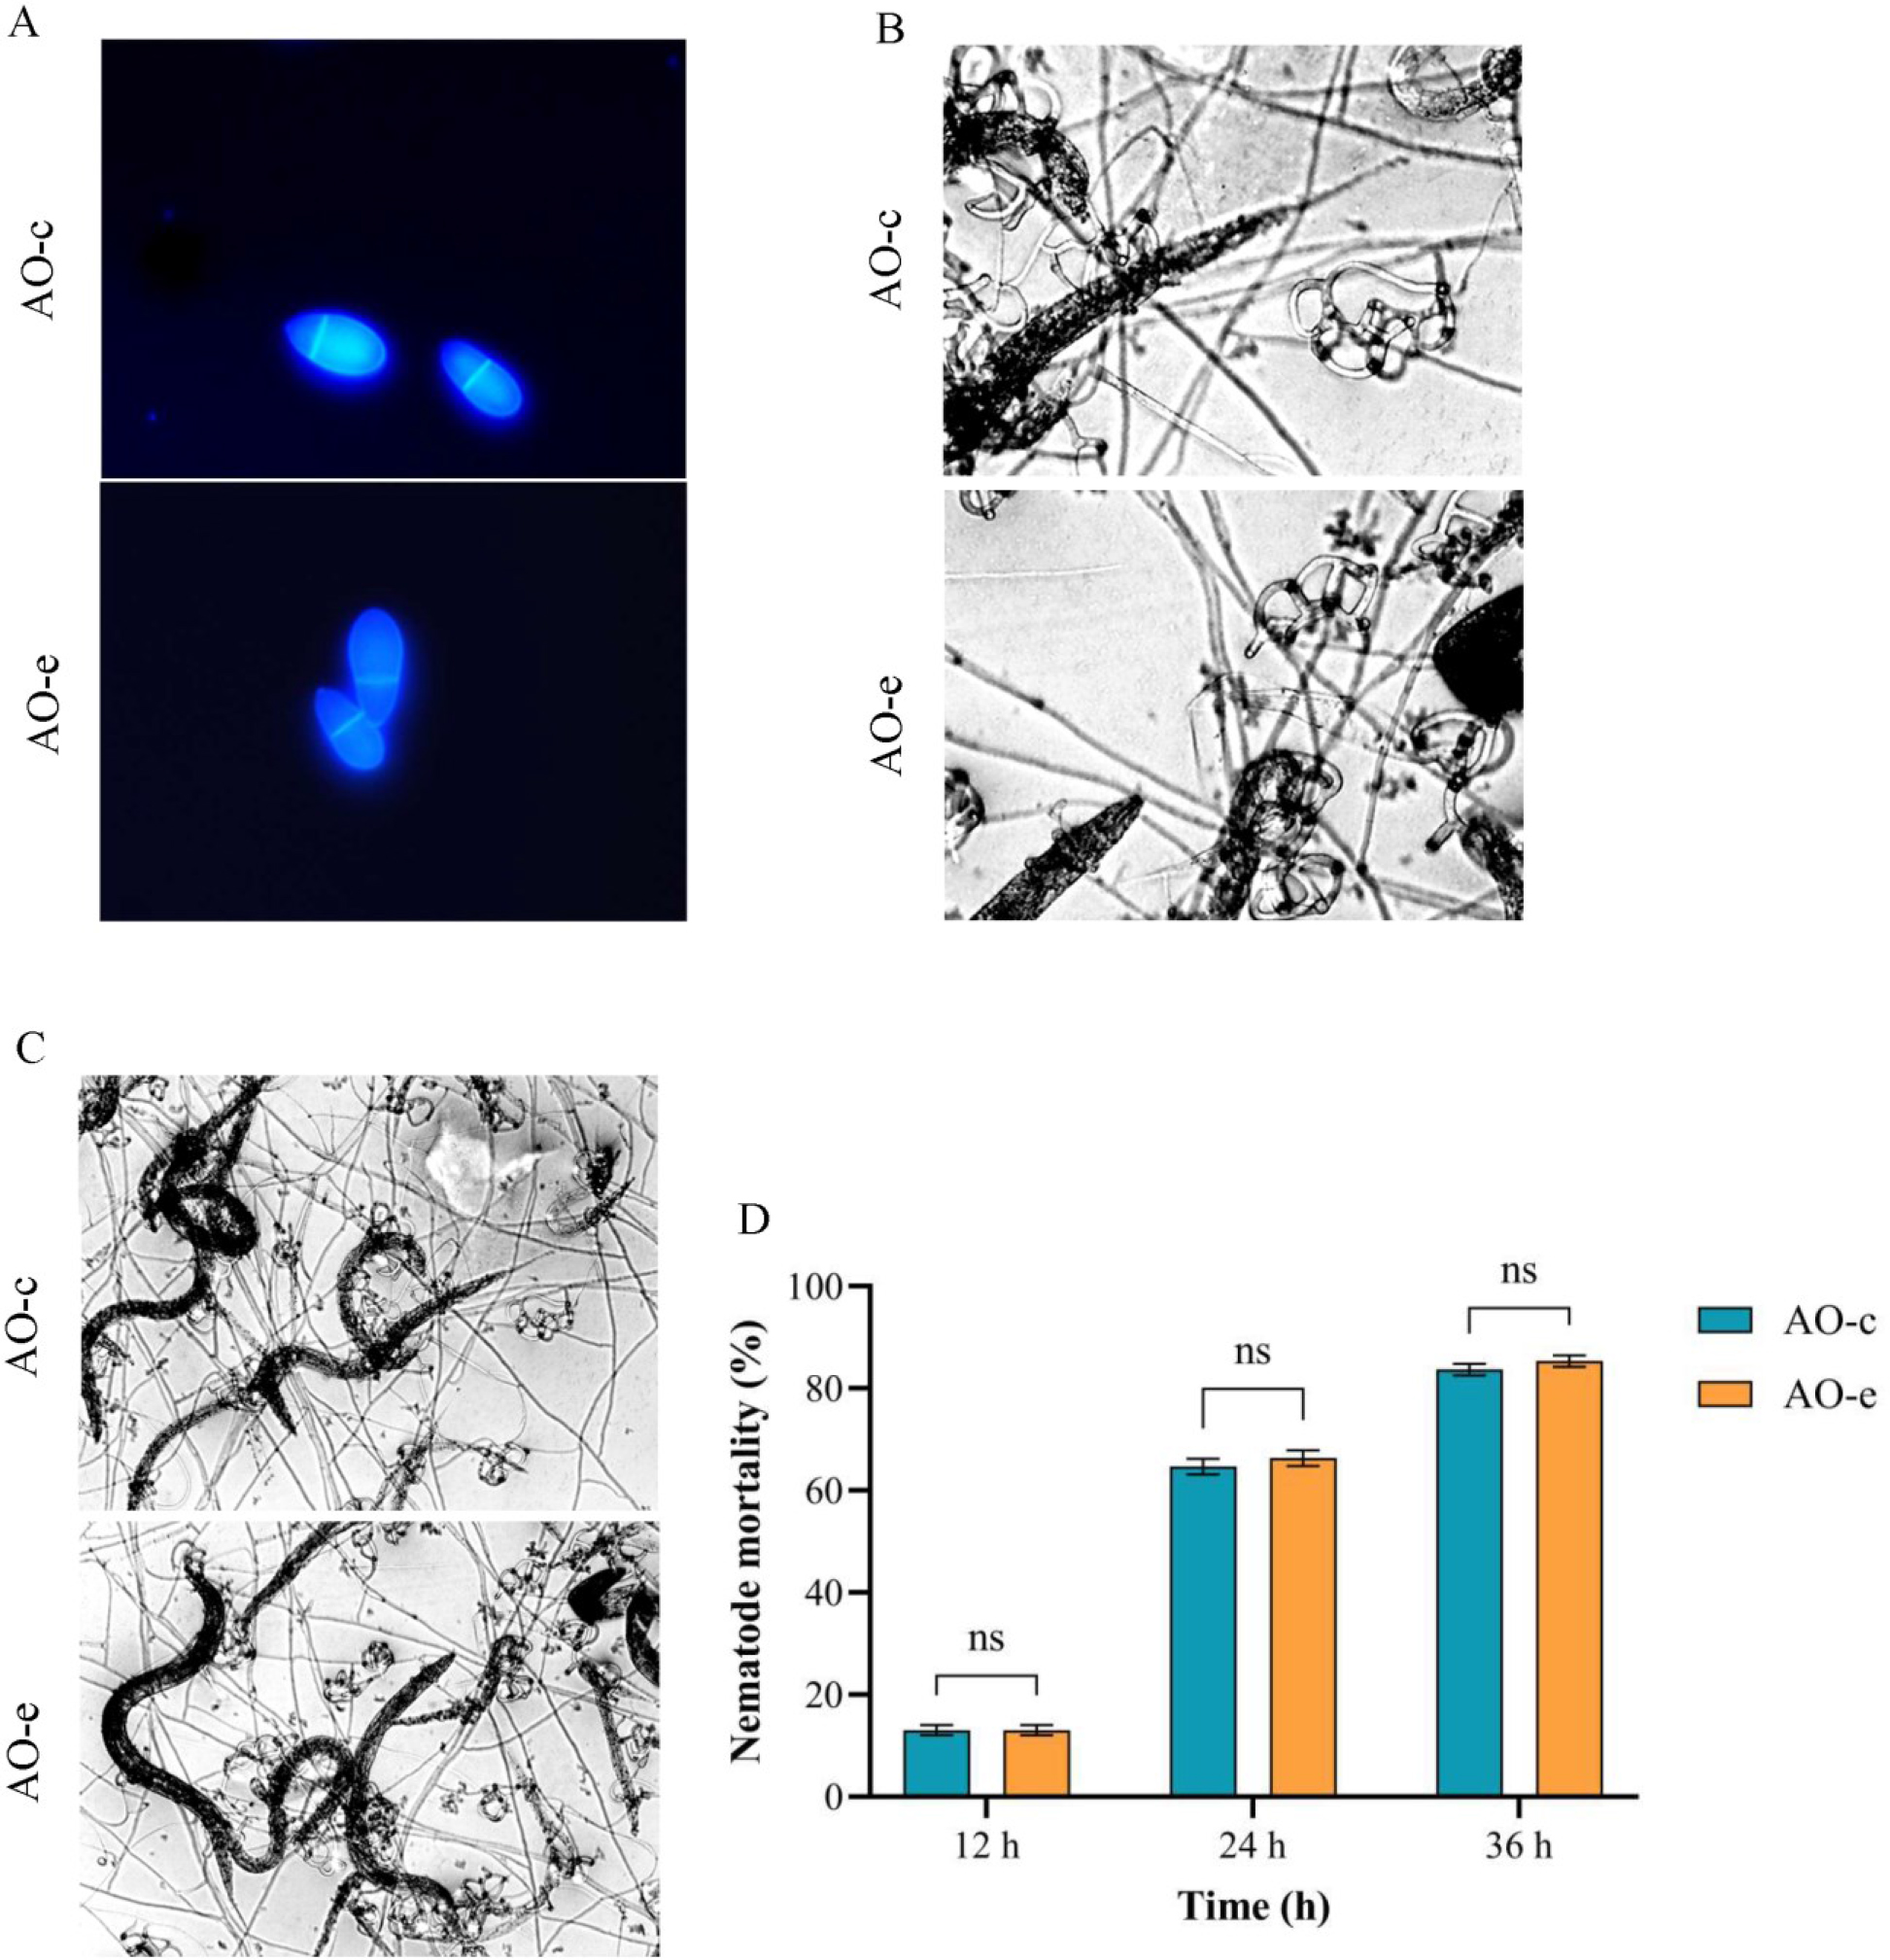
Fig. 2.
Comparison of morphology, predation structure and predation ability of spores in Arthrobotrys oligospora before and after chitin interaction. A – spore morphology; B – predation structure; C and D – predation ability on nematodes. AO-c – control group; AO-e – experimental group
Table 1.
The top 10 proteins with differentially upregulated expression among non-intersection proteins of Arthrobotrys oligospora after chitin interaction
| Protein ID | Protein name | Gene name | Score |
|---|---|---|---|
| G1X8M1 | Ubiquitin-like domain-containing protein | AOL_s00078g37 | 323.31 |
| A0A8H8UWC8 | V-type proton ATPase subunit | AOL_s00109g205 | 313.43 |
| A0A7C8N5S6 | Superoxide dismutase | AOL_s00170g93 | 277.7 |
| G1XBG1 | Ribosomal protein S15 | AOL_s00078g258 | 266.86 |
| G1XJC0 | AA1-like domain-containing protein | AOL_s00097g447 | 173.69 |
| A0A7C8KEK2 | Copper acquisition factor BIM1-like domain-containing protein | EYR41_002241 | 147.12 |
| A0A8H2E0I4 | Neutral ceramidase | AOL_s00076g455 | 141.71 |
| A0A7C8NSM9 | Uncharacterised protein | AOL_s00076g540 | 109.37 |
| G1XJ38 | Ribosomal protein S7 domain-containing protein | AOL_s00097g365 | 99.319 |
| G1WY88 | SAC domain-containing protein | AOL_s00004g248 | 72.201 |
Table 2.
The top 10 proteins with differentially downregulated expression among non-intersection proteins of Arthrobotrys oligospora after chitin interaction
| Protein ID | Protein name | Gene name | Score |
|---|---|---|---|
| A0A7C8UKJ8 | GH16 domain-containing protein | AOL_s00007g459 | 323.31 |
| A0A7C8N8K3 | Ribonuclease II/R domain-containing protein | AOL_s00173g295 | 323.31 |
| G1XD83 | Sla2 Src-like adaptor 2 | AOL_s00079g186 | 303.54 |
| G1XIU1 | Glycosyl transferase family 1 domain-containing protein | AOL_s00097g268 | 275.82 |
| A0A7C8NE69 | Aminotransferase class V domain-containing protein | TWF102_003885 | 239.24 |
| G1XCR6 | Hsp70 protein that interacts with Zuo1p | AOL_s00079g236 | 231.82 |
| A0A6G1M536 | Uncharacterised protein | AOL_s00083g273 | 226.37 |
| A0A7C8P375 | Tubulin alpha chain | AOL_s00078g243 | 224.51 |
| A0A7C8UJ53 | 3-hydroxyacyl-CoA dehydrogenase NAD binding domain-containing protein | AOL_s00110g113 | 219.76 |
| G1WXJ7 | Uracil phosphoribosyl transferase | AOL_s00004g7 | 198.86 |
Table 3.
The top 10 proteins with differentially upregulated expression among intersection proteins of Arthrobotrys oligospora after chitin interaction
| Protein ID | Protein name | Gene name | Fold change |
|---|---|---|---|
| A0A7C8NPA7 | Chitinase | AOL_s00006g492 | 25.19742557 |
| G1XLE5 | Peptide hydrolase | AOL_s00110g315 | 13.27323346 |
| A0A7C8UMP1 | Beta-hexosaminidase | AOL_s00080g286 | 11.49963777 |
| A0A7C8PQM7 | Aminotransferase class I/class II domain-containing protein | AOL_s00004g264 | 7.175107854 |
| A0A7C8NRM1 | FAD dependent oxidoreductase domain-containing protein | AOL_s00117g57 | 6.570614843 |
| G1XG12 | Aminotransferase class I/class II domain-containing protein | AOL_s00081g305 | 5.443764901 |
| A0A7C8NZY3 | AA1-like domain-containing protein | AOL_s00043g141 | 4.887246226 |
| A0A7C8JS84 | Urease (fragment) | AOL_s00080g26 | 4.05366717 |
| A0A7C8K8Z4 | Glucose-methanol-choline oxidoreductase C-terminal domain-containing protein | AOL_s00006g571 | 4.050636221 |
| G1X3Q8 | Glucan 1,4-alpha-glucosidase | AOL_s00043g332 | 3.844588344 |
Table 4.
The top 10 proteins with differentially downregulated expression among intersection proteins of Arthrobotrys oligospora after chitin interaction
| Protein ID | Protein name | Gene name | Fold change |
|---|---|---|---|
| A0A7C8KHY8 | Translation elongation factor IF5A C-terminal domain-containing protein | AOL_s00112g56 | 0.261838199 |
| A0A7C8N2H5 | kinase domain-containing protein | AOL_s00079g254 | 0.246729316 |
| A0A7C8PAR5 | Vacuolar protease A | AOL_s00054g478 | 0.24519951 |
| G1XG20 | 60S ribosomal protein L3 | AOL_s00081g313 | 0.238139381 |
| A0A7C8V393 | 60S ribosomal protein L17 | AOL_s00097g411 | 0.226801505 |
| G1XMA1 | Uncharacterised protein | AOL_s00140g70 | 0.210533753 |
| A0A8H2DUD7 | Apple domain-containing protein | AOL_s00017g64 | 0.174564146 |
| G1XEX5 | PBP domain-containing protein | AOL_s00080g360 | 0.157891296 |
| A0A7C8R9J6 | Phosphatidylserine decarboxylase | AOL_s00097g76 | 0.150443331 |
| A0A7C8NXE9 | Translation elongation factor 1-alpha (fragment) | AOL_s00169g48 | 0.135301915 |
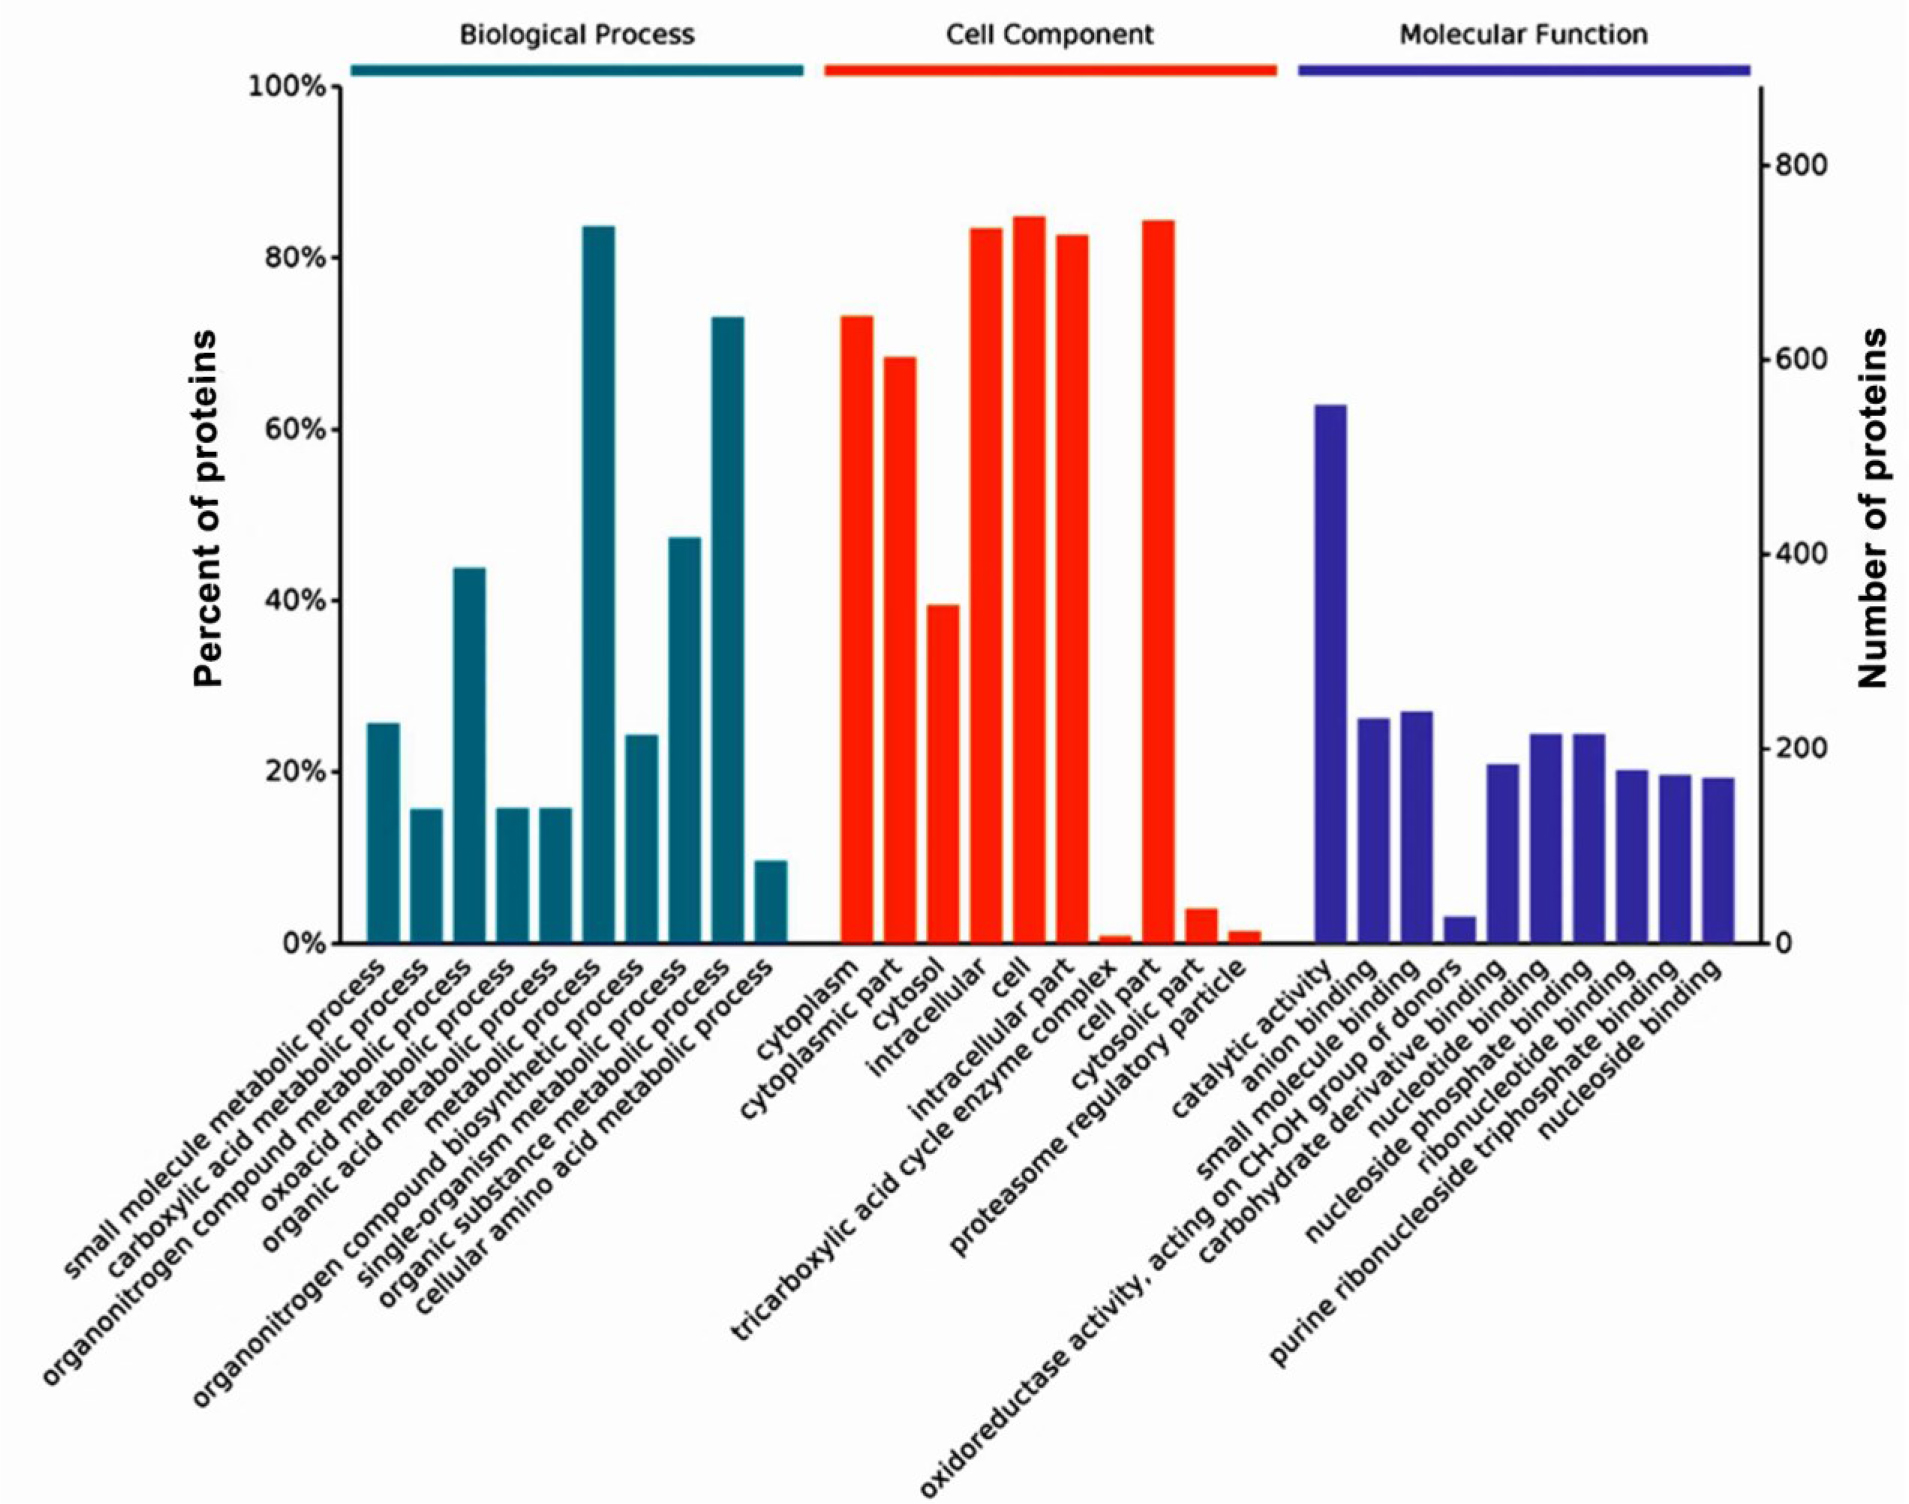
Fig. 3.
Gene Ontology enrichment analysis of differentially expressed proteins in Arthrobotrys oligospora before and after chitin interaction
Table 5.
Gene Ontology molecular function categories that were most significantly enriched in differentially expressed proteins in Arthrobotrys oligospora after chitin interaction
| Level | Gene Ontology name | Gene Ontology ID | P-value | Count |
|---|---|---|---|---|
| 2 | catalytic activity | GO:0003824 | 5.78E–17 | 554 |
| 4 | anion binding | GO:0043168 | 1.01E–10 | 232 |
| 3 | small molecule binding | GO:0036094 | 4.36E–09 | 239 |
| 4 | oxidoreductase activity, acting on CH-OH group of donors | GO:0016614 | 4.14E–08 | 28 |
| 3 | carbohydrate derivative binding | GO:0097367 | 8.13E–08 | 184 |
| 4 | nucleotide binding | GO:0000166 | 0.000000215 | 216 |
| 4 | nucleoside phosphate binding | GO:1901265 | 0.000000215 | 216 |
| 4 | ribonucleotide binding | GO:0032553 | 0.000000422 | 178 |
| 5 | purine ribonucleoside triphosphate binding | GO:0035639 | 0.00000052 | 173 |
| 4 | nucleoside binding | GO:0001882 | 0.000000604 | 170 |
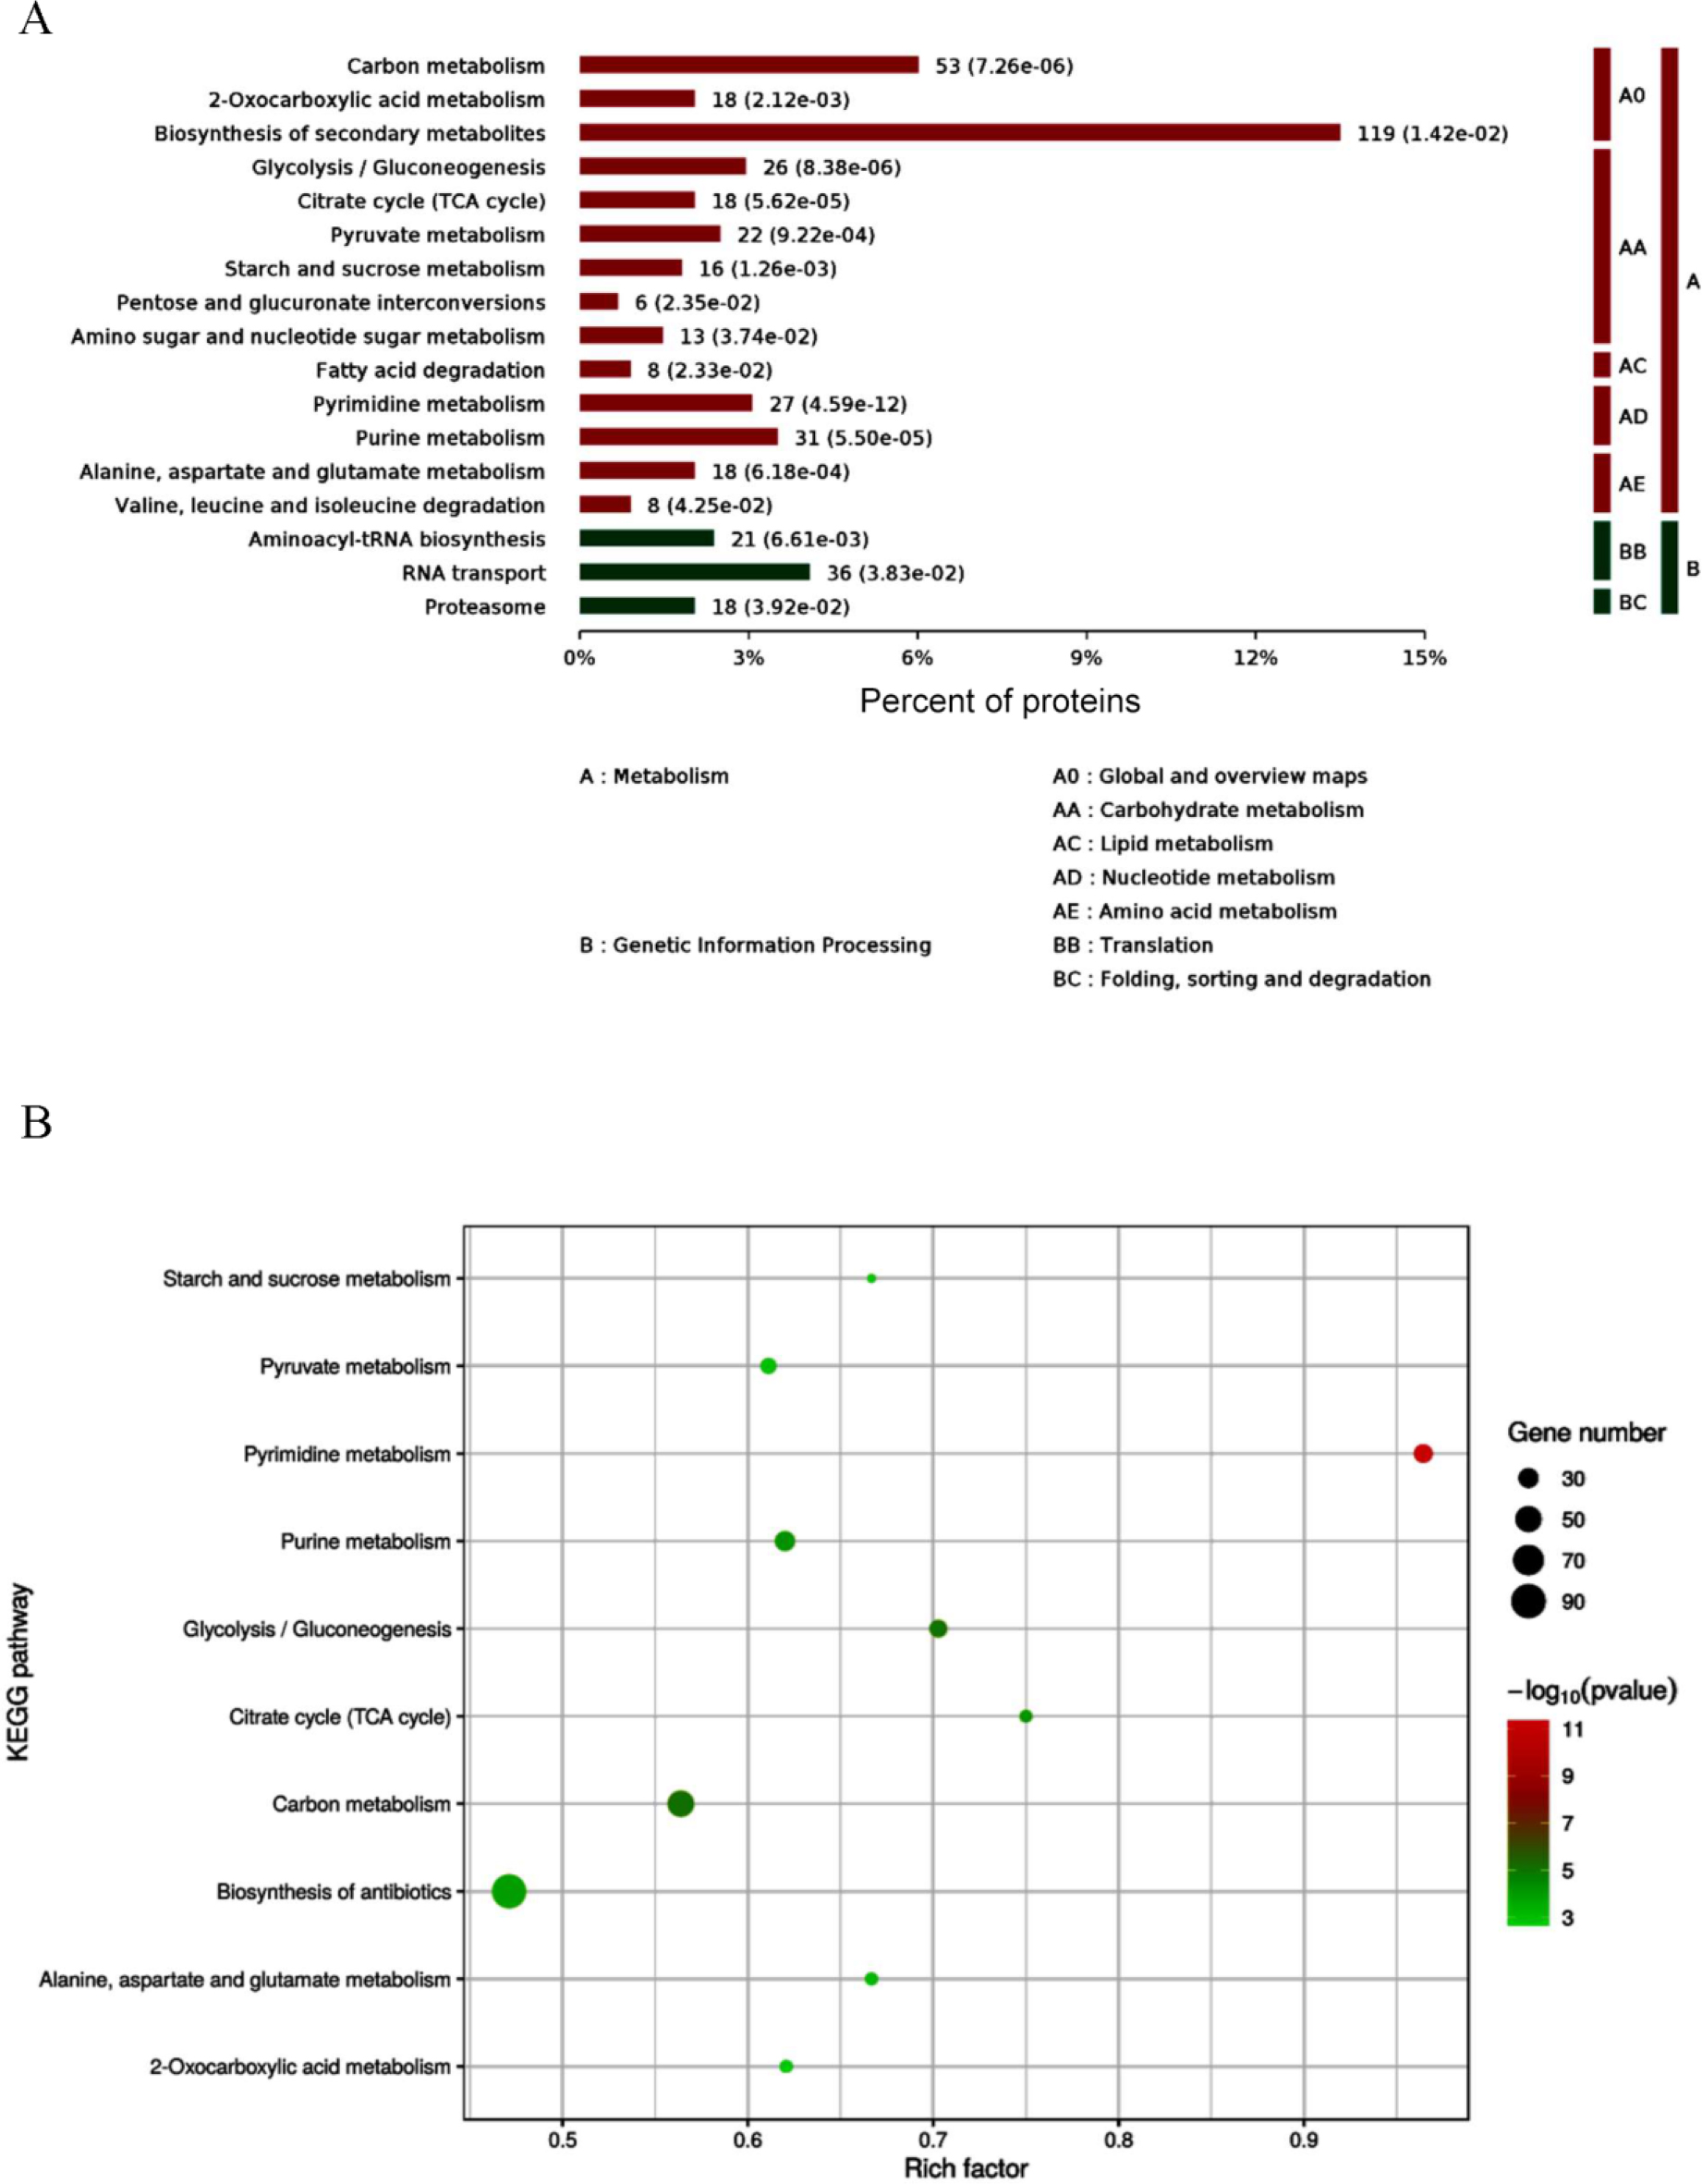
Fig. 4.
Kyoto Encyclopedia of Genes and Genomes (KEGG) pathway enrichment analysis of differentially expressed proteins (DEPS) in Arthrobotrys oligospora before and after chitin interaction. A – KEGG pathway enrichment category of DEPs; B – bubble map of DEPs involved in metabolic pathways in KEGG analysis
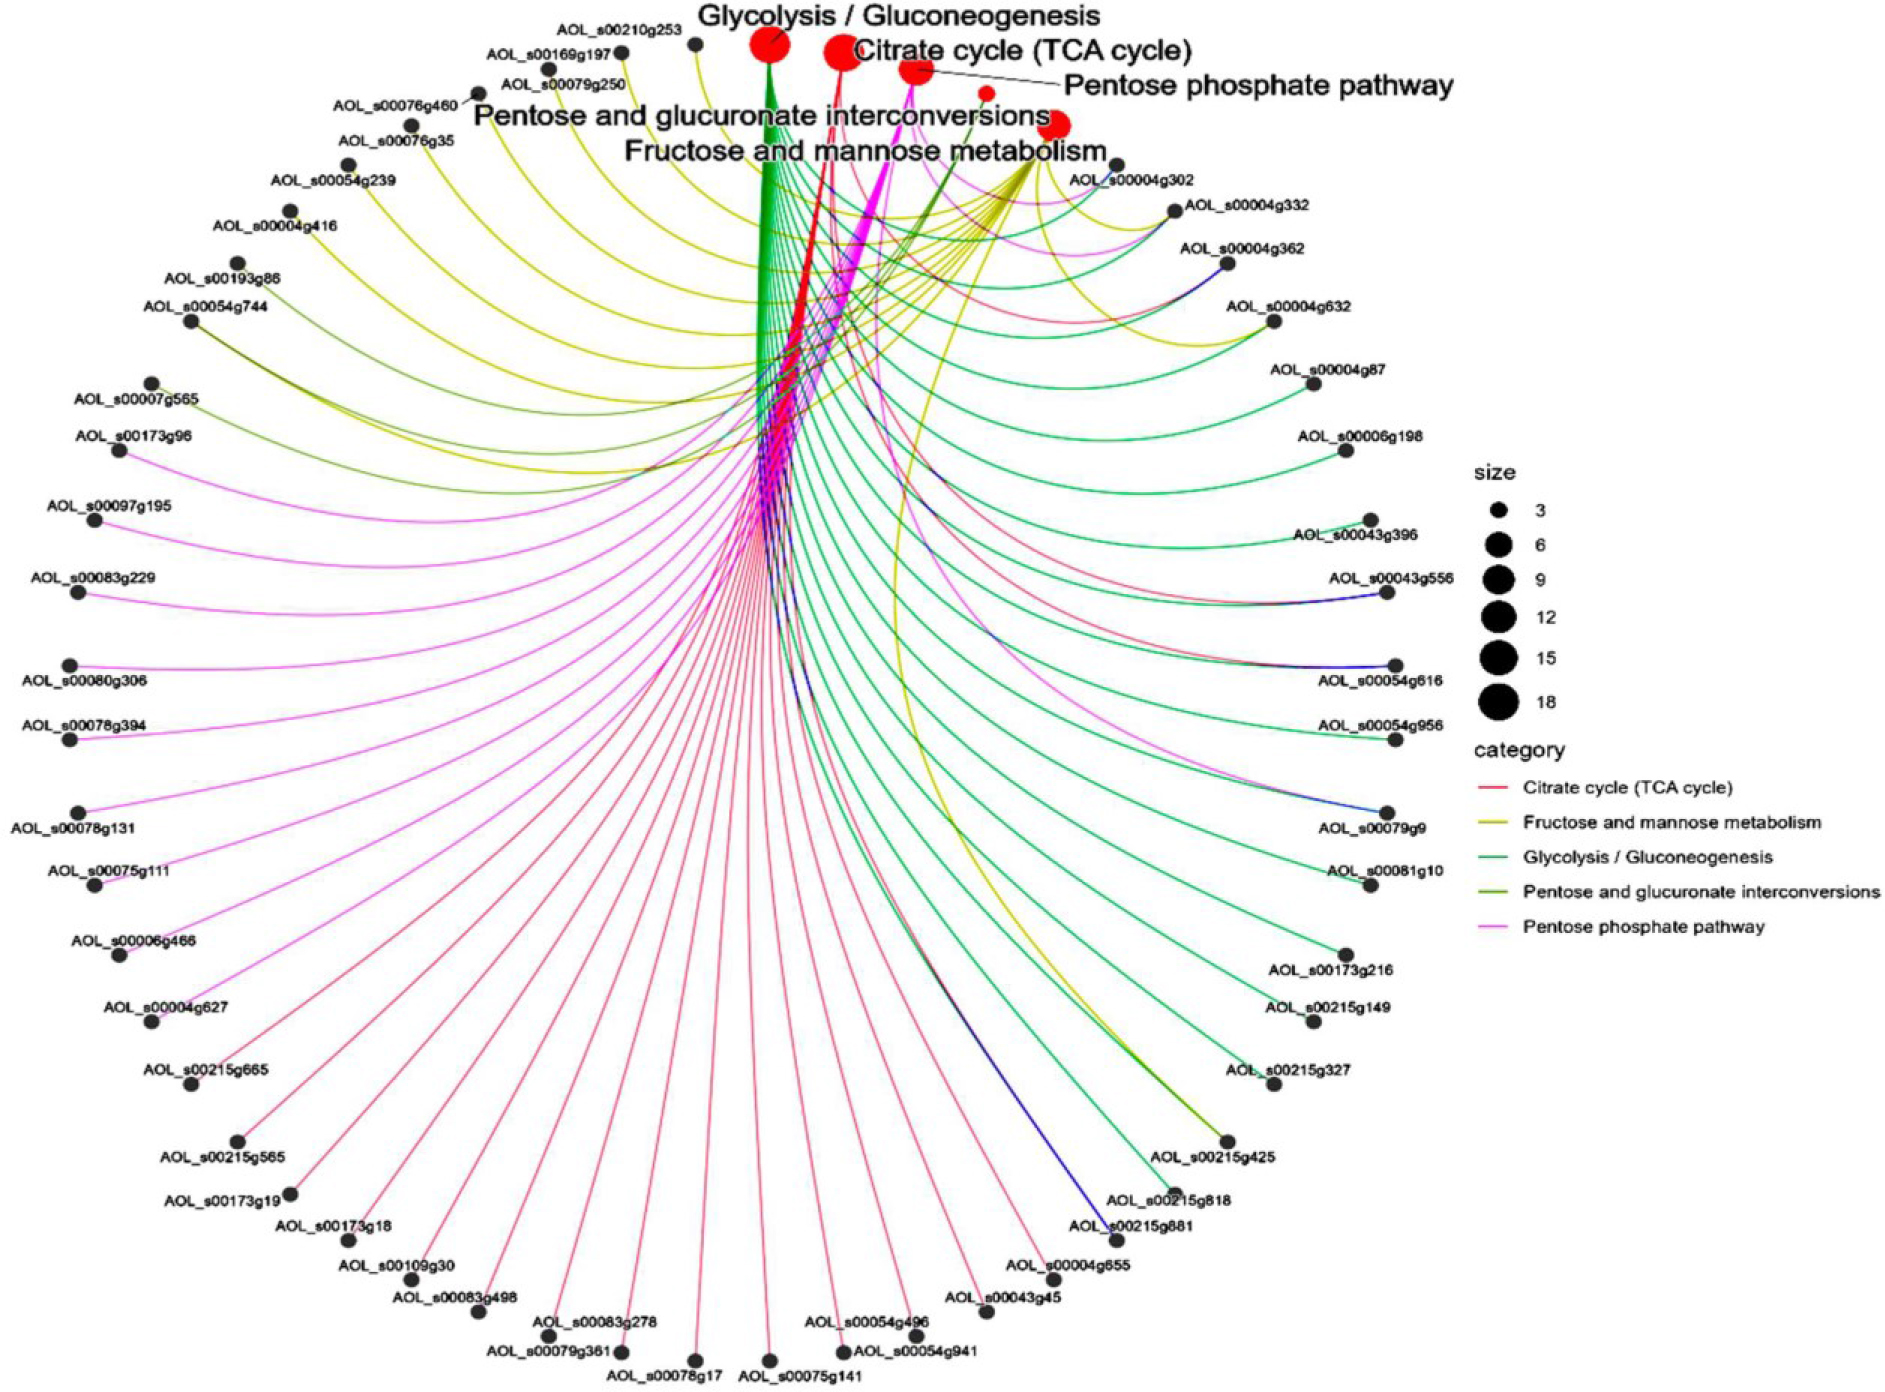
Fig. 5.
Network diagram analysis of differentially expressed proteins involved in metabolic pathways in Arthrobotrys oligospora before and after chitin interaction
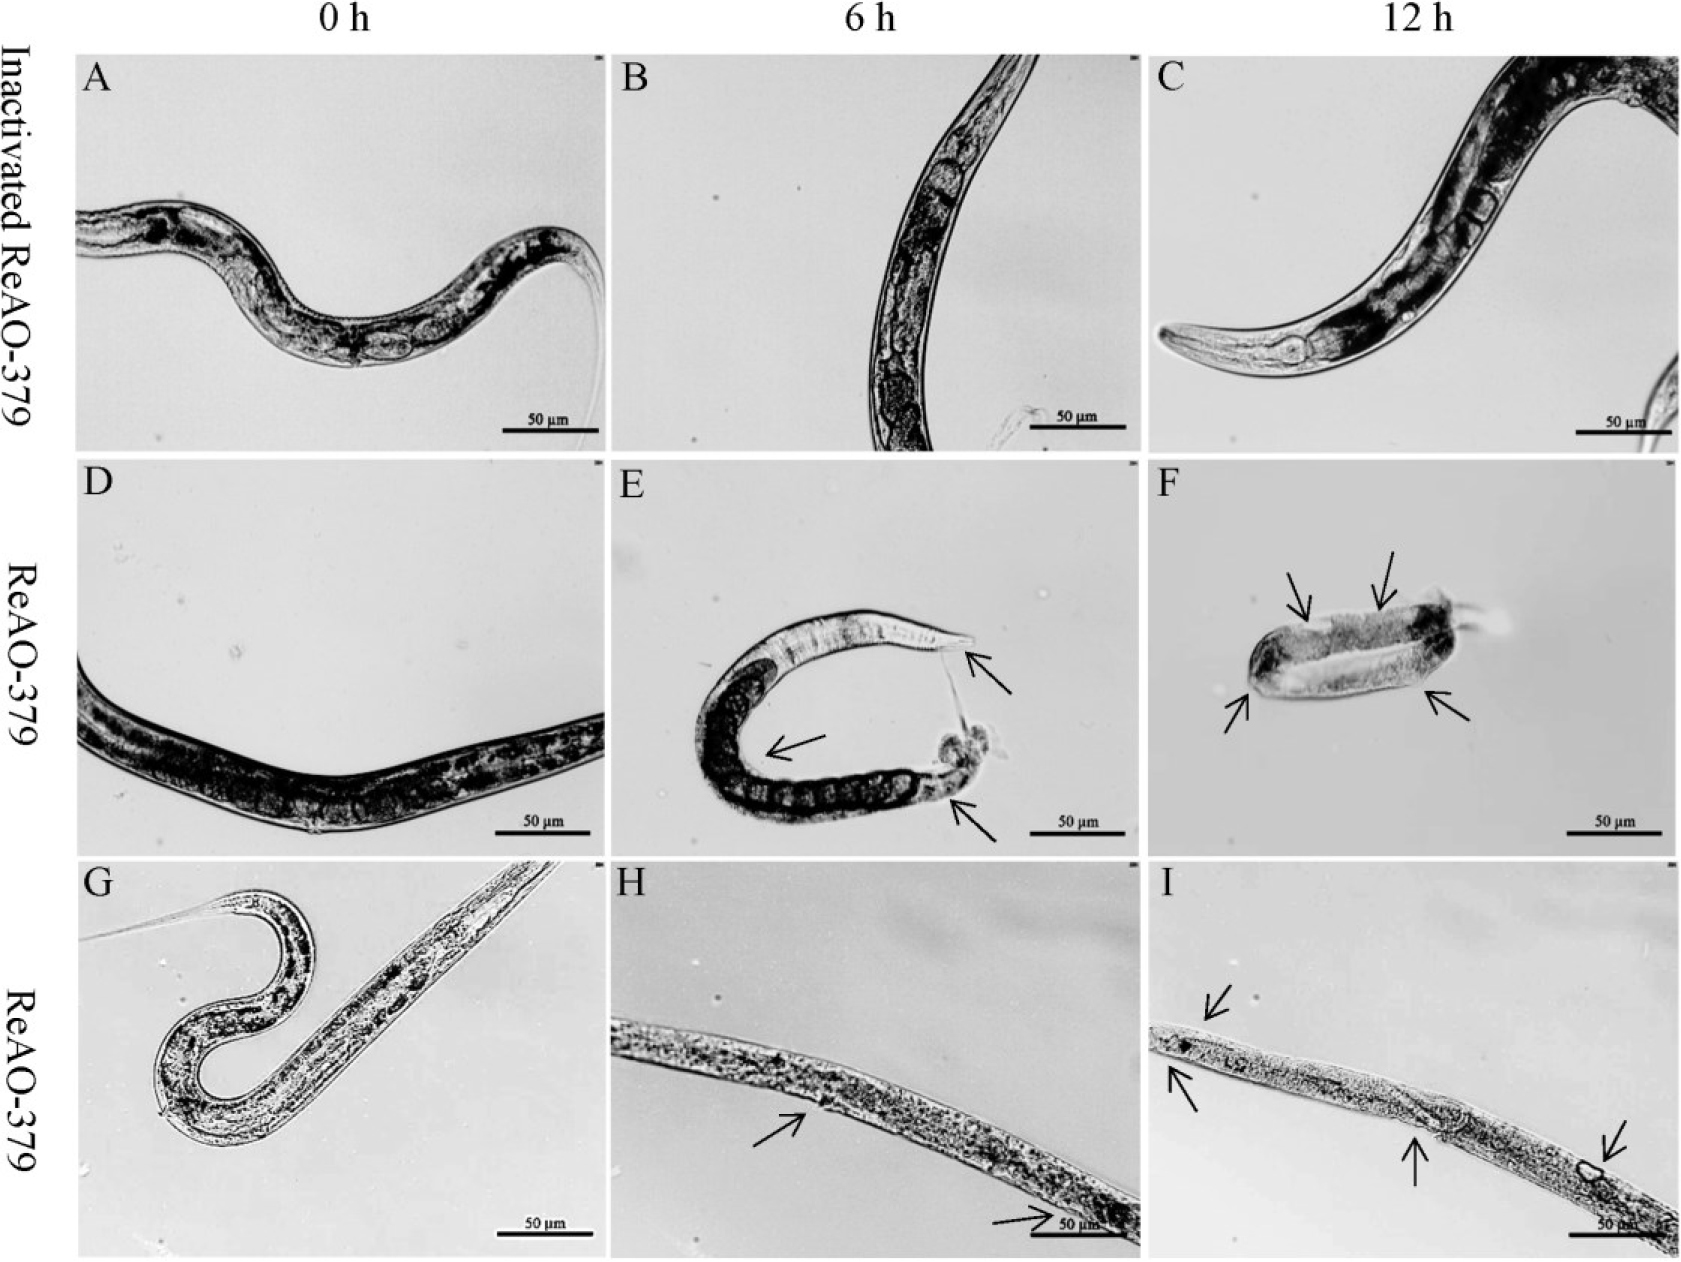
Fig. 6.
Determination of the degradation activity of differentially expressed chitinase AO-379 in Caenorhabditis elegans. A–C – C. elegans treated with inactivated ReAO-379 for 0, 6 and 12 h, respectively; D–F – adult C. elegans treated with ReAO-379 for 0, 6 and 12 h, respectively; G–I – stage-IV larvae of C. elegans treated with ReAO-379 for 0, 6 and 12 h, respectively. Arrow – degraded part of the nematode body wall; scale bar – 50 μm
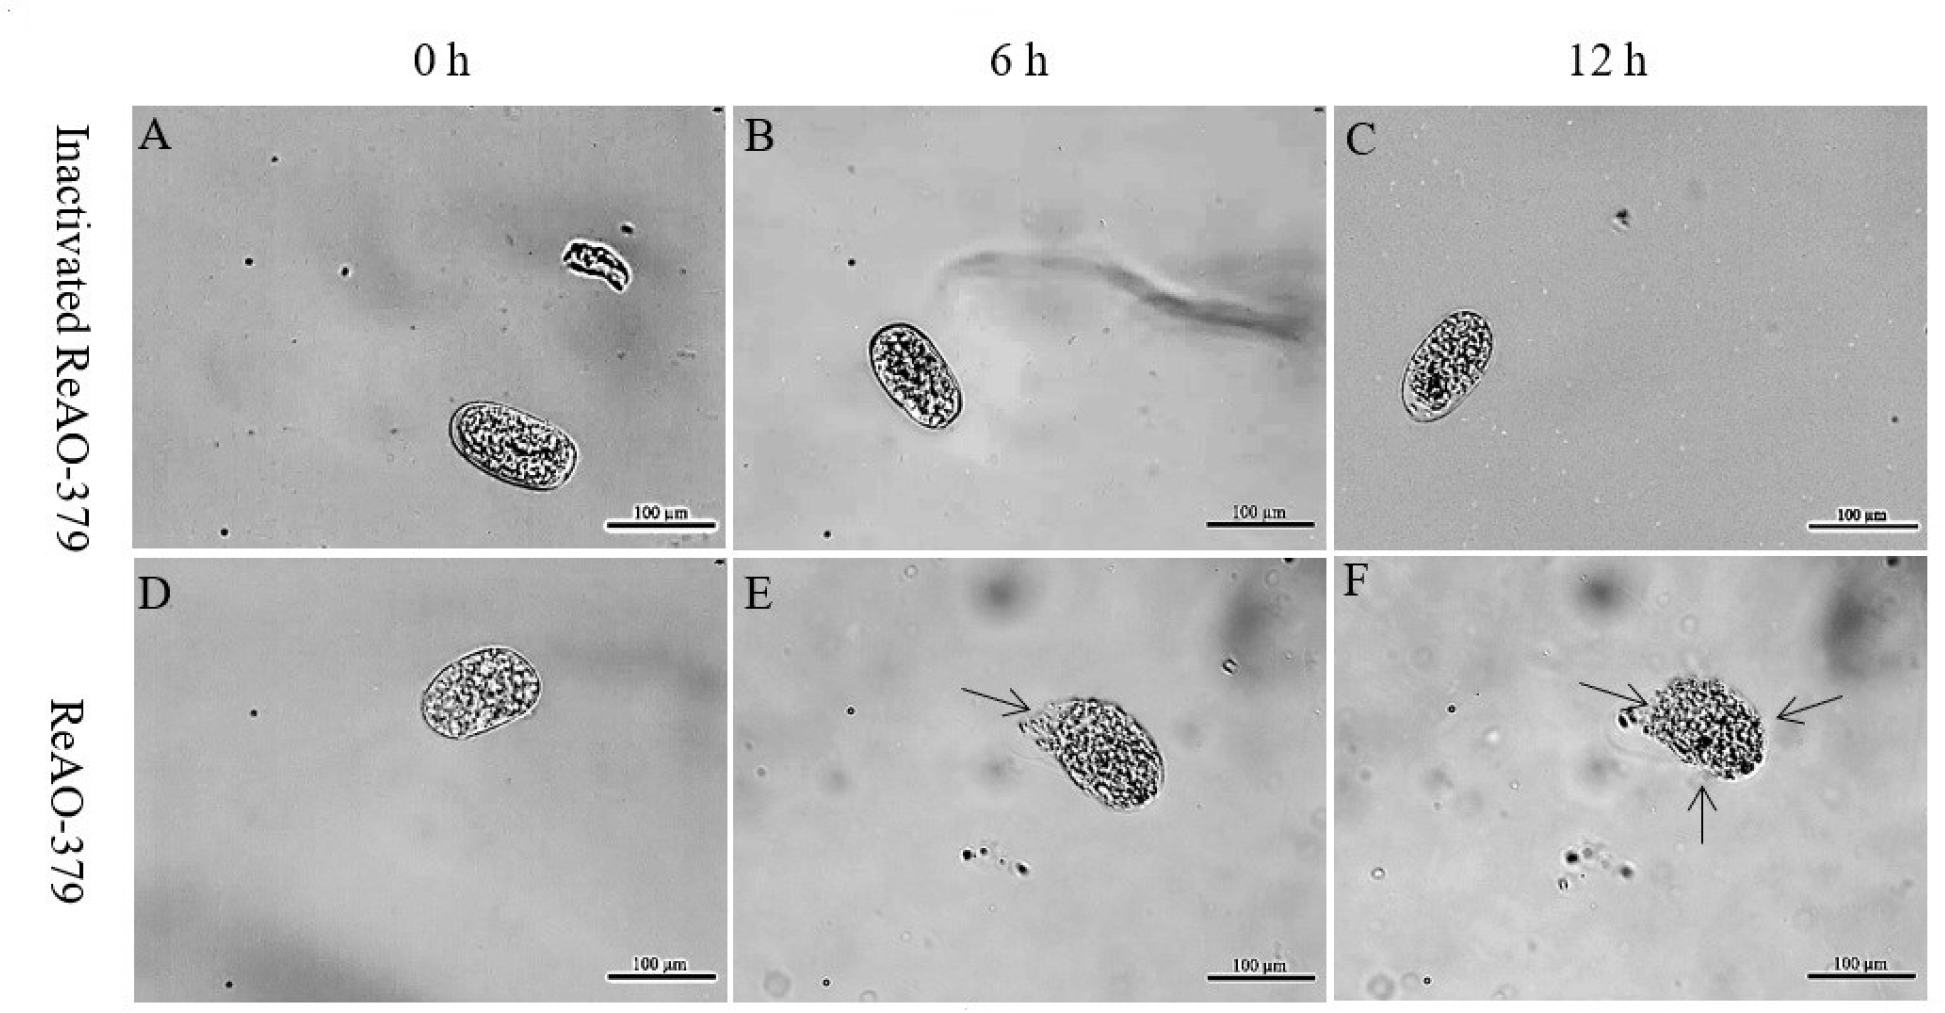
Fig. 7.
Analysis of the degradation activity of differentially expressed chitinase AO-379 in Caenorhabditis elegans eggs. A–C – C. elegans eggs treated with inactivated recombinant ReAO-379 for 0, 6 and 12 h, respectively; D–F – C. elegans eggs treated with ReAO-379 for 0, 6 and 12 h, respectively. Arrow – degraded part of egg shell; scale bar – 100 μm