
Fig. 1.
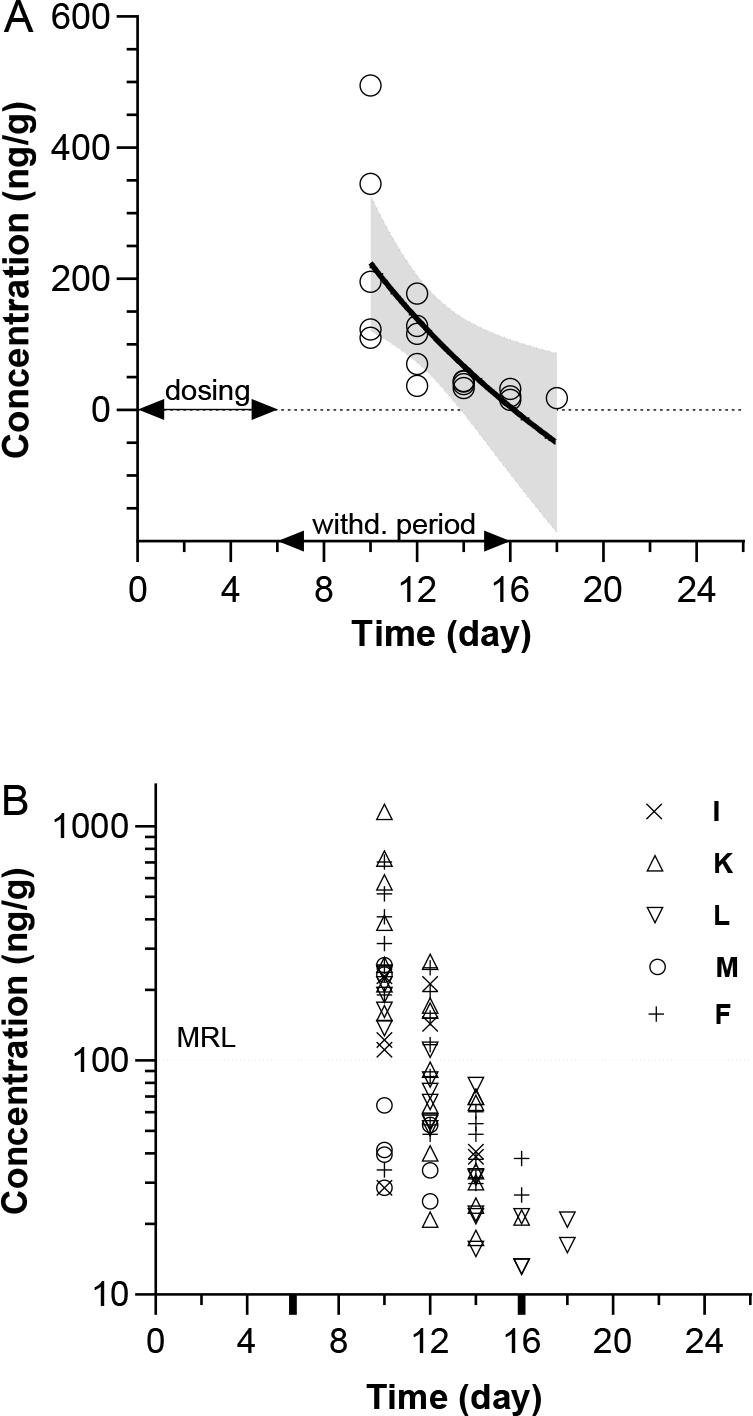
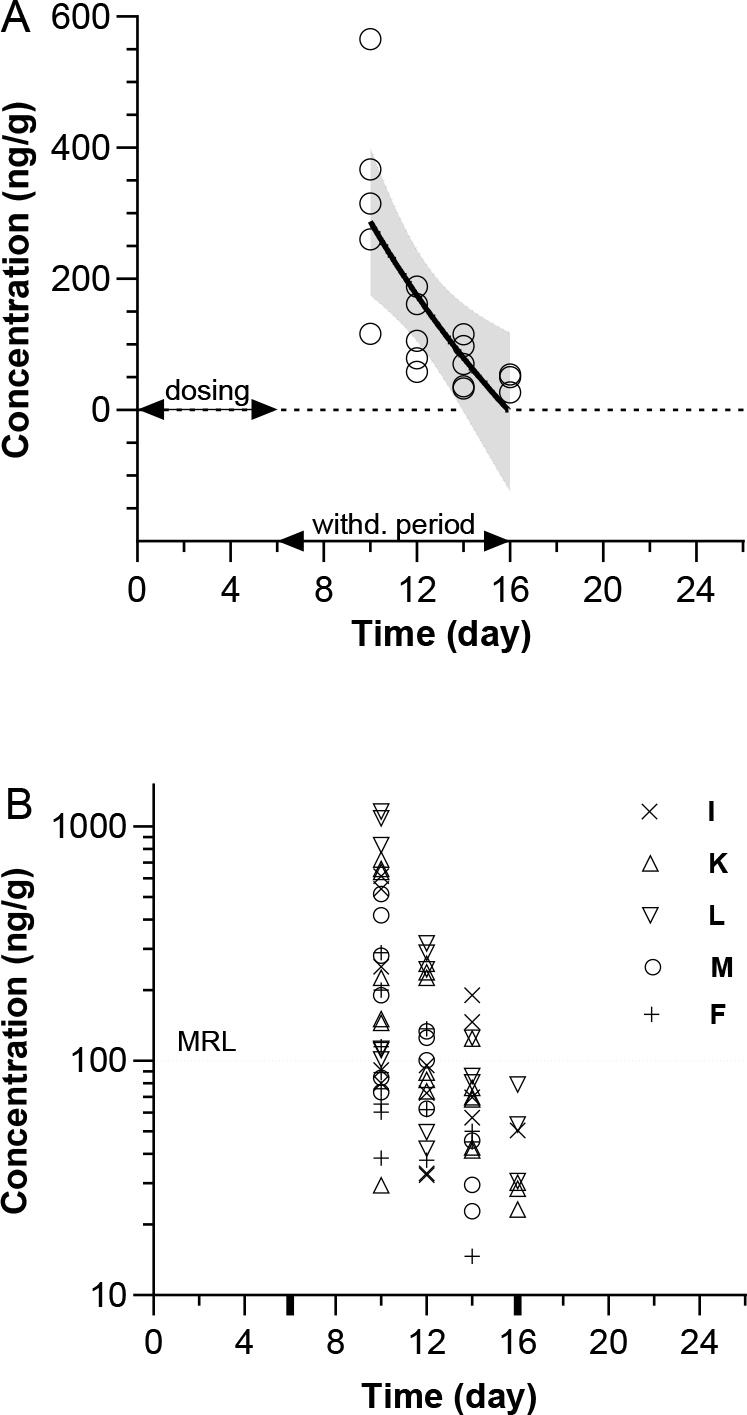
Fig. 2.
Performance data for the method detecting antibiotic residues in porcine tissues
| Analyte | Tissue | LOD ng/g | LOQ ng/g | CCα ng/g | CCβ ng/g | Recovery % | Intra-day precision % | Inter-day precision % |
|---|---|---|---|---|---|---|---|---|
| Sulphadimethoxine | Muscle | 1.02 | 3.08 | 124.57 | 125.70 | 74.56 | 3.49 | 4.12 |
| Liver | 1.17 | 3.54 | 128.60 | 129.50 | 96.23 | 3.21 | 4.56 | |
| Kidney | 1.25 | 3.78 | 103.78 | 105.70 | 74.78 | 3.52 | 5.18 | |
| Fat and skin | 0.90 | 2.73 | 119.96 | 120.44 | 77.34 | 3.02 | 5.96 | |
| Sulphathiazole | Muscle | 1.17 | 3.55 | 101.01 | 106.27 | 84.41 | 4.38 | 3.85 |
| Liver | 1.20 | 3.65 | 107.84 | 109.60 | 81.49 | 1.58 | 4.55 | |
| Kidney | 1.28 | 3.90 | 110.03 | 113.72 | 86.67 | 9.57 | 7.12 | |
| Fat and skin | 1.06 | 3.20 | 100.28 | 102.82 | 64.76 | 4.36 | 5.47 | |
| Sulphamethazine | Muscle | 1.34 | 4.06 | 101.00 | 103.00 | 90.69 | 5.23 | 6.11 |
| Liver | 2.72 | 8.25 | 85.45 | 87.91 | 95.75 | 2.06 | 4.23 | |
| Kidney | 1.47 | 4.47 | 87.53 | 89,17 | 90.13 | 2.61 | 3.88 | |
| Fat and skin | 1.08 | 3.28 | 88.52 | 100.45 | 92.68 | 0.95 | 2.45 | |
| Sulphacetamide | Muscle | 1.54 | 4.67 | 65.23 | 68.11 | 48.02 | 4.05 | 4.41 |
| Liver | 0.98 | 2.98 | 54.89 | 55.31 | 45.48 | 4.18 | 4.12 | |
| Kidney | 1.31 | 3.97 | 79.96 | 82.12 | 59.99 | 3.88 | 4.88 | |
| Fat and skin | 2.89 | 8.76 | 50.87 | 52.22 | 44.96 | 1.49 | 3.33 |
Linear regression fit parameters of all observed concentrations per active substance and tissue
| Tissue | Y-Intercept (CI) | Slope (CI) | R2 | RMSE | W | P-value | Nt |
|---|---|---|---|---|---|---|---|
| Formulation A | |||||||
| M1 | na | na | na | na | na | na | na |
| M2 | na | 5.461 (−4.075e+017– 4.075e+017) | 0 | 114.6 | 0.79 | 0.0912 | No |
| M3 | 534.4 (−268.5–1337) | −41.42 (−114.1–31.26) | 0.2695 | 74.7 | 0.897 | 0.3561 | Yes |
| K1 | 396.7 (−105.7–899.2) | −26.01 (−65.86–13.83) | 0.6451 | 36.95 | 0.952 | 0.7292 | Yes |
| K2 | 923.3 (511.3–1,335) | −66.94 (−101.7–−32.18) | 0.7001 | 73.13 | 0.964 | 0.8453 | Yes |
| K3 | 2,195 (1,351–3,039) | −150.9 (−218.2–−83.71) | 0.6854 | 211.2 | 0.872 | 0.1067 | Yes |
| L1 | na | na | na | na | na | na | na |
| L2 | 409.1 (249.9–568.3) | −25.05 (−37.25–−12.86) | 0.646 | 50.07 | 0.891 | 0.1755 | Yes |
| L3 | 394.1 (276.8–511.3) | −23.76 (−32.51–−15.02) | 0.708 | 40.02 | 0.965 | 0.854 | Yes |
| F1 | na | na | na | na | na | na | na |
| F2 | 659.5 (445.4–873.6) | −43.75 (−60.80–−26.69) | 0.7399 | 53.58 | 0.976 | 0.9425 | Yes |
| F3 | 1,442 (987.5–1897) | −97.05 (−133.3–−60.83) | 0.7563 | 113.8 | 0.898 | 0.2076 | Yes |
| I1 | na | na | na | na | na | na | na |
| I2 | 138.6 (−572.5–849.6) | −4.772 (−65.97–56.42) | 0.02527 | 56.75 | 0.95 | 0.7127 | Yes |
| I3 | 468.9 (−429.0–1,367) | −27.92 (−105.2–49.35) | 0.3576 | 71.67 | 0.95 | 0.7139 | Yes |
| Formulation B | |||||||
| M1 | 1,320 (899.8–1,740) | −92.89 (−127.5–−58.30) | na | na | na | na | na |
| M2 | 417.8 (299.6–535.9) | −26.03 (−35.45–−16.62) | 0.8541 | 76.77 | 0.929 | 0.5405 | Yes |
| M4 | na | na | 0.2053 | 52.74 | 0.879 | 0.336 | Yes |
| K1 | 1,676 (1,316–2,037) | −109.8 (−137.7–−81.91) | na | na | na | na | na |
| K2 | 421 (353.5–488.5) | −31.26 (−37.48–−25.03) | 0.8525 | 102.3 | 0.902 | 0.1961 | Yes |
| K4 | na | na | 0.7678 | 29.57 | 0.837 | 0.0411 | No |
| L1 | 2,374 (1,718–3,031) | −154.6 (−204.4–−104.8) | na | na | na | na | na |
| L2 | na | 4.859 (−9.685e+016– 9.685e+016) | 0.7603 | 202.8 | 0.937 | 0.4546 | Yes |
| L4 | na | na | 0.979 | 5.018 | 0.829 | 0.1371 | Yes |
| F1 | 544.1 (220.6–867.6) | −37.01 (−63.72–−10.30) | na | na | na | na | na |
| F2 | 157 (−15.13–329.1) | −7.13 (−22.11–7.852) | 0.4961 | 64.61 | 0.967 | 0.8657 | Yes |
| F4 | na | na | na | 27.25 | 0.999 | 0.9427 | Yes |
| I1 | 1,037 (401.6–1673) | −67.52 (−118.1–−16.89) | na | na | na | na | na |
| I2 | 1,037 | −67.52 | 0.4346 | 159.1 | 0.929 | 0.4364 | Yes |
| I4 | na | na | 0.9003 | 5.48 | 1 | >0.9999 | Yes |