Fig. 1.
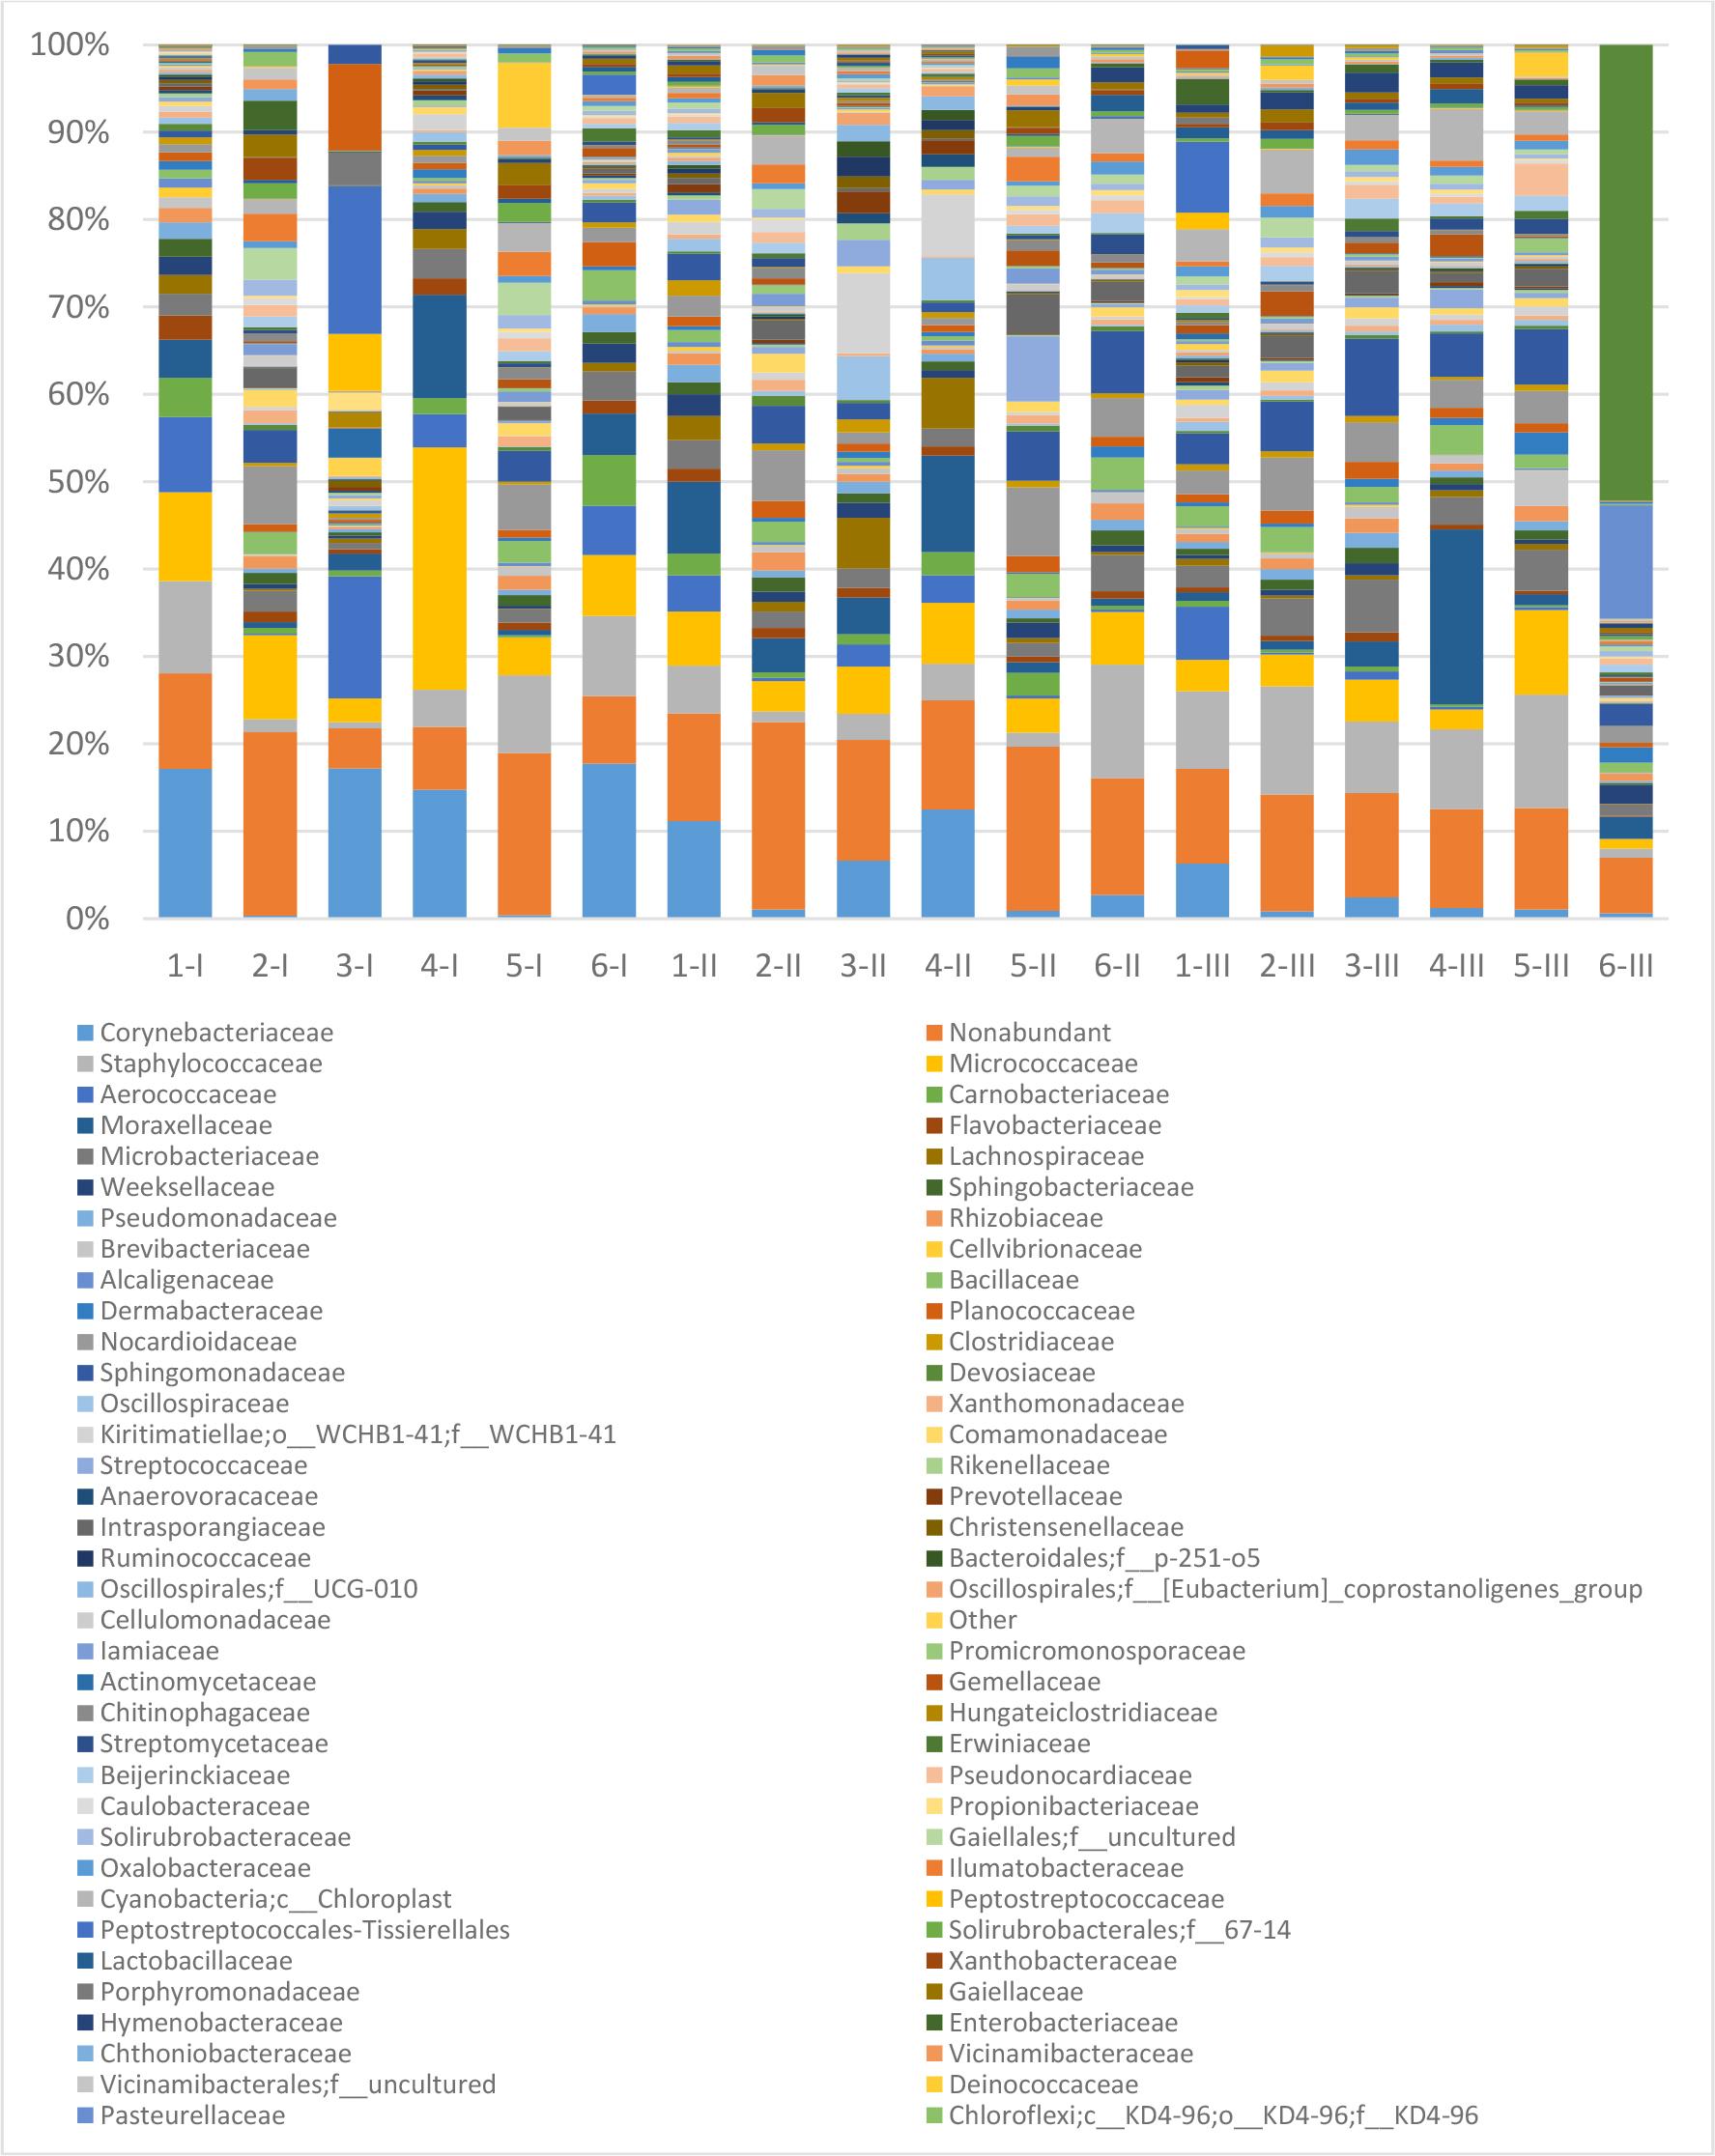
Fig. 2.
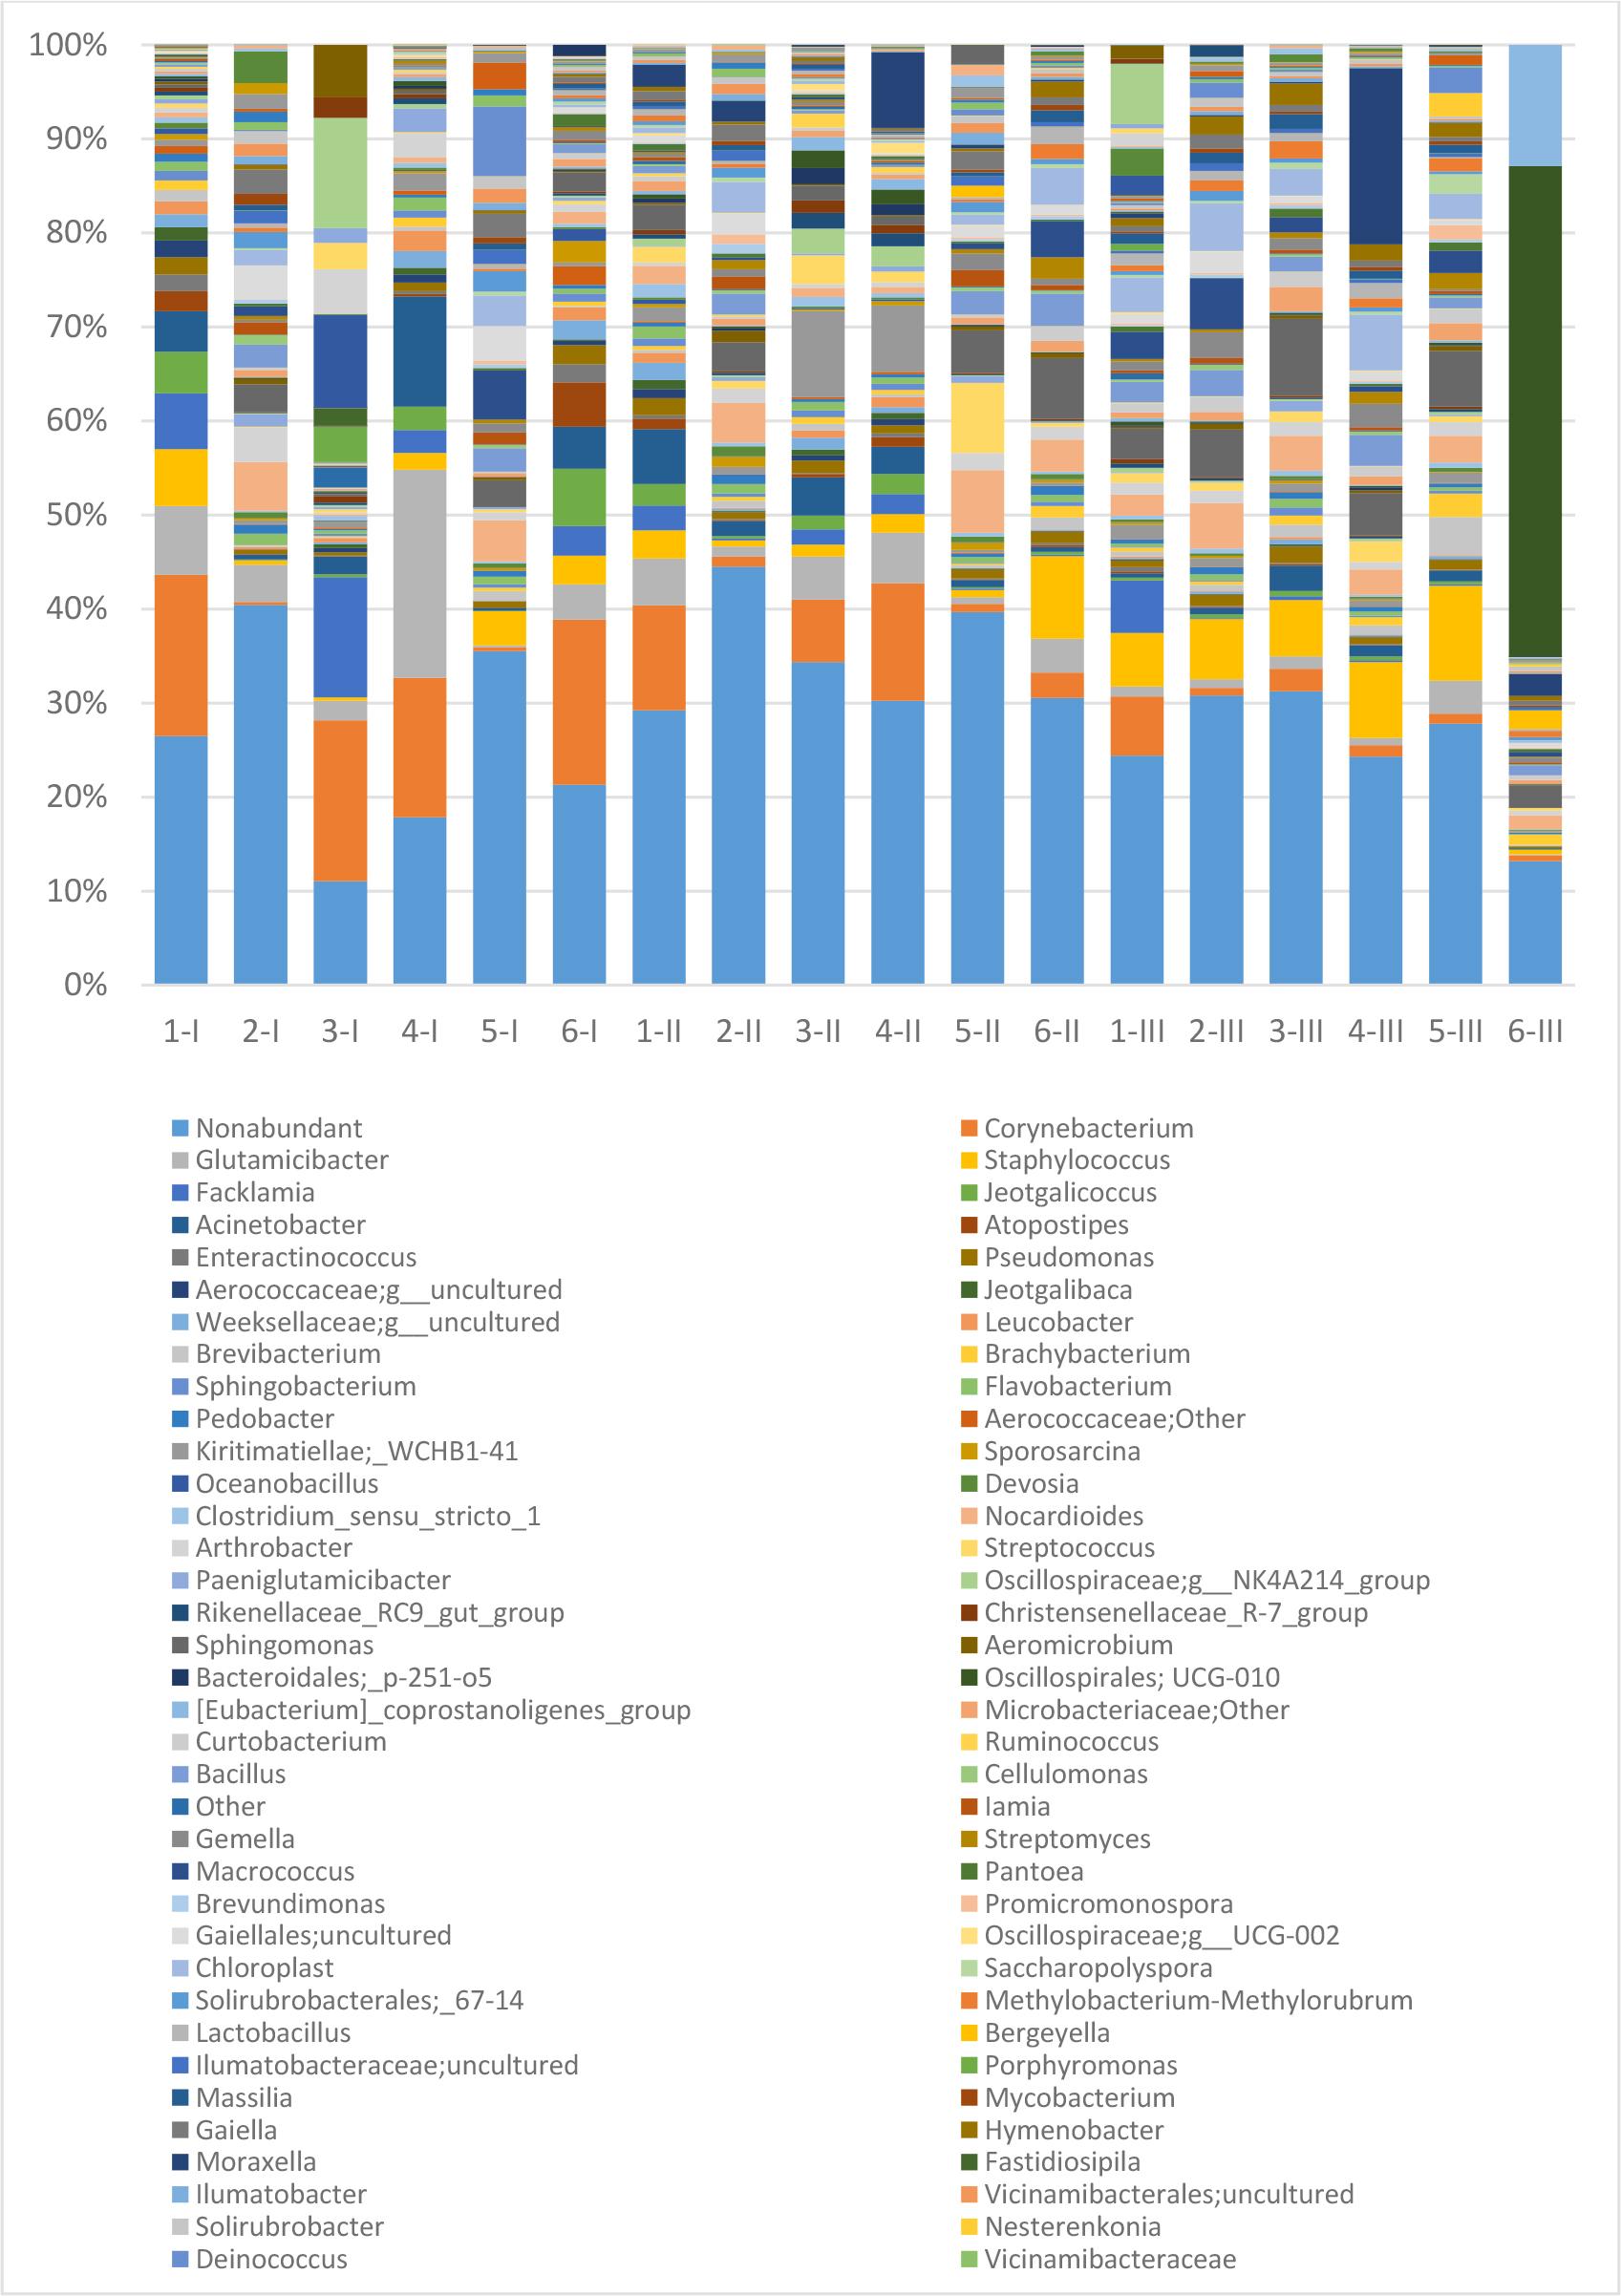
Fig. 3.
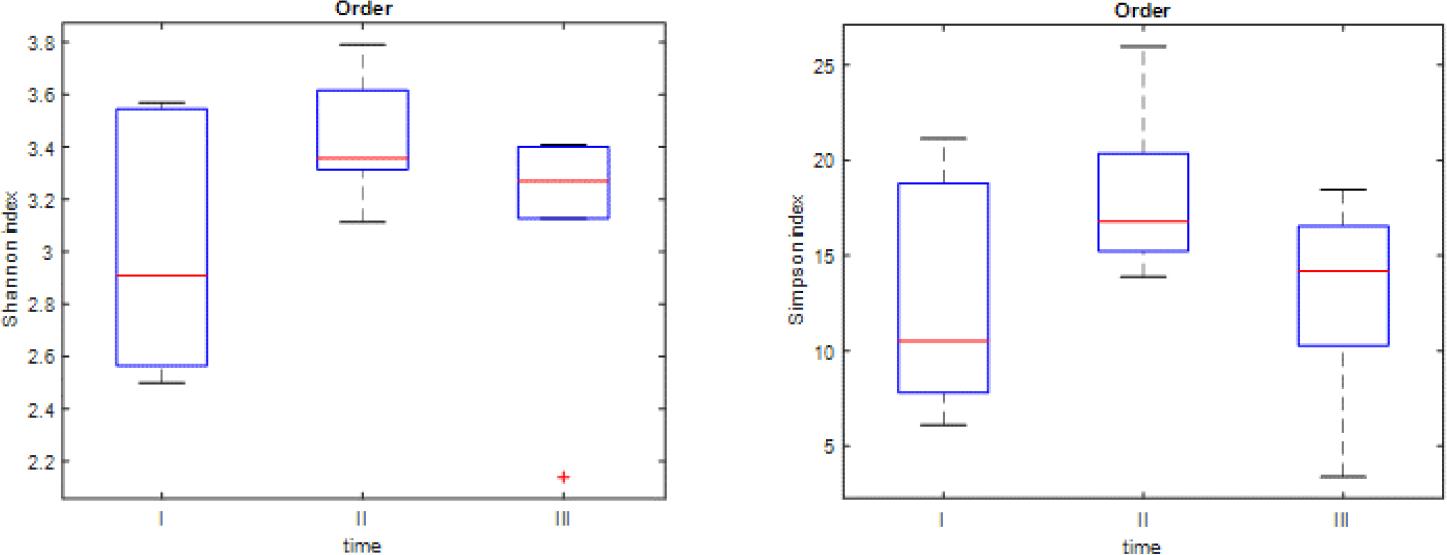
Fig. 4.
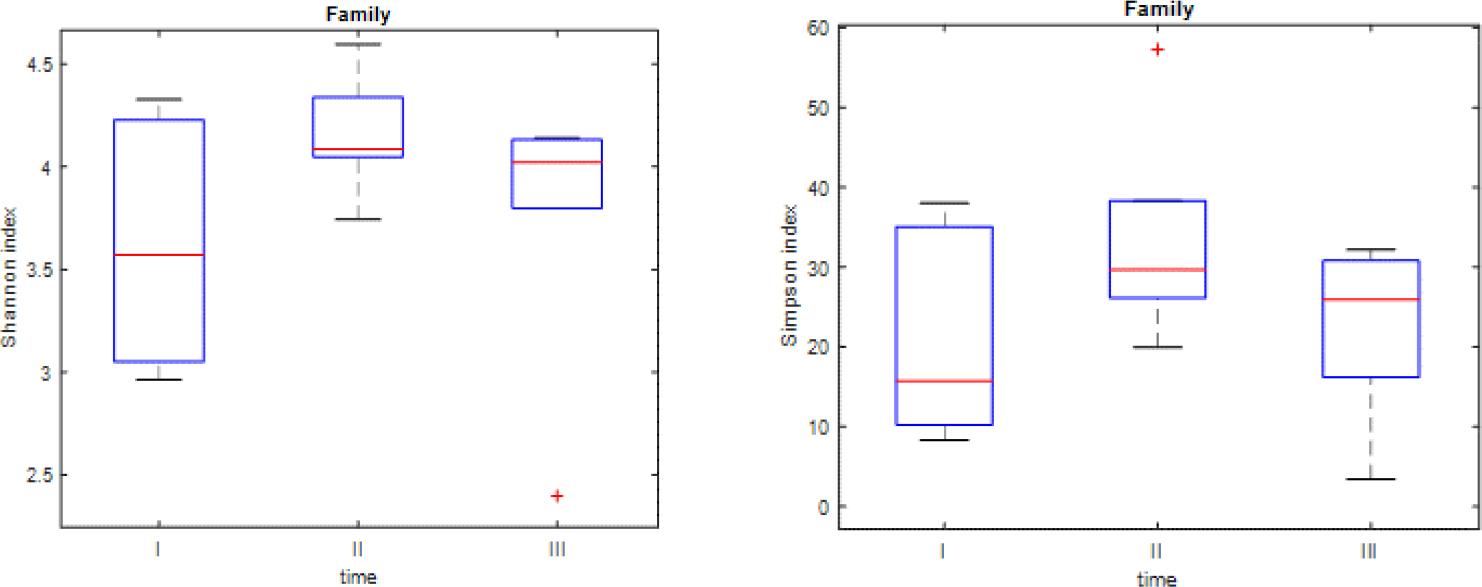
Fig. 5.
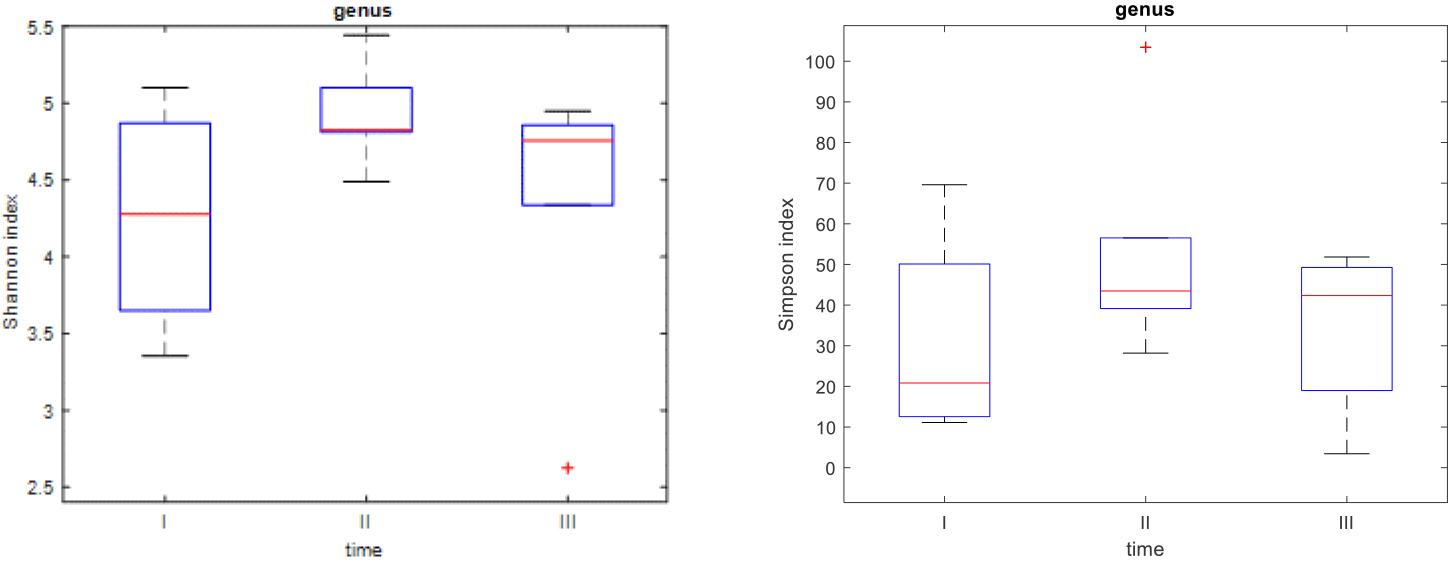
Fig. 6.

P-values of the t-tests applied to compare Shannon and Simpson indices at different time points at the family taxonomic level
| I vs. II | I vs. III | II vs. III | |
|---|---|---|---|
| Shannon index | 0.0074* | 0.3632 | 0.0998 |
| Simpson index | 0.0024* | 0.3866 | 0.0459* |
P-values of the t-tests applied to compare Shannon and Simpson indices at different time points at the order taxonomic level
| I vs. II | I vs. III | II vs. III | |
|---|---|---|---|
| Shannon index | 0.0048* | 0.3616 | 0.0863 |
| Simpson index | 0.0058* | 0.4607 | 0.0369* |
P-values of the t-tests applied to compare Shannon and Simpson indices at different time points at the genus taxonomic level
| I vs. II | I vs. III | II vs. III | |
|---|---|---|---|
| Shannon index | 0.0073* | 0.3968 | 0.0907 |
| Simpson index | 0.0016* | 0.3557 | 0.0703 |