
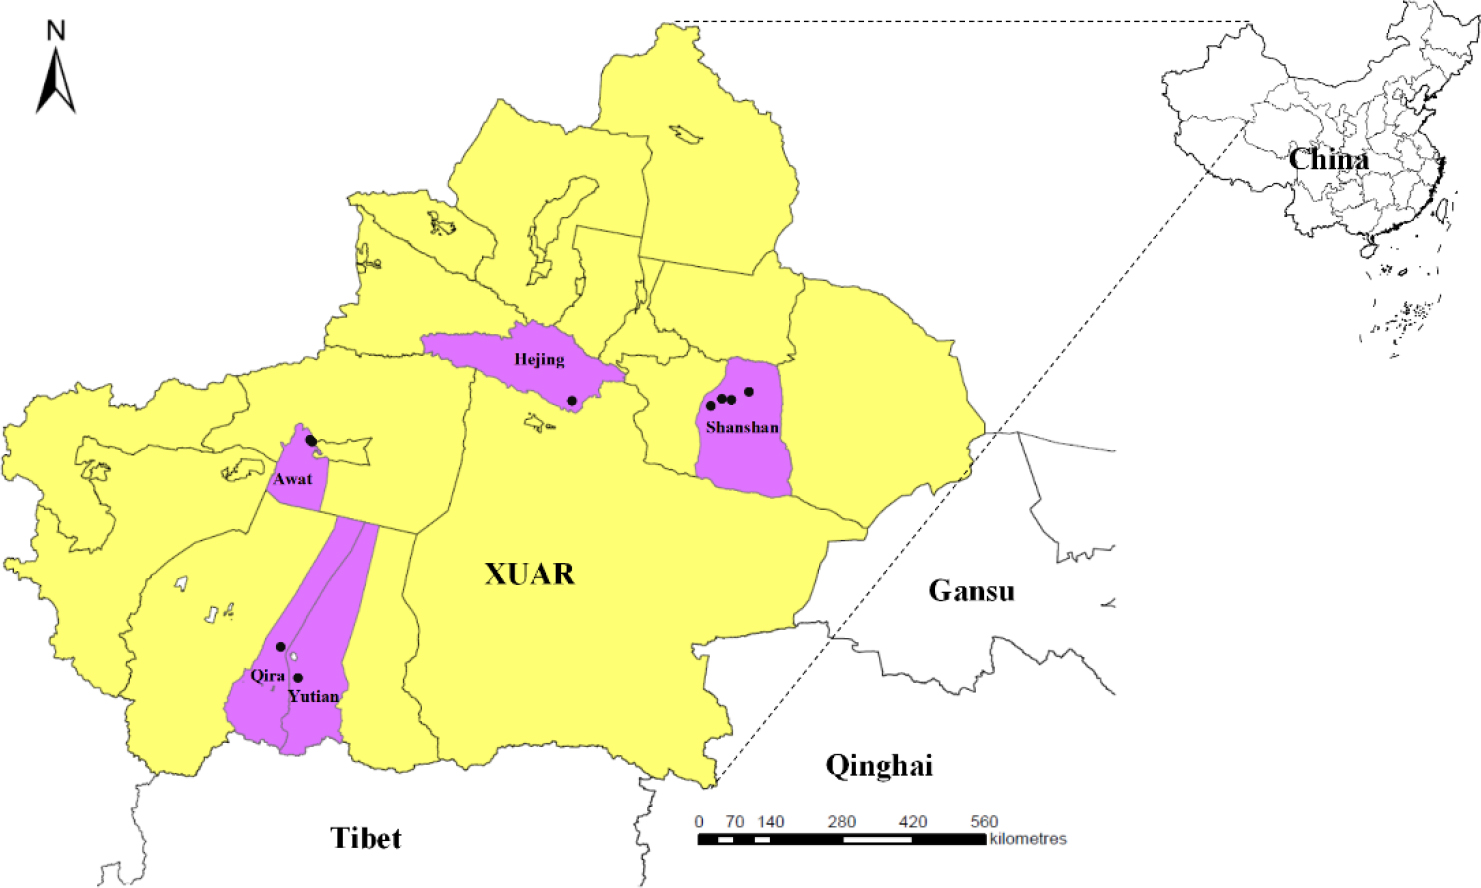
Fig. 1.
Map of the Xinjiang Uygur Autonomous Region (XUAR), China. The black dots indicate localities where samples were collected
Table 1.
Collection of Ornithodoros lahorensis soft tick samples in the Xinjiang Uygur Autonomous Region, China
| Collection date | Collection season | Region | Number of samples collected | Altitude (m), latitude and longitude |
|---|---|---|---|---|
| Oct. 2020 and Mar. 2021 | Autumn and spring | Shanshan | 209 | 979; 42°82′ N, 90°25′ E |
| Mar.–Apr. 2021 | Spring | Awat | 93 | 1028; 40°76′ N, 80°25′ E |
| Oct. 2019 | Autumn | Hejing | 24 | 1100; 42°32′ N, 86°38′ E |
| Mar. 2022 | Spring | Yutian | 20 | 1628; 36°41′ N, 81°29′ E |
| Mar. 2022 | Spring | Qira | 20 | 1361; 37°3′ N, 80°46′ E |
Table 2.
PCR amplification of genetic material of pathogens isolated from Ornithodoros lahorensis soft ticks in the Xinjiang Uygur Autonomous Region, China
| Pathogen | Target gene/region | Primer (5′–3′) | EPS (base pairs) | AT (°C) | Reference |
|---|---|---|---|---|---|
| Anaplasma ovis | Msp4 | Forward: CGCCTGCTCCCTACTTGTT | 322 | 58 | (13) |
| Reverse: TTCCACTCTGGCTCCTCCT | |||||
| Theileria ovis | 18S rRNA | Forward: TCGAGACCTTCGGGT | 520 | 52 | (1) |
| Reverse: TCCGGACATTGTAAAACAAA | |||||
| Brucella abortus | Omp2 | Forward: TGATGGGAGGGACCGACTA | 494 | 55 | (24) |
| Reverse: TGGTTCTTCAGGTTGTTACGC |
Table 3.
Prevalence of pathogens detected in Ornithodoros lahorensis soft ticks in the Xinjiang Uygur Autonomous Region, China
| Prevalence (%) | ||||||
|---|---|---|---|---|---|---|
| Pathogen | Shanshan (n = 209) | Awat (n = 93) | Hejing (n = 24) | Yutian (n = 20) | Qira (n = 20) | Overall (n = 366) |
| Anaplasma ovis | 28.2 (59/209) | 23.6 (22/93) | 0 (0/24) | 40.0 (8/20) | 10.0 (2/20) | 24.9 (91/366) |
| Theileria ovis | 45.0 (94/209) | 35.5 (33/93) | 0 (0/24) | 0 (0/20) | 0 (0/20) | 34.7 (127/366) |
| Brucella abortus | 24.4 (51/209) | 39.8 (37/93) | 25.0 (6/24) | 0 (0/20) | 0 (0/20) | 25.6 (94/366) |
Table 4.
Prevalence of single and co-infection with one or more of Anaplasma ovis, Theileria ovis and Brucella abortus in Ornithodoros lahorensis soft ticks in the Xinjiang Uygur Autonomous Region, China
| Pathogen | Number of positive samples/percentage (%) | |
|---|---|---|
| Single infection | Anaplasma ovis | 54/366 (14.8) |
| Theileria ovis | 83/366 (22.7) | |
| Brucella abortus | 63/366 (17.2) | |
| Co-infection | A. ovis + T. ovis | 25/366 (6.8) |
| T. ovis + B. abortus | 19/366 (5.2) | |
| A. ovis + B. abortus | 12/366 (3.3) | |
| A. ovis + T. ovis + B. abortus | 0/366 (0) |
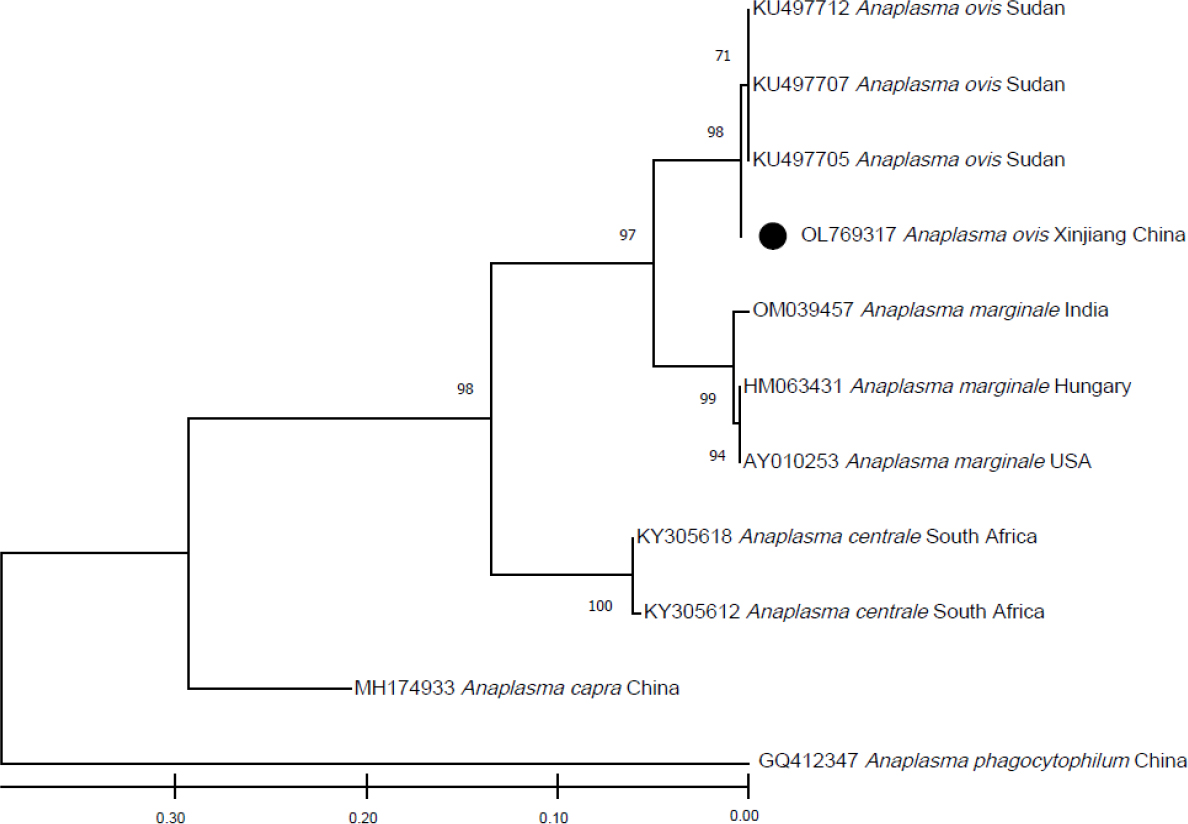
Fig. 2.
The phylogenetic analysis of Anaplasma ovis identified in this study based on the Msp4 gene sequences. The tree was constructed using the maximum likelihood method. The numbers at nodes represent the percentage occurrence of the clade in 1,000 bootstrap replications. The sequence from this study is indicated by a black dot
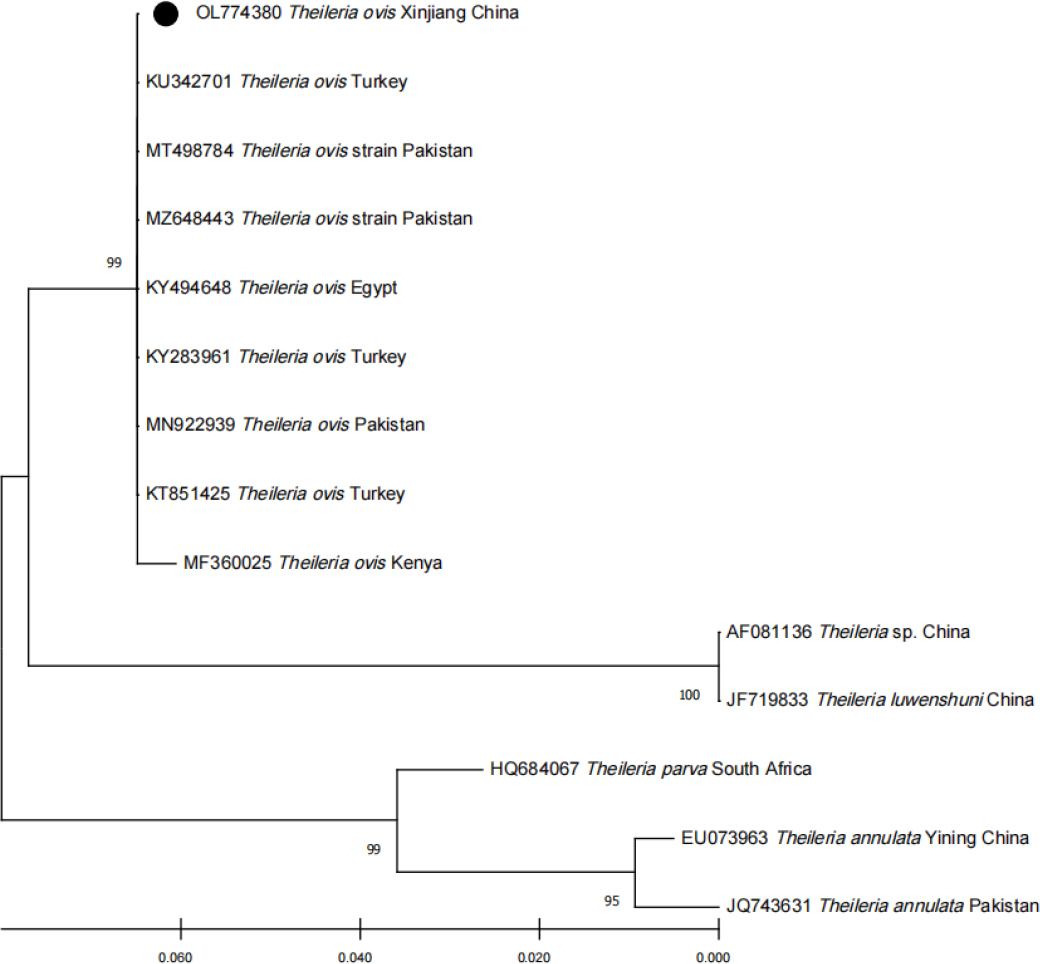
Fig. 3.
The phylogenetic analysis of Theileria ovis identified in this study based on the 18S rRNA gene sequences. The tree was constructed using the maximum likelihood method. The numbers at nodes represent the percentage occurrence of the clade in 1,000 bootstrap replications. The sequence from this study is indicated by a black dot
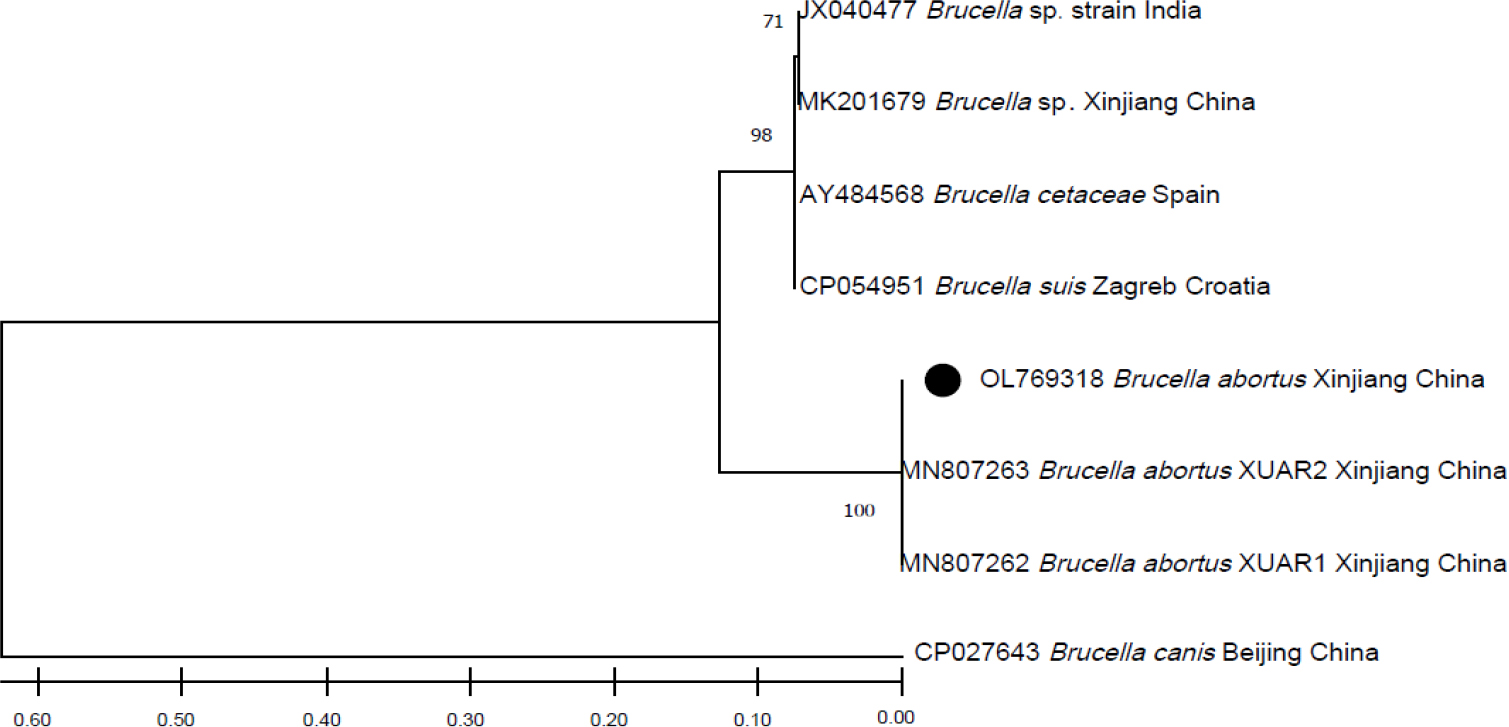
Fig. 4.
The phylogenetic analysis of Brucella abortus identified in this study based on the Omp22 gene sequences. The tree was constructed using the maximum likelihood method. The numbers at nodes represent the percentage occurrence of the clade in 1,000 bootstrap replications. The sequence from this study is indicated by a black dot