
Table 1.
Mass spectrometry parameters for precursor ions and product ion transitions of neuroleptics and internal standards
| Analyte | Retention time (min) | Precursor ion (m/z) | Ion transition (m/z) | Declustering potential (eV) | Collision energy (eV) |
|---|---|---|---|---|---|
| Acepromazine | 2.76 | 326.9 | 86.1 | 100 | 24 |
| 58.2 | 72 | ||||
| Azaperol | 2.61 | 330.1 | 121.0 | 96 | 29 |
| 312.0 | 21 | ||||
| Azaperone | 2.65 | 328.1 | 165.0 | 91 | 27 |
| 122.9 | 43 | ||||
| Carazolol | 2.60 | 299.1 | 116.0 | 96 | 27 |
| 222.0 | 27 | ||||
| Chlorpromazine | 2.85 | 319.0 | 86.0 | 96 | 25 |
| 245.9 | 31 | ||||
| Haloperidol | 2.74 | 376.0 | 165.1 | 110 | 30 |
| 123.0 | 43 | ||||
| Propionylpromazine | 2.82 | 341.0 | 58.0 | 95 | 70 |
| 86.0 | 25 | ||||
| Xylazine | 2.52 | 221.0 | 90.0 | 100 | 27 |
| 164.1 | 33 | ||||
| Acepromazine - D6 | 2.76 | 333.0 | 92.0 | 110 | 25 |
| 64.0 | 69 | ||||
| Azaperol - D4 | 2.61 | 334.1 | 121.0 | 96 | 31 |
| 153.0 | 39 | ||||
| Azaperone - D4 | 2.65 | 332.1 | 169.0 | 101 | 29 |
| 121.0 | 29 | ||||
| Carazolol - D7 | 2.60 | 306.1 | 123.1 | 101 | 27 |
| 222.0 | 27 | ||||
| Chlorpromazine - D6 | 2.85 | 325.0 | 92.1 | 81 | 25 |
| 245.9 | 33 | ||||
| Propionylpromazine - D6 | 2.82 | 347.0 | 92.1 | 100 | 24 |
| 64.1 | 70 | ||||
| Xylazine - D6 | 2.52 | 226.9 | 90.0 | 120 | 29 |
| 170.0 | 34 |
Table 2.
Validation results for determination of neuroleptics in kidney and urine
| Analyte | Matrix | Repeatability (RSDr, %) | Within-lab reproducibility (RSDwR, %) | Apparent recovery (%) | Expanded uncertainty (μg kg−1) | CCα (μg kg−1) |
|---|---|---|---|---|---|---|
| Acepromazine | Kidney | 9.3 | 7.1 | 97.1 | 0.82 | 2.5 |
| Urine | 9.8 | 8.3 | 101.6 | 1.04 | 2.5 | |
| Azaperol | Kidney | 9.5 | 6.7 | 100.6 | 0.85 | 2.5 |
| Urine | 7.7 | 8.1 | 101.0 | 1.10 | 2.5 | |
| Azaperone | Kidney | 7.0 | 5.5 | 100.5 | 0.80 | 2.5 |
| Urine | 6.0 | 5.2 | 101.2 | 0.67 | 2.5 | |
| Carazolol | Kidney | 6.4 | 5.0 | 99.9 | 0.70 | 2.5 |
| Urine | 7.4 | 9.8 | 101.6 | 1.43 | 2.5 | |
| Chlorpromazine | Kidney | 7.4 | 9.2 | 100.5 | 1.43 | 2.5 |
| Urine | 6.6 | 7.3 | 101.3 | 0.96 | 2.5 | |
| Haloperidol | Kidney | 8.0 | 10.4 | 97.2 | 1.49 | 2.5 |
| Urine | 12.0 | 18.0 | 100.6 | 2.03 | 2.5 | |
| Propionylpromazine | Kidney | 8.5 | 8.3 | 97.3 | 1.08 | 2.5 |
| Urine | 9.5 | 8.2 | 102.1 | 1.28 | 2.5 | |
| Xylazine | Kidney | 9.2 | 10.5 | 99.3 | 1.45 | 2.5 |
| Urine | 9.4 | 8.7 | 100.0 | 1.13 | 2.5 |
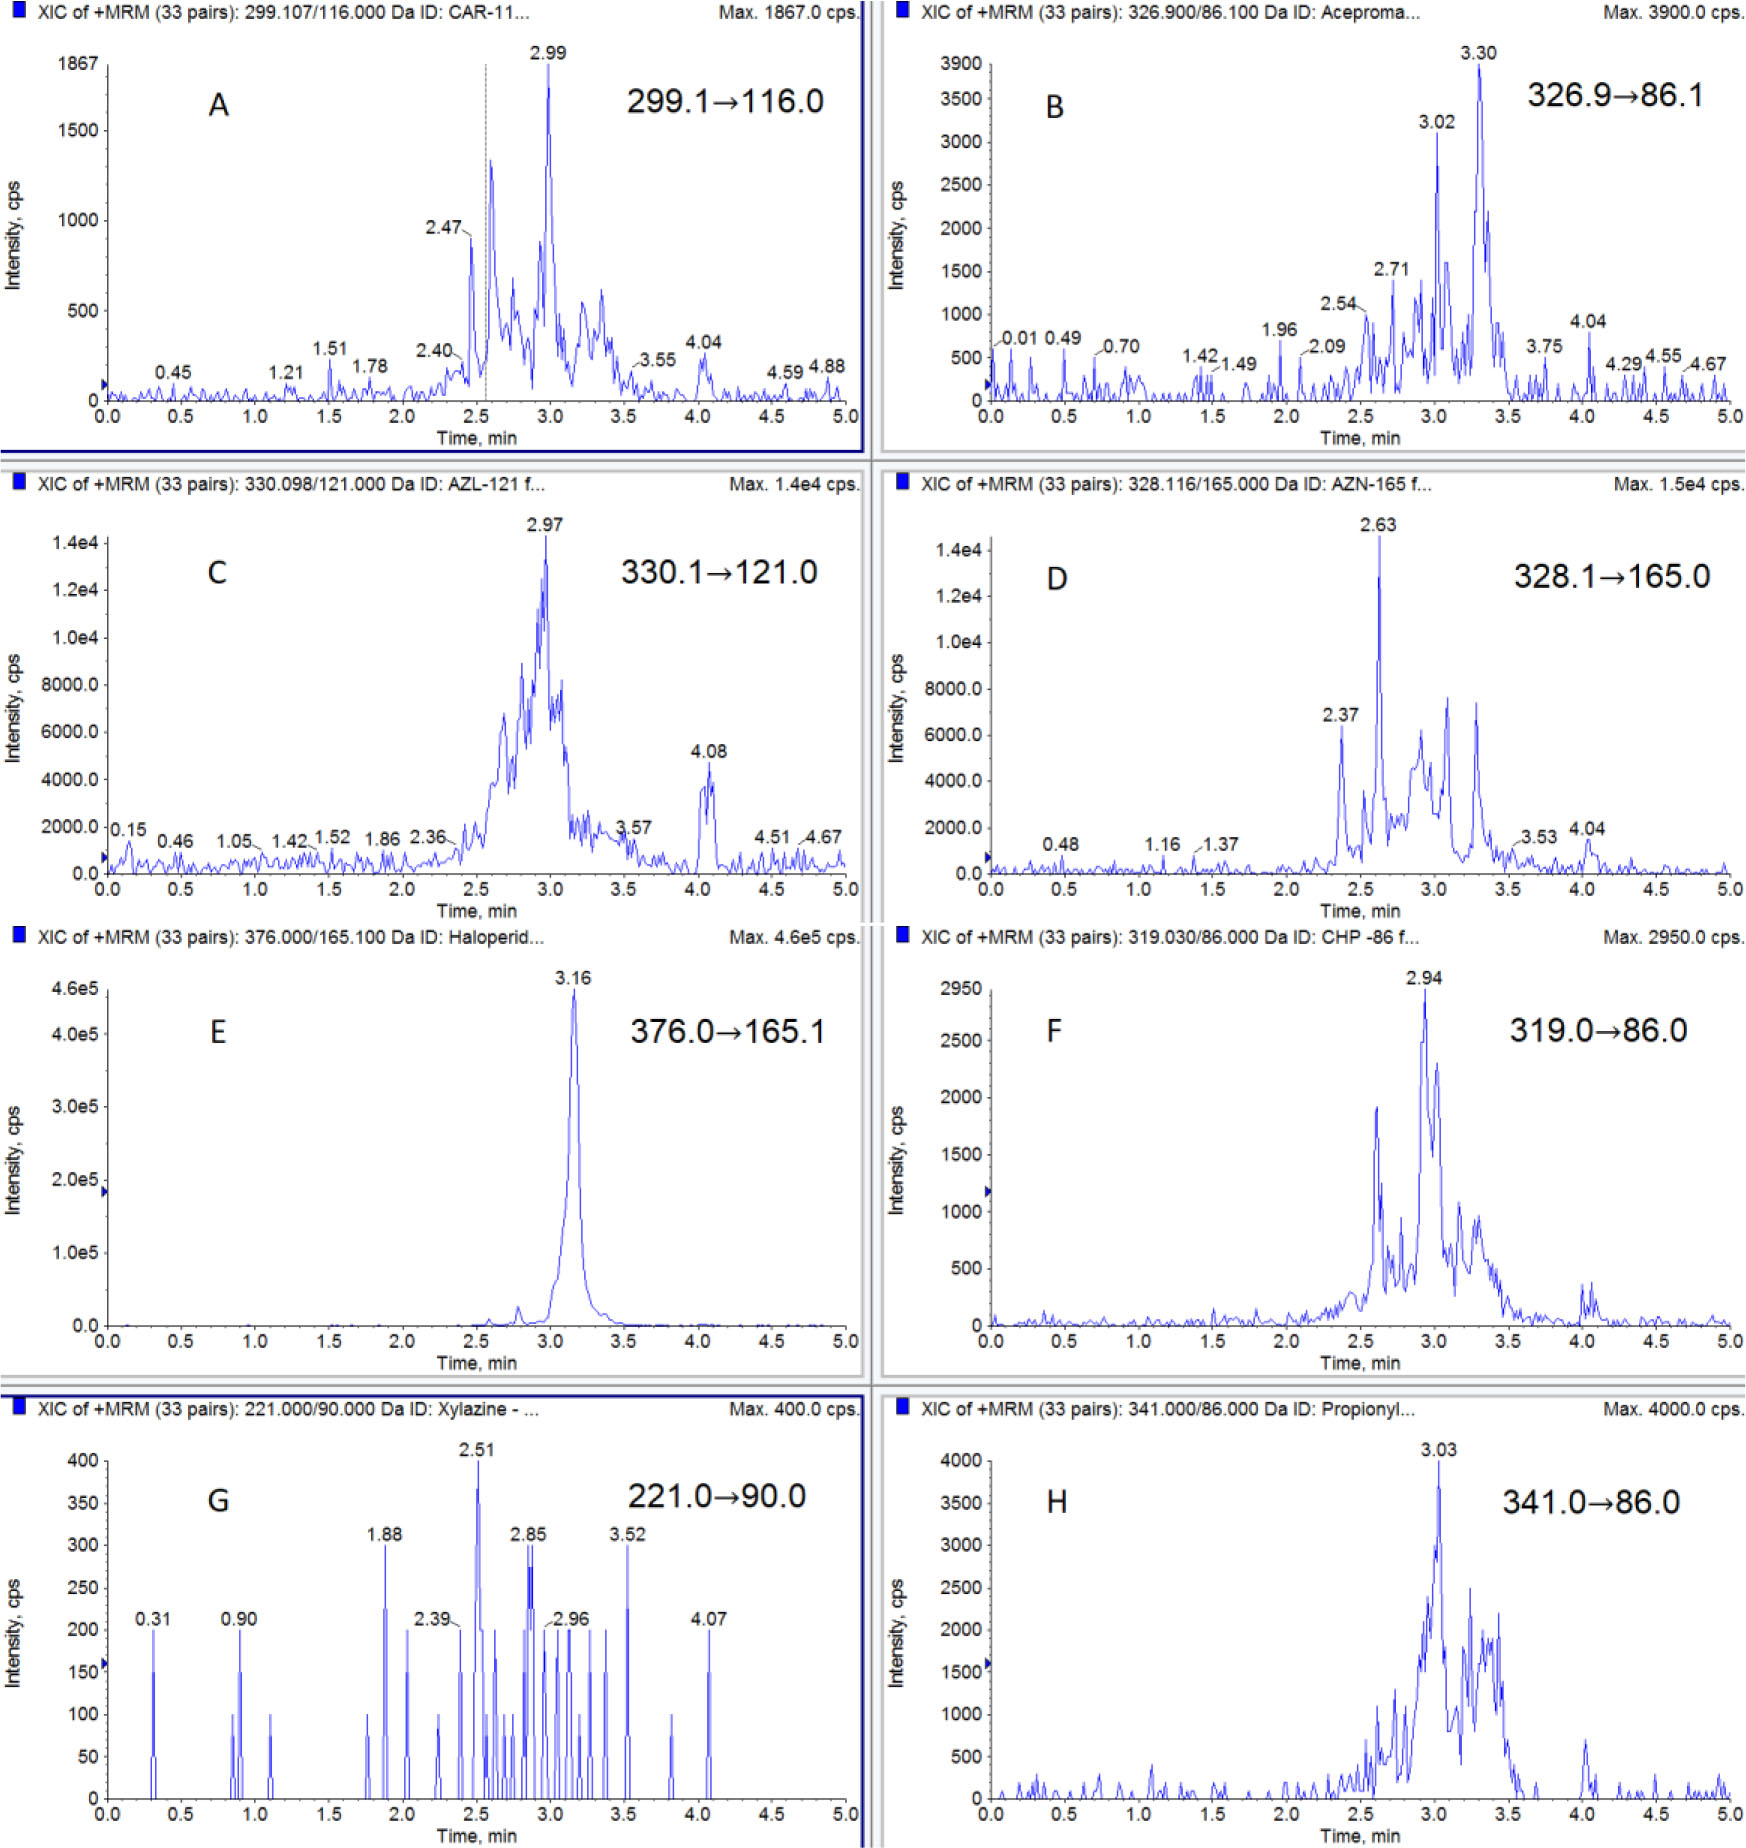
Fig. 1.
Chromatograms of blank kidney samples. A) carazolol; B) acepromazine; C) azaperol; D) azaperone; E) haloperidol; F) chlorpromazine; G) xylazine; H) propionylpromazine
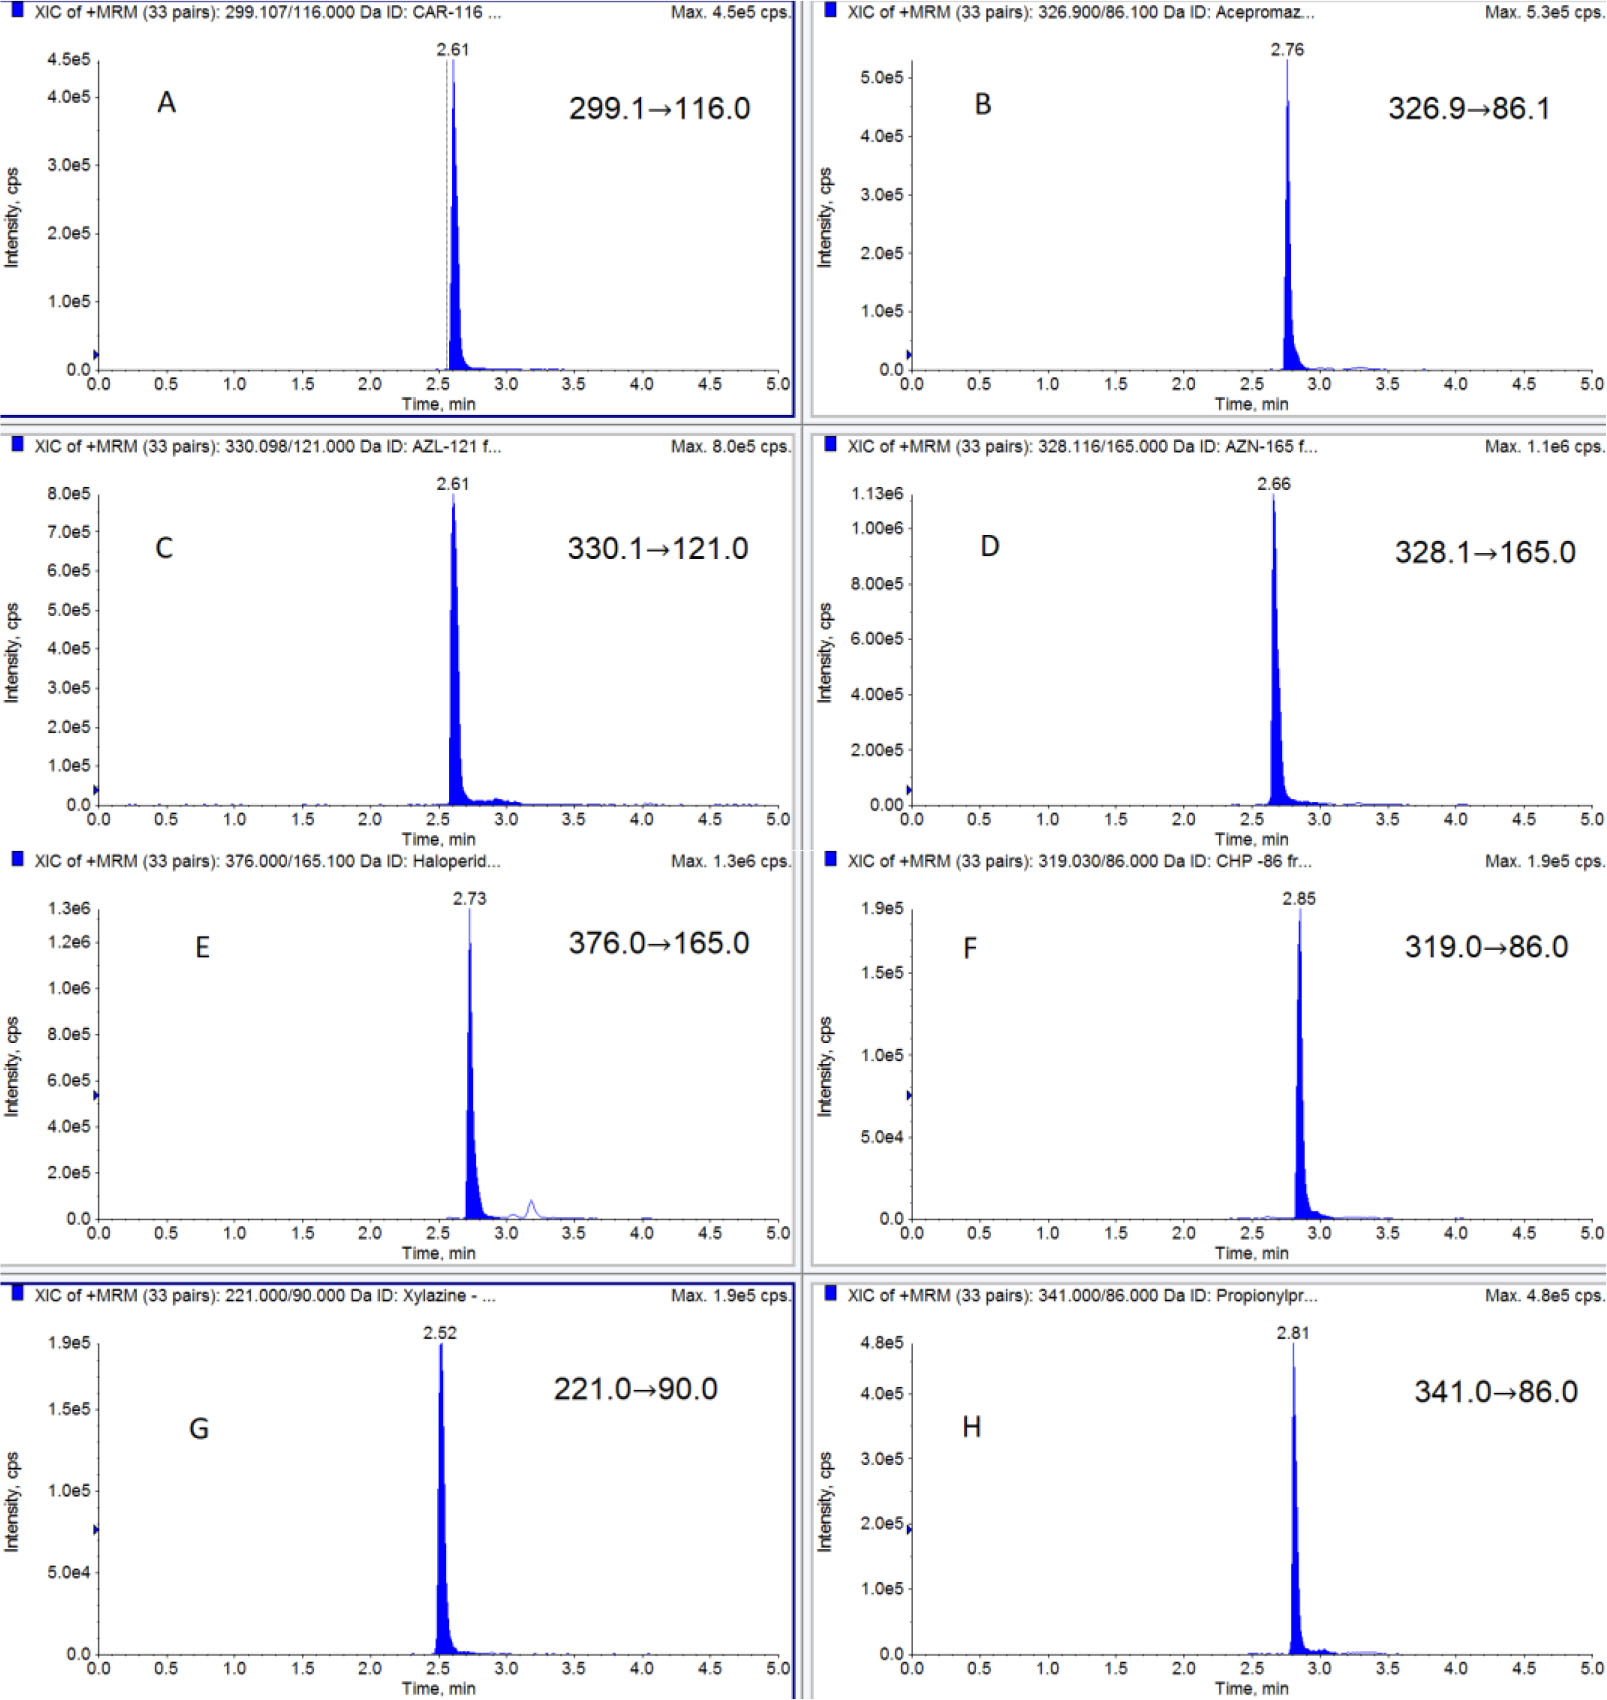
Fig. 2.
Chromatograms of kidney tissue samples spiked at 5.0 μg kg−1 for A) carazolol (tR = 2.61); B) acepromazine (tR = 2.76); C) azaperol (tR = 2.61); D) azaperone (tR = 2.66); E) haloperidol (tR = 2.73); F) chlorpromazine (tR = 2.85); G) xylazine (tR = 2.52); H) propionylpromazine (tR = 2.81)
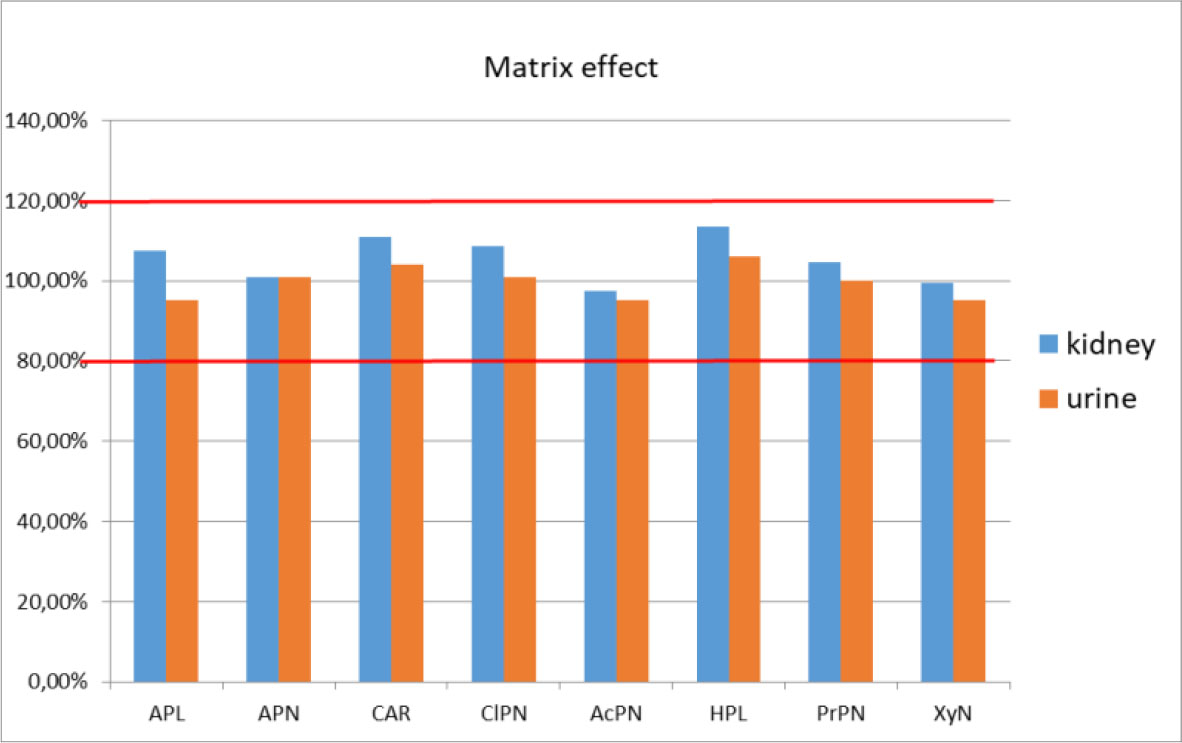
Fig. 3.
Matrix effect in liquid chromatography–tandem mass spectrometry to detect sedatives in pig and cattle kidney tissue and urine. APN – azaperone; APL – azaperol; CAR – carazolol; ClPN – chlorpromazine; AcPN – acepromazine; HPL – haloperidol; PrPN – propionylpromazine; XyN – xylazine. Red lines – boundaries of suppressive (lower) or enhancing (upper) matrix effect
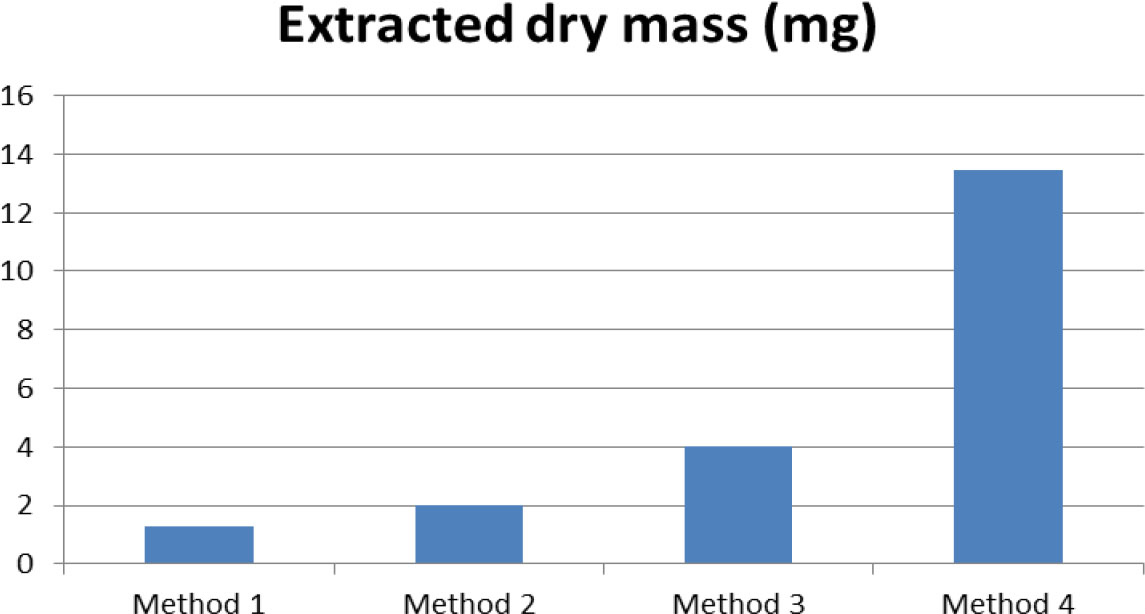
Fig. 4.
Comparison of extracted dry mass (g) from 1 g kidney samples using different methods. Method 1 – standard method; Method 2 – standard method with modification (nylon filter); Method 3 – standard method with modification (TiO2); Method 4 – standard method with modification (ethyl acetate)
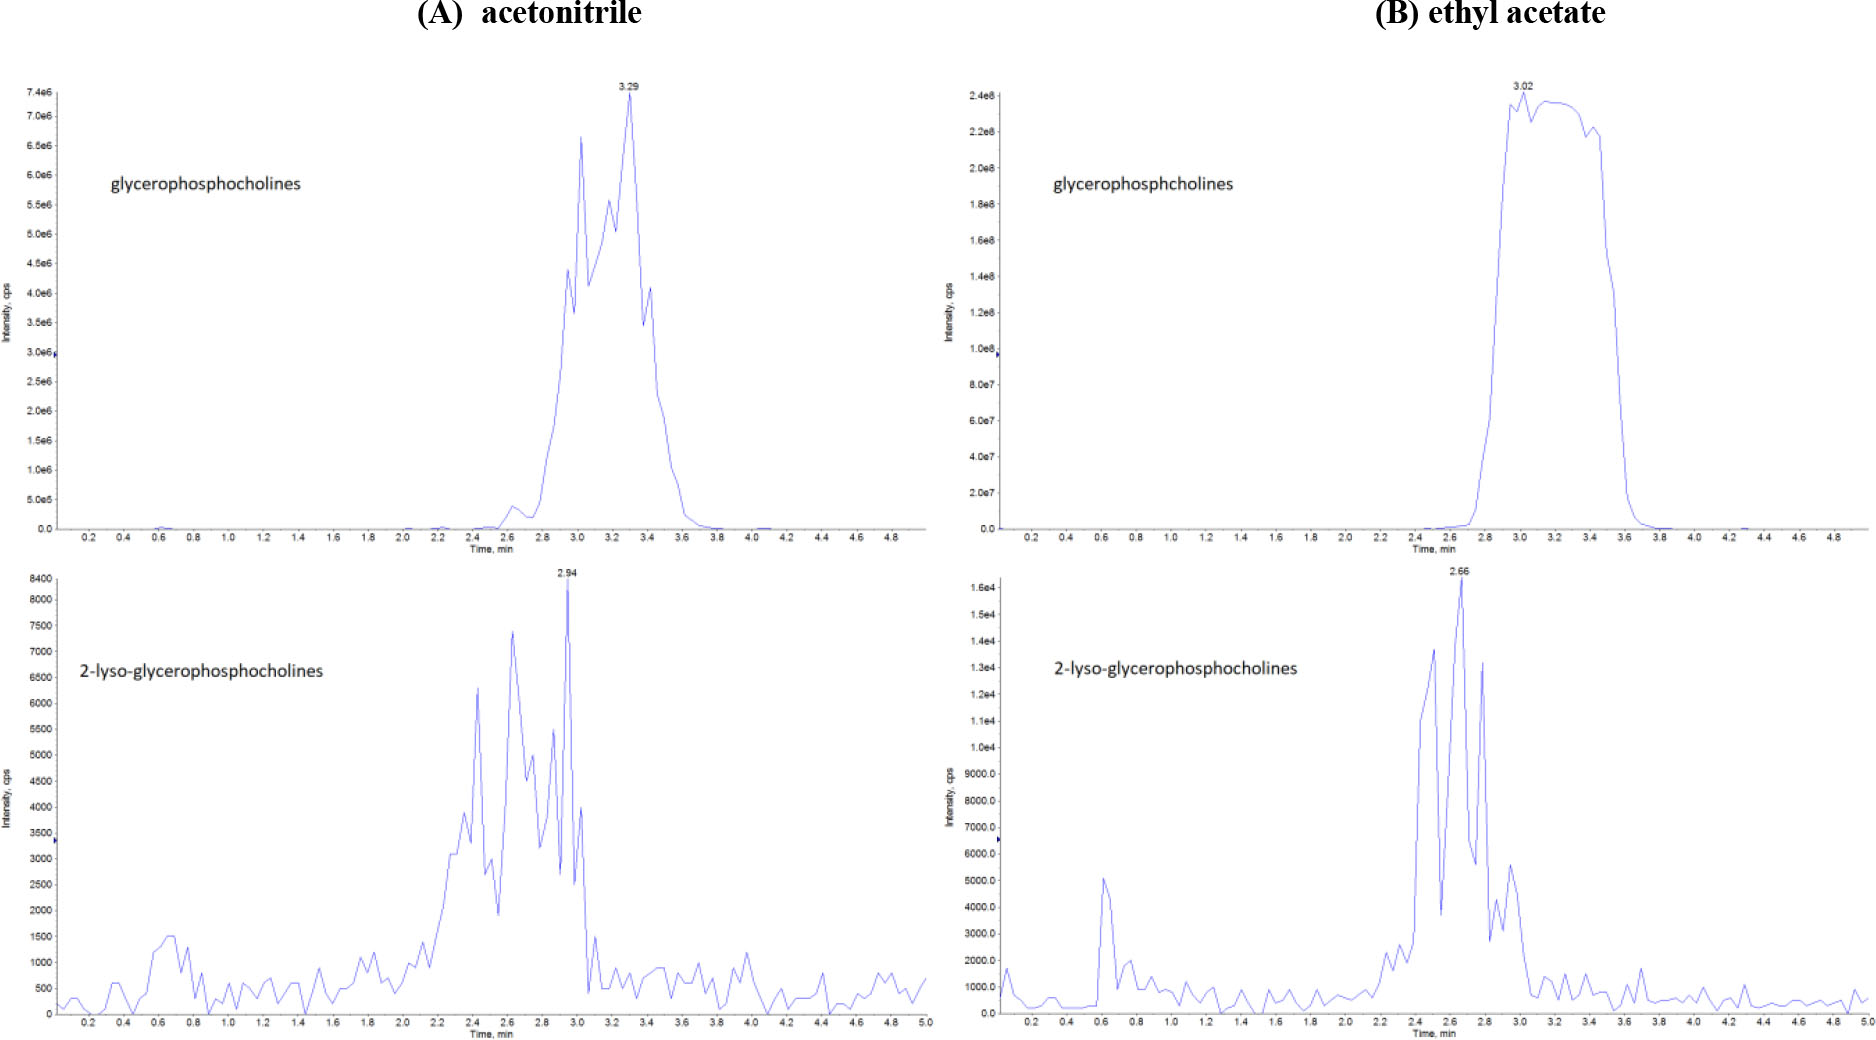
Fig. 5.
Chromatograms of glycerophosphocholines (184 m/z) and 2-lyso-glycerophosphocholines (104 m/z) (A) after acetonitrile extraction, (B) after ethyl acetate extraction from kidney