
Table 1.
Prevalence of pathogens isolated from mastitic-quarter milk samples
| Pathogen | n | Prevalence (%) |
|---|---|---|
| Streptococcus uberis | 6 | 9.23 |
| Streptococcus dysgalactiae | 1 | 1.54 |
| Staphylococcus aureus | 1 | 1.54 |
| Coagulase-negative staphylococci | 4 | 6.15 |
| Escherichia coli | 1 | 1.54 |
| Klebsiella spp. | 2 | 3.08 |
| No growth | 33 | 50.77 |
| Contamination | 17 | 26.15 |
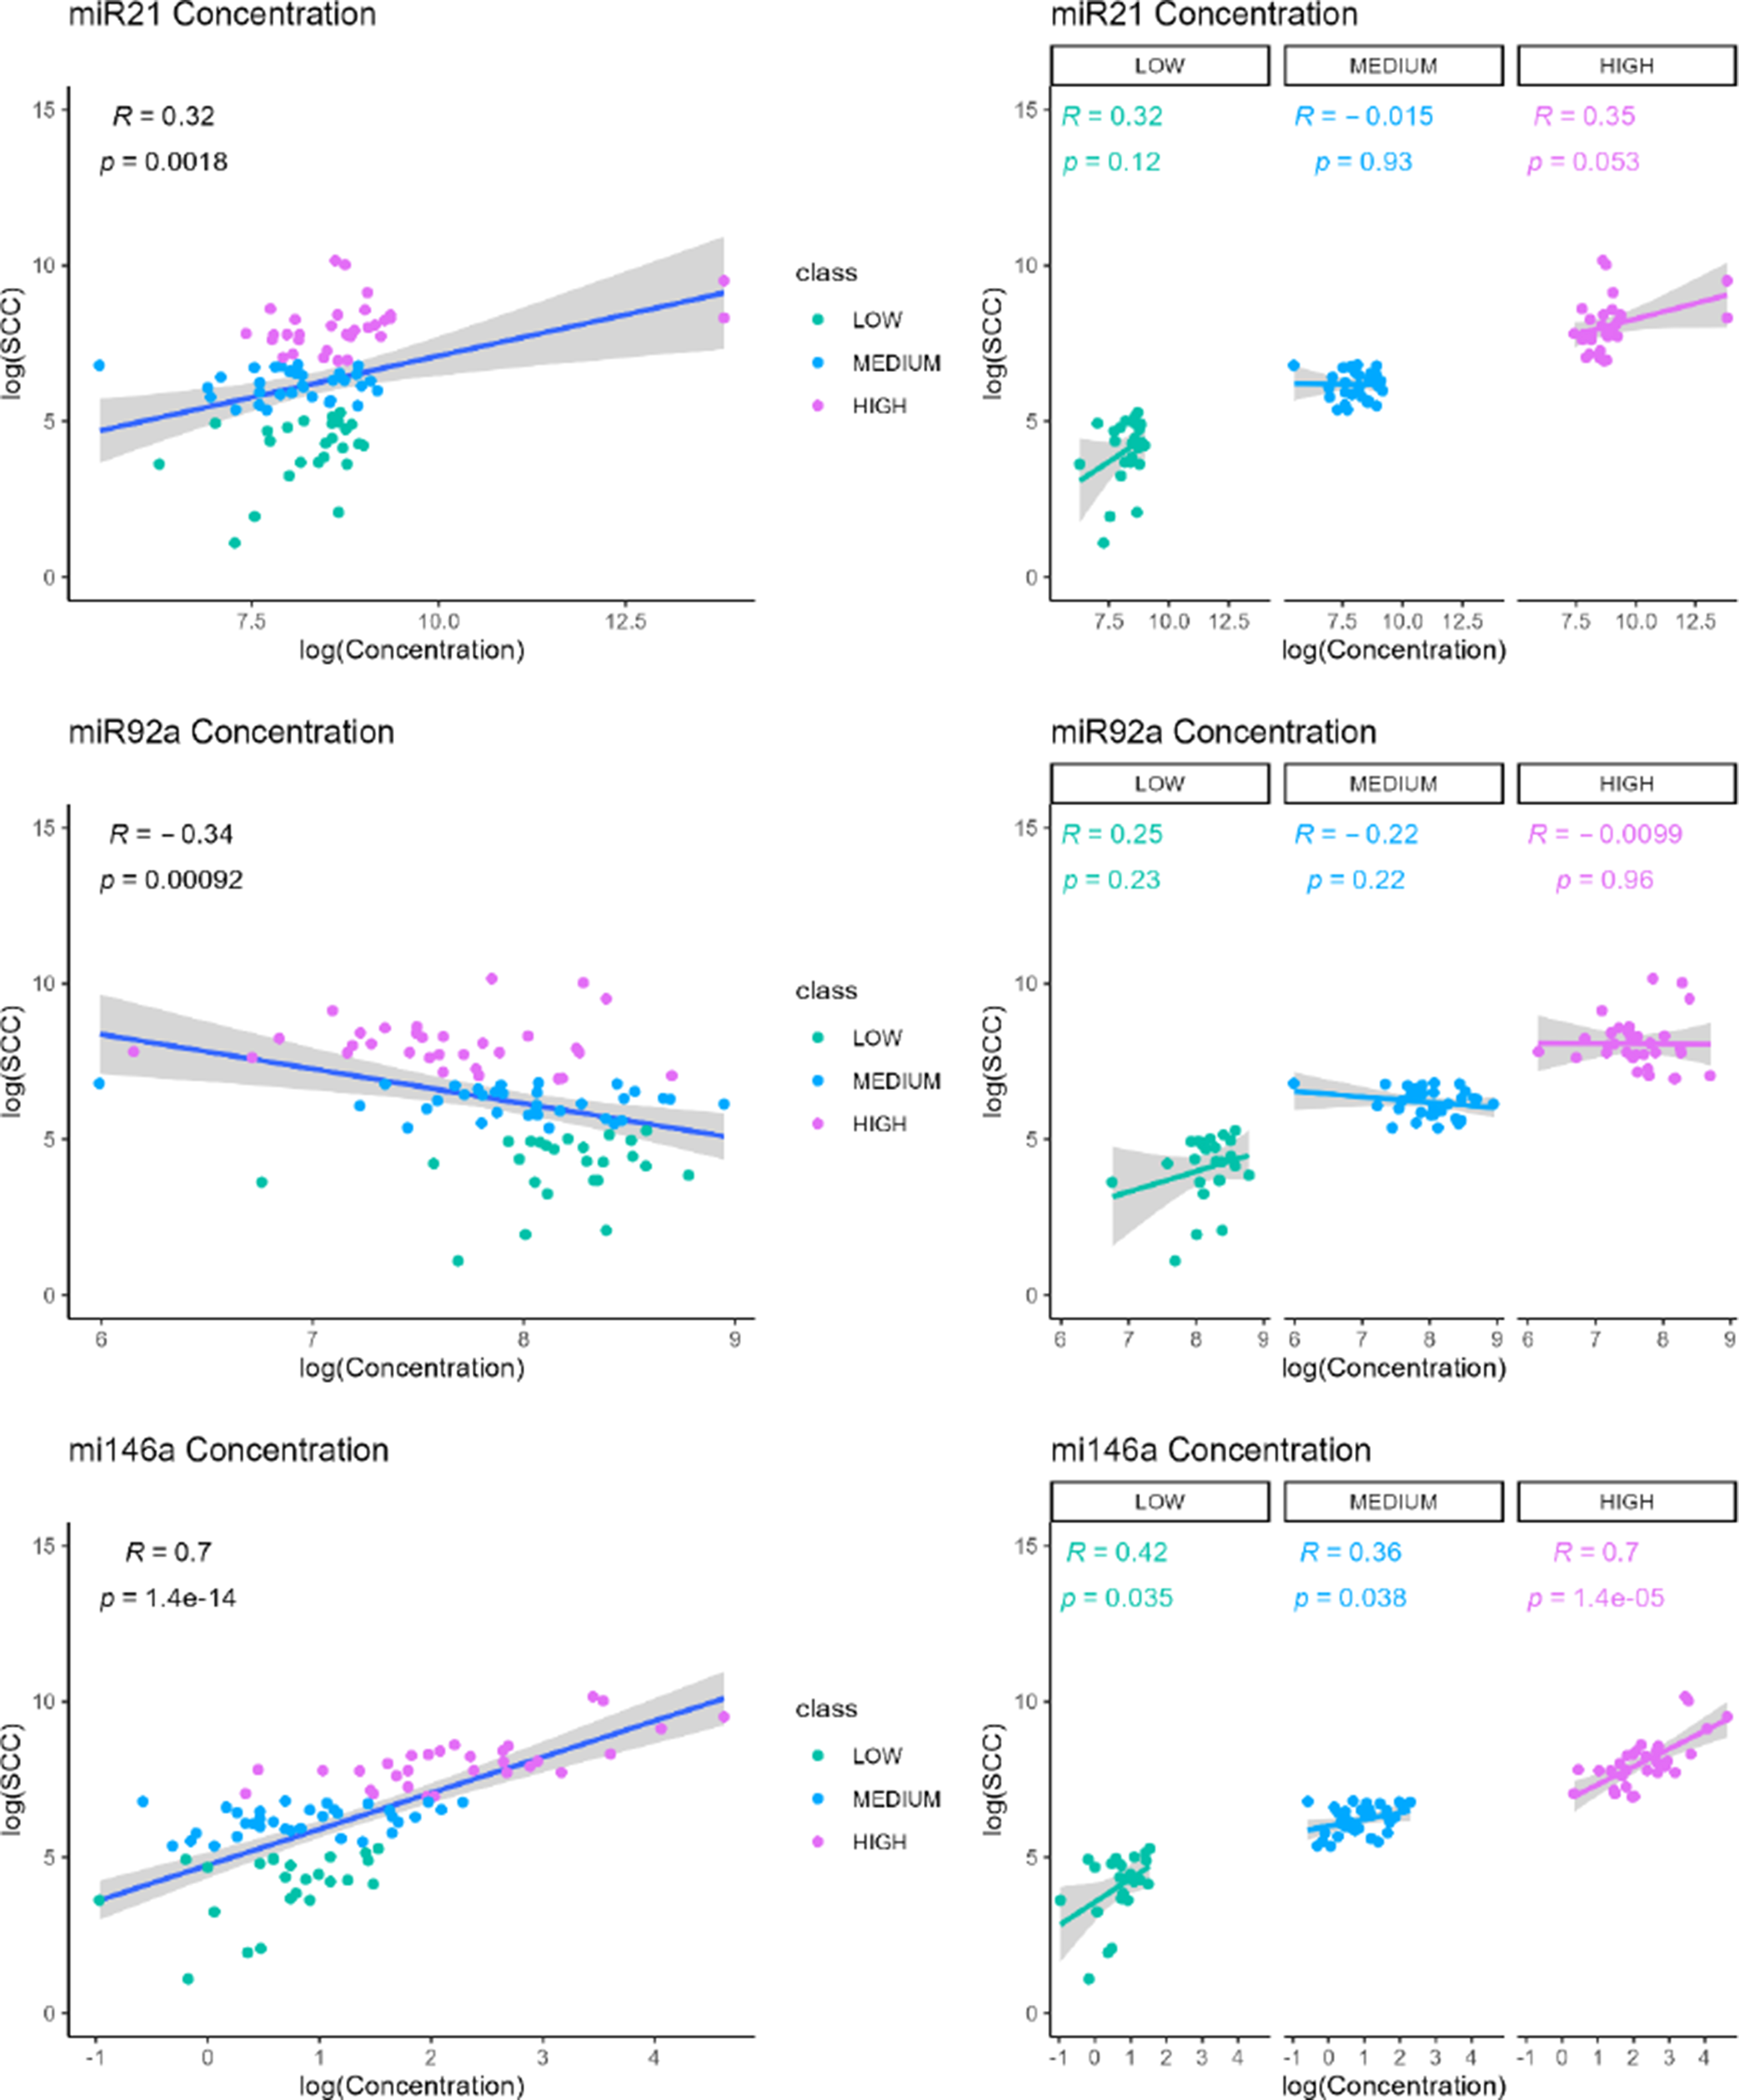
Fig. 1.
Correlation between log(SCC) and concentrations of miR-21a, miR-92a and miR-146a in healthy and mastitic milk samples. The grey area below the figures indicates the 95% confidence interval. Low – somatic cell count < 200,000/mL; Medium – 200,000/mL ≤ somatic cell count < 1,000,000/mL; High – somatic cell count ≥ 1,000,000/mL
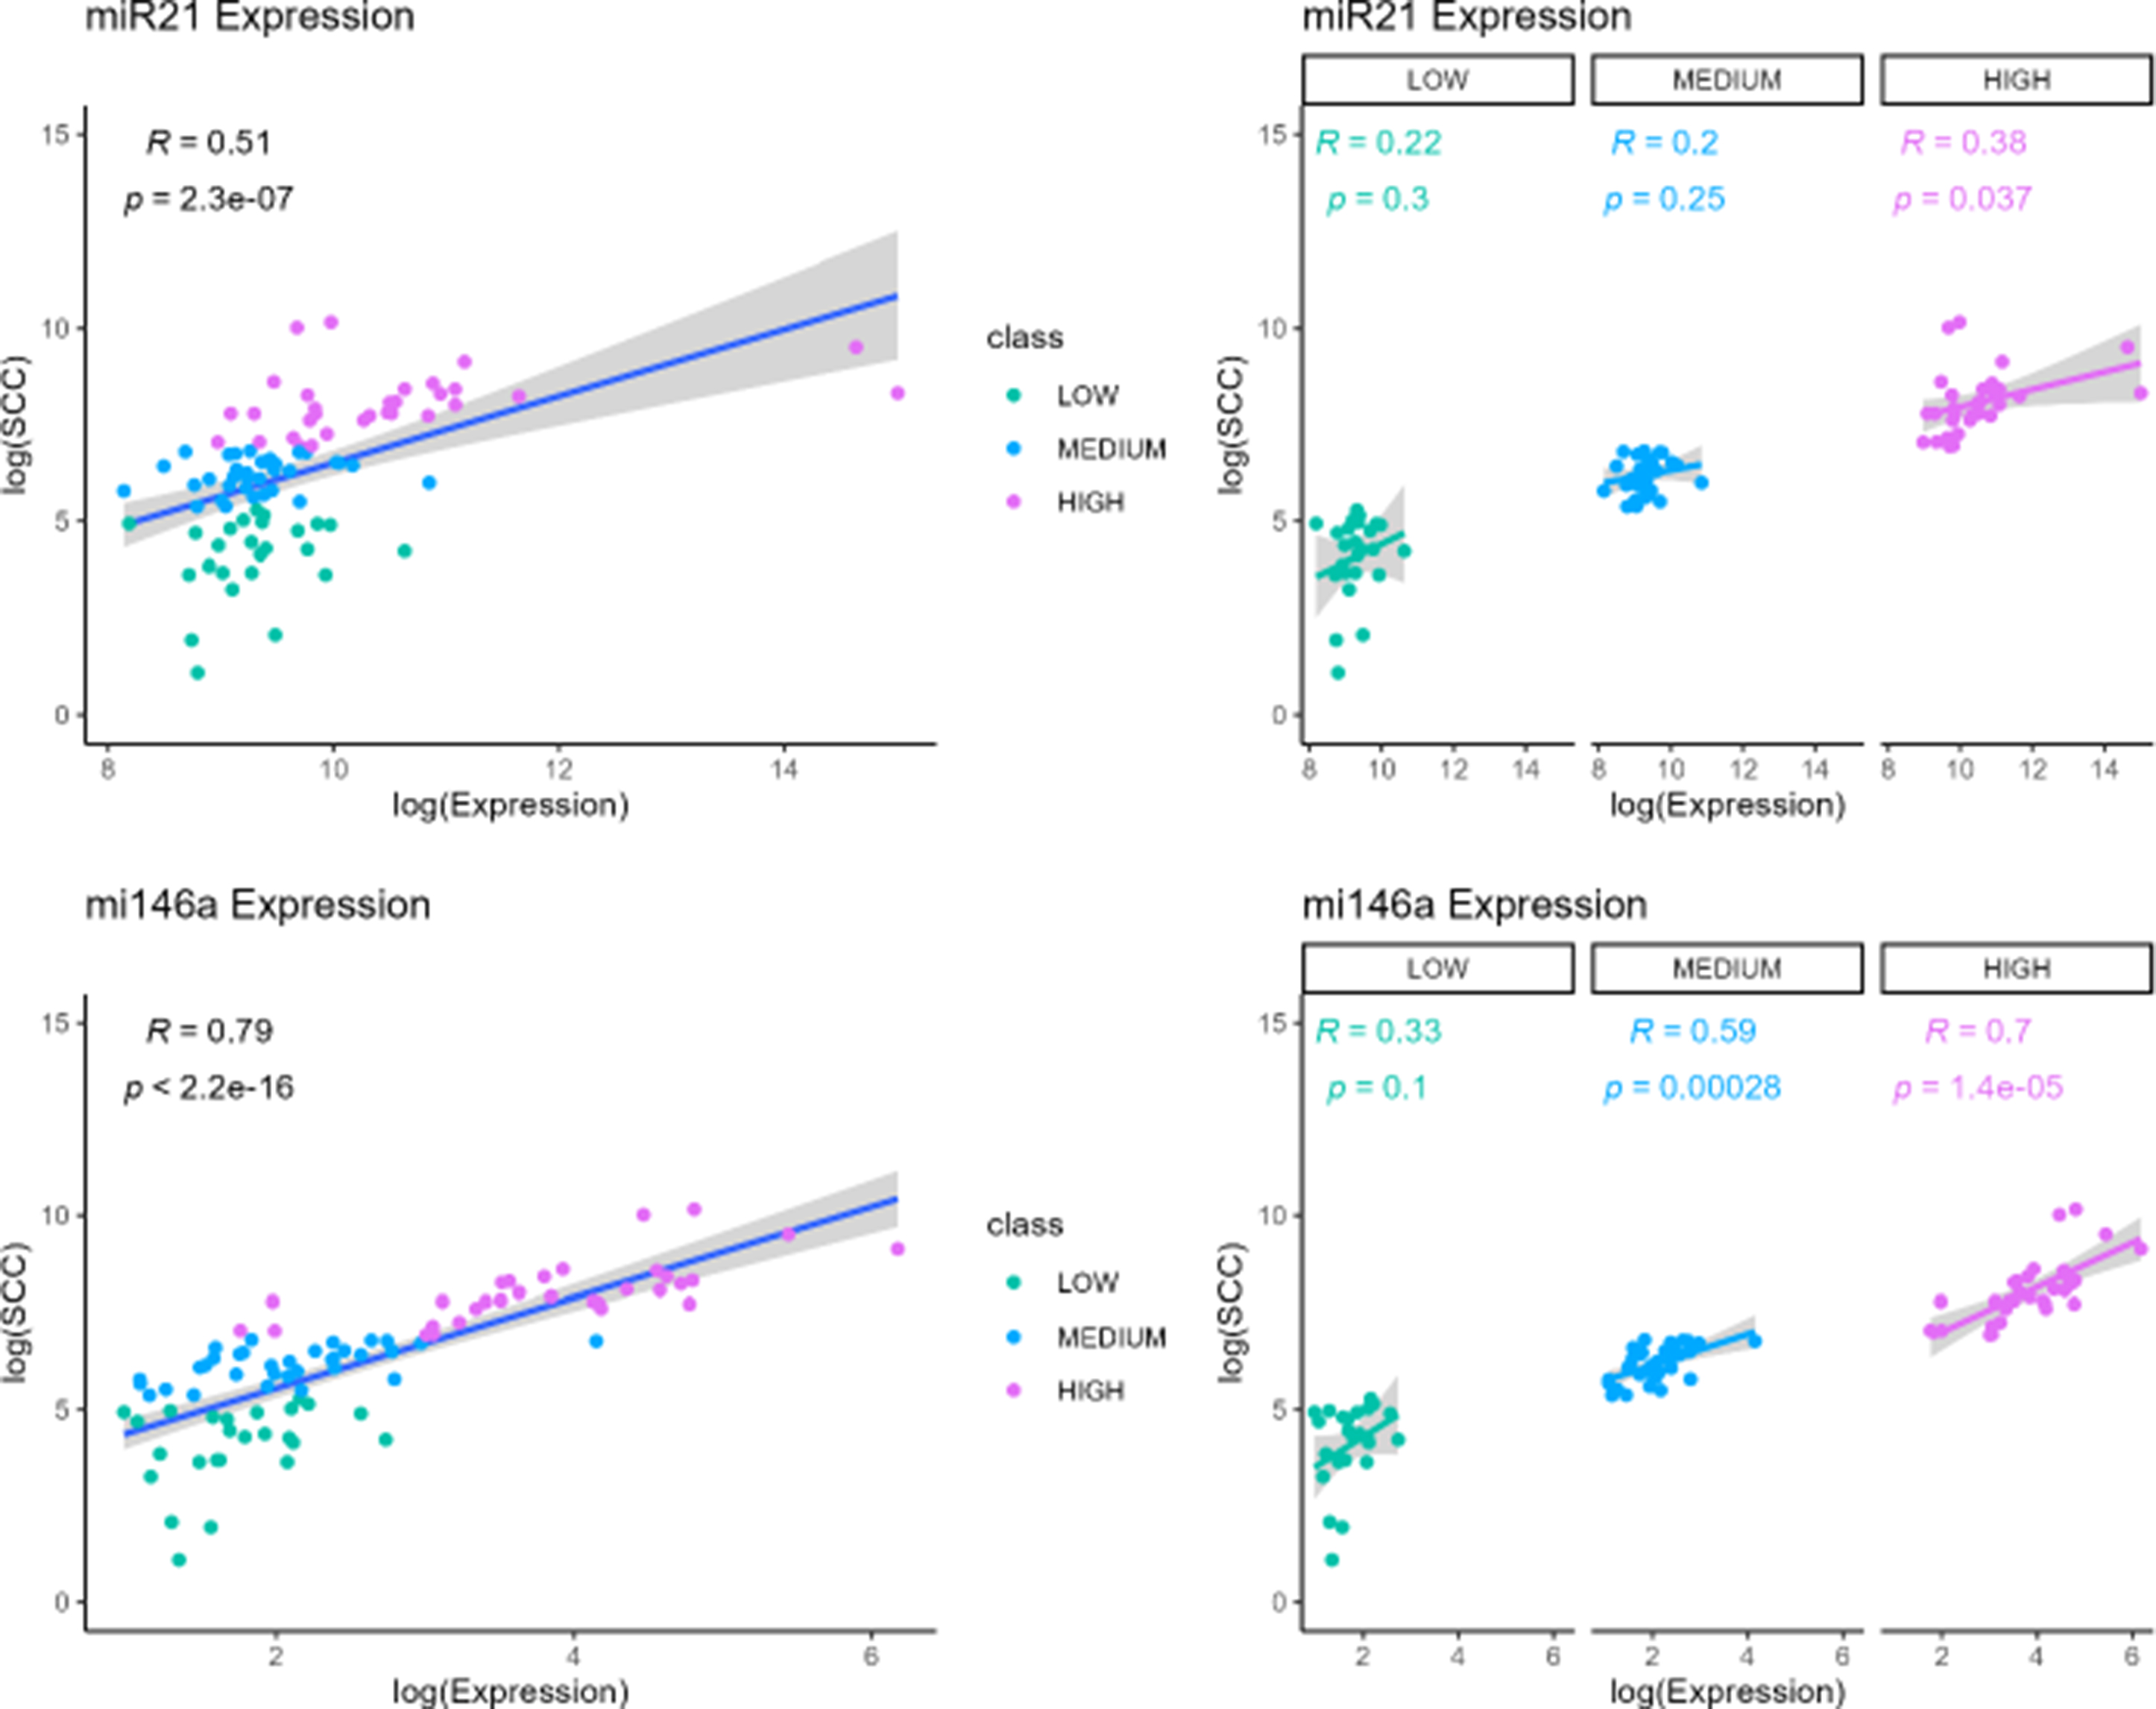
Fig. 2.
Correlation between log(SCC) and the relative expression levels of miR-21a and miR-146a in healthy and mastitic milk samples. The grey area below the figures indicates the 95% confidence interval. Low – somatic cell count < 200,000/mL; Medium – 200,000/mL ≤ somatic cell count < 1,000,000/mL; High – somatic cell count ≥ 1,000,000/mL
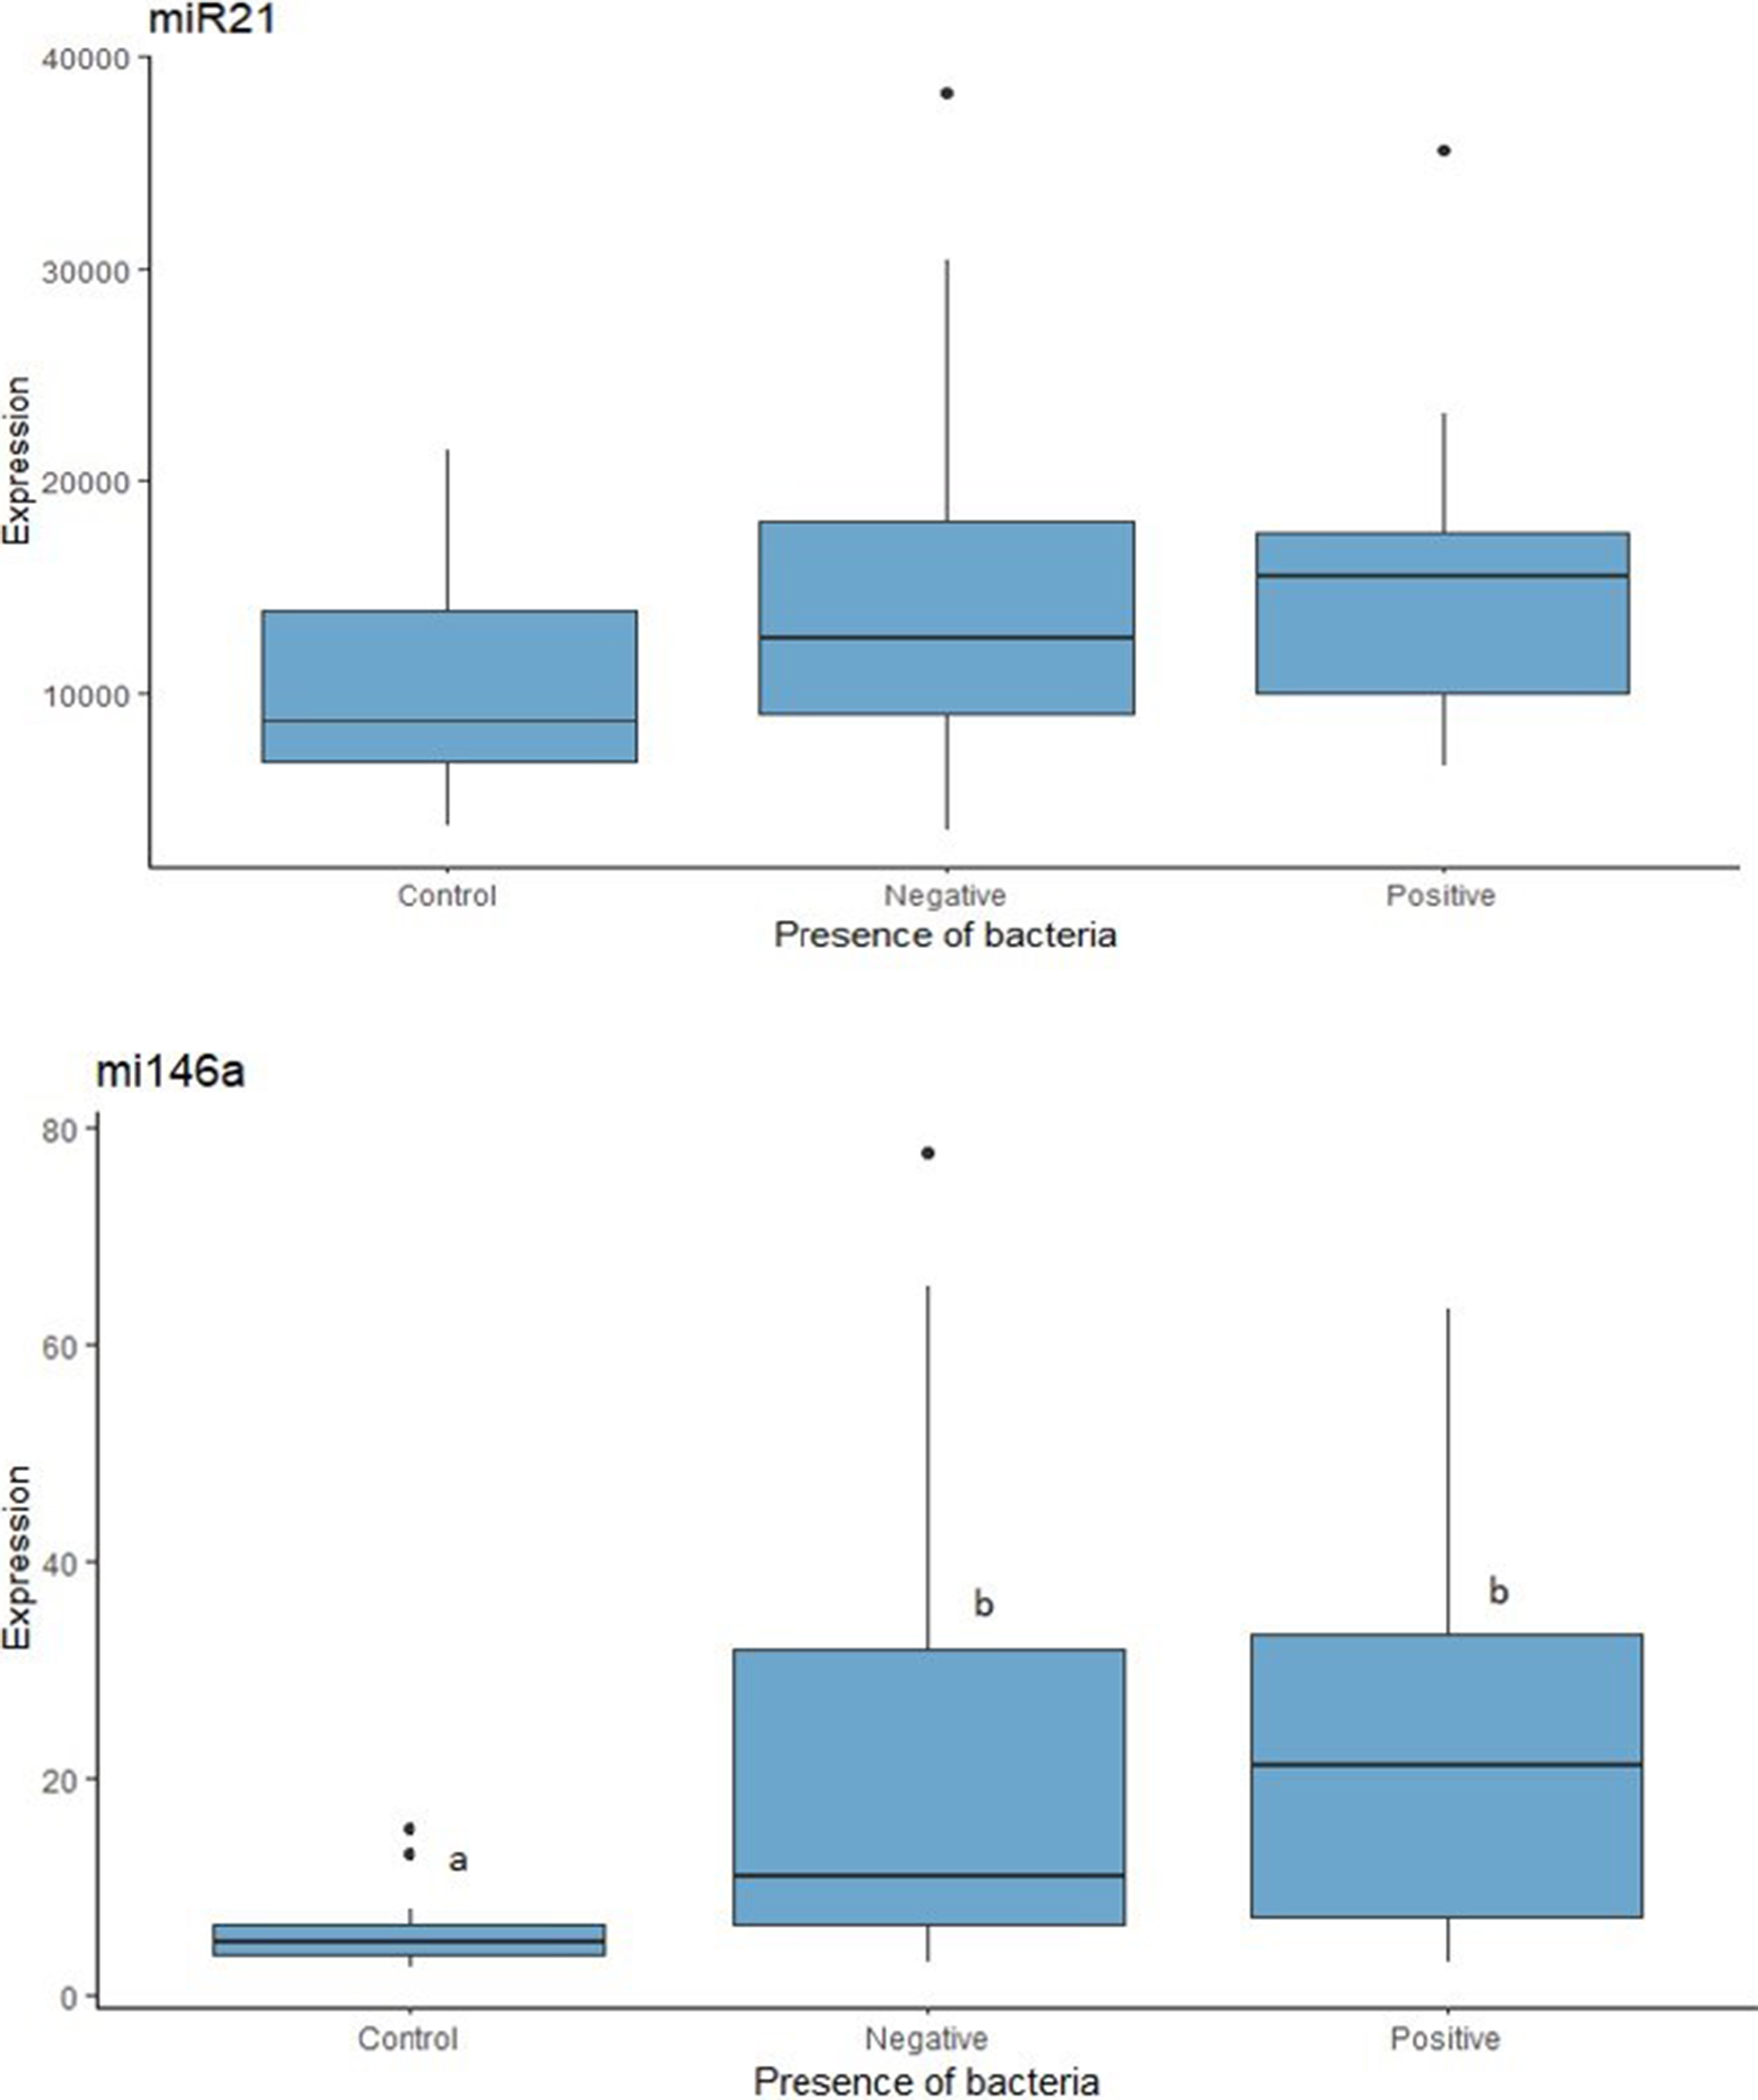
Fig. 3.
Relative expression levels of miR-21a and miR-146a in three groups based on somatic cell counts and presence of a mastitoge. a, b – significant differences (P-value < 0.05)
Table 2.
Performance of the K-nearest neighbour regression model, by somatic cell count class in healthy and mastitic milk samples
| Parameter | Three-class analysis | Two-class analysis | ||
|---|---|---|---|---|
| Low | Medium | High | Low | |
| Sensitivity | 0.67 | 0.67 | 0.82 | 0.98 |
| Specificity | 0.85 | 0.75 | 0.98 | 0.95 |
| Positive predictive value | 0.63 | 0.62 | 0.95 | 0.98 |
| Negative predictive value | 0.87 | 0.79 | 0.91 | 0.95 |
| Balanced accuracy | 0.76 | 0.71 | 0.90 | 0.97 |