
Table 1.
Effects of N-acetyl-1-cysteine (NAC) on liver and kidney function tests in adult male albino Wistar rats exposed to penconazole (PEN)
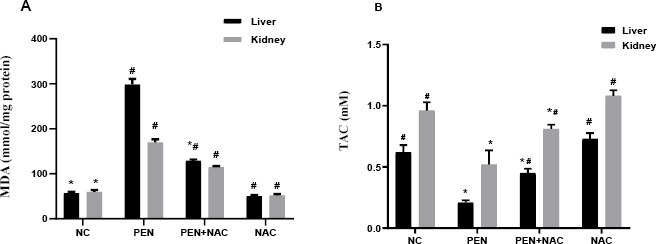
Fig. 1.
Effects of NAC on (A) malondialdehyde and (B) TAC in the liver and kidneys of adult male albino Wistar PEN-exposed rats. Data are presented as mean ± standard error of the mean (whiskers) (n = 6)
# – significantly different to NC group; * – significantly different to PEN group; NC – normal control; PEN – penconazole; NAC – N-acetyl-1-cysteine; TAC – total antioxidant capacity
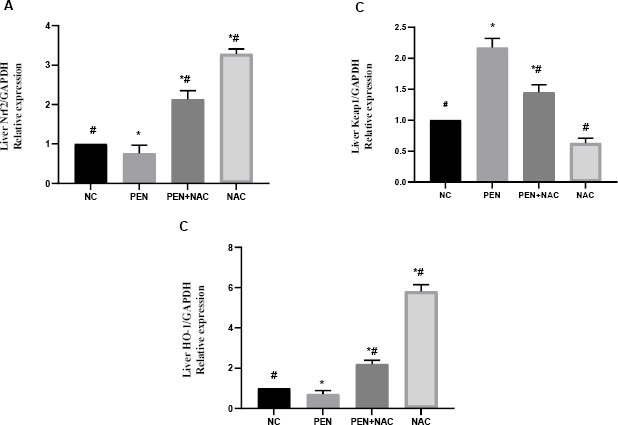
Fig. 2.
Effect of N-acetyl-1-cysteine (NAC) in adult male albino Wistar rats against penconazole (PEN)-induced alterations on hepatic messenger RNA expression of nuclear factor erythroid 2-related factor 2 (Nrf2) (A), Kelch-like erythroid cell-derived protein 1 (Keap1) (B) and haem oxygenase 1 (HO-1) (C). Data are presented as mean ± standard error of the mean (whiskers) (n = 6)
GAPDH – glyceraldehyde 3-phosphate dehydrogenase; # – significantly different to normal control (NC) group; * – significantly different to PEN group

Fig. 3.
Effect of N-acetyl-1-cysteine (NAC) in adult male albino Wistar rats against penconazole (PEN)-induced alterations on renal mRNA expression of nuclear factor erythroid 2-related factor 2 (Nrf2) (A), Kelch-like erythroid cell-derived protein 1 (Keap1) (B) and haem oxygenase 1 (HO-1) (C). Data are presented as mean ± standard error of the mean (whiskers) (n = 6)
GAPDH – glyceraldehyde 3-phosphate dehydrogenase; # – significantly different to normal control (NC) group; * – significantly different to PEN group

Fig. 4.
Photomicrograph of adult male albino Wistar rat liver tissue sections stained with haematoxylin and eosin representing the control group with normal histological structure (A), the penconazole (PEN)-receiving group showing hepatocellular vacuolisation (black arrows), necrosis (blue arrows), atrophy (black triangles), macrovesicular steatosis (red arrows), haemorrhaging (red star) and inflammatory cells infiltration (black stars) (B–F) and the PEN+N-acetyl-1-cysteine–receiving group showing sparse cell necrosis (blue arrows) and slight portal inflammation (black star) (G and H)
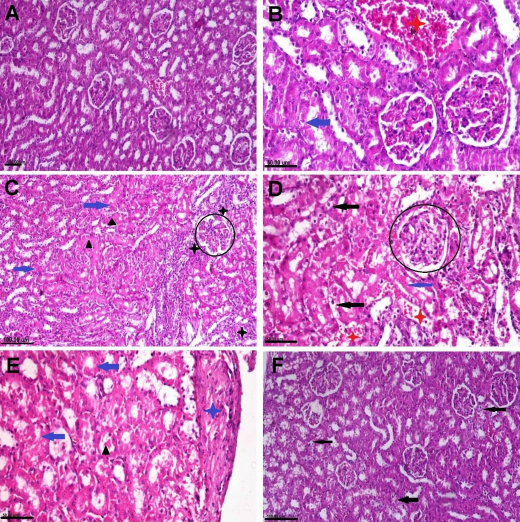
Fig. 5.
Photomicrograph of adult male albino Wistar rat kidney tissue sections stained with haematoxylin and eosin representing the control group with normal histological structure (A), the penconazole (PEN)-receiving group showing cytoplasmic vacuolisation (black arrows), necrosis (blue arrows) in the renal epithelium, intraluminal hyaline cast and droplets (black triangles), vascular congestion and haemorrhaging (red stars), inflammatory cells infiltration (black stars), capsular fibrosis (blue star) and glomerular degeneration (black circles) (B–E) and the PEN+N-acetyl-1-cysteine–receiving group showing mild degenerative changes in the tubular epithelium and some glomeruli (black arrows) (F)
Table 2.
The microscopic lesion scoring in adult male albino Wistar rats unexposed to penconazole (PEN), exposed to it, and exposed to it with N-acetyl-1 cysteine (NAC) coadministration
| NC | NAC | PEN | PEN+NAC | |
|---|---|---|---|---|
| Hepatic lesion scoring | ||||
| HCD | 0 a | 1 b | 4 c | 2 d |
| HCN | 0 a | 1 b | 2 c | 1 b |
| ICB | 0 a | 0 a | 4 b | 1 c |
| Congestion | 0 a | 1 b | 3 c | 1 b |
| Haemorrhage | 0 a | 0 a | 2 b | 0 a |
| Inflammation | 0 a | 0 a | 2 b | 1 c |
| Renal lesion scoring | ||||
| RTD | 0 a | 1 b | 4 c | 2 d |
| RTN | 0 a | 1 b | 4 c | 2 d |
| ICB | 0 a | 0 a | 4 b | 1 c |
| Congestion | 0 a | 1 b | 4 c | 2 d |
| Haemorrhage | 0 a | 0 a | 2 b | 0 a |
| Inflammation | 0 a | 0 a | 4 b | 1 c |
1 Values are presented as medians from five sections representing five rats/group. Values with different letters in the same column are significantly different at P ≤ 0.05
NC – normal control; HCD – hepatocellular degeneration; HCN – hepatocellular necrosis; ICB–intracellular eosinophilic bodies; RTD – renal tubular degeneration; RTN – renal tubular necrosis

Fig. 6.
Photomicrograph of adult male albino Wistar rat liver tissue sections stained by immunoperoxidase to localise TNF-α and NF-κB. The control group with normal TNF-α and NF-κB cytoplasmic expression (A and B), PEN group showing strong positive expression of both immune markers (C and D) and the PEN+NAC–receiving group showing weak positive expression of TNF-α and NF-κB (E and F)

Fig. 7.
Photomicrograph of adult male albino Wistar rat kidney tissue sections stained by immunoperoxidase to localise TNF-α and NF-κB. The control group with normal TNF-α and NF-κB cytoplasmic expression (A and B), PEN group showing strong positive expression of both immune markers (C and D) and the PEN+NAC–receiving group showing weak positive expression of TNF-α and NF-κB (E and F)