
Fig. 1
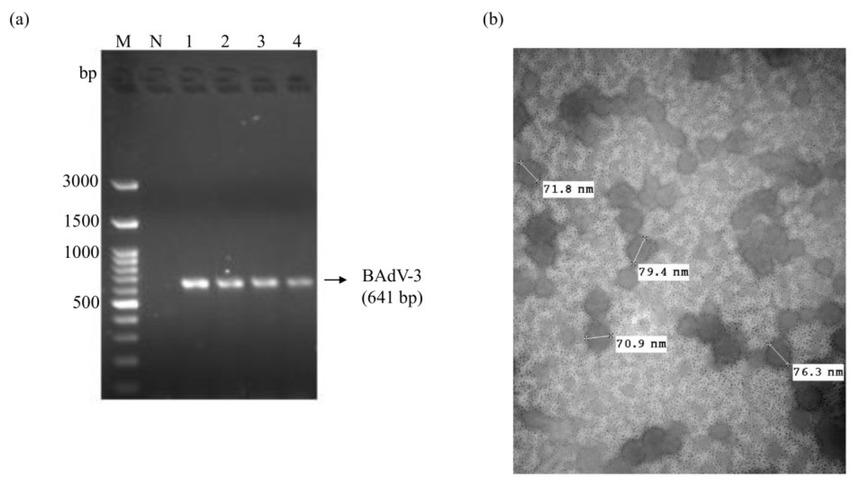
Fig. 2
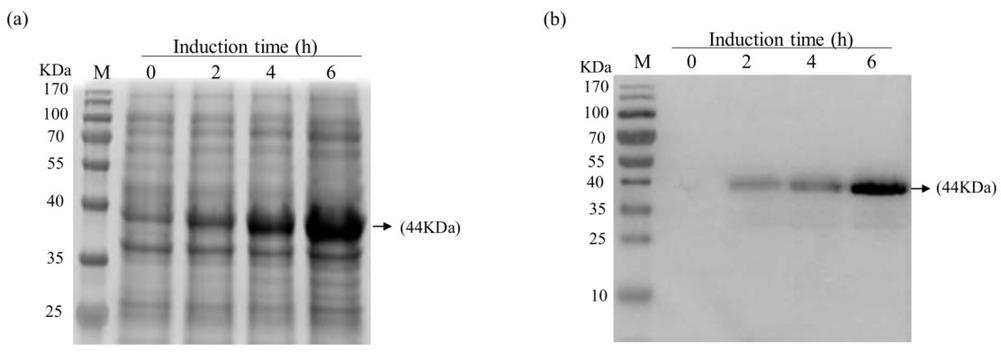
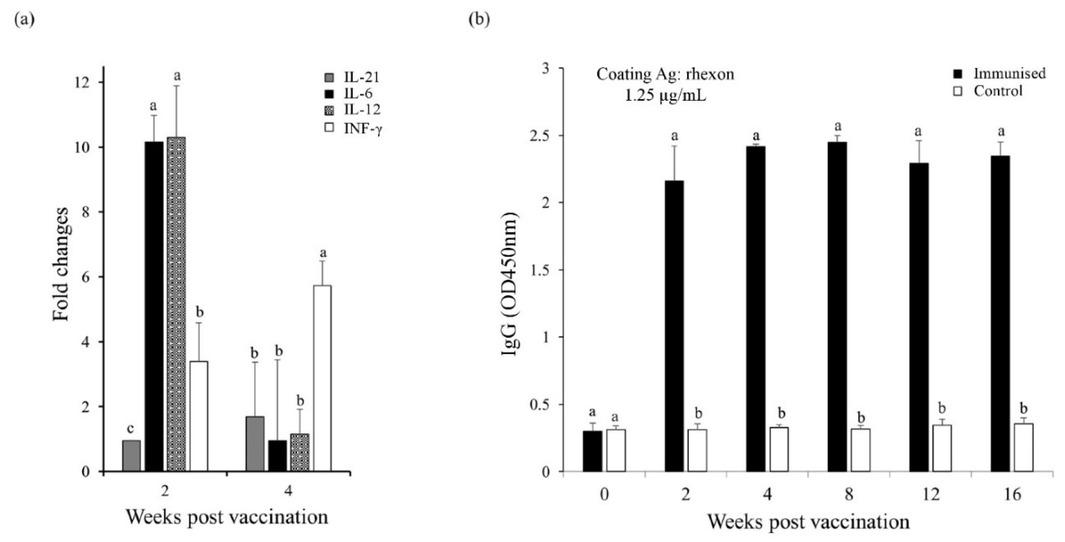
Fig. 3
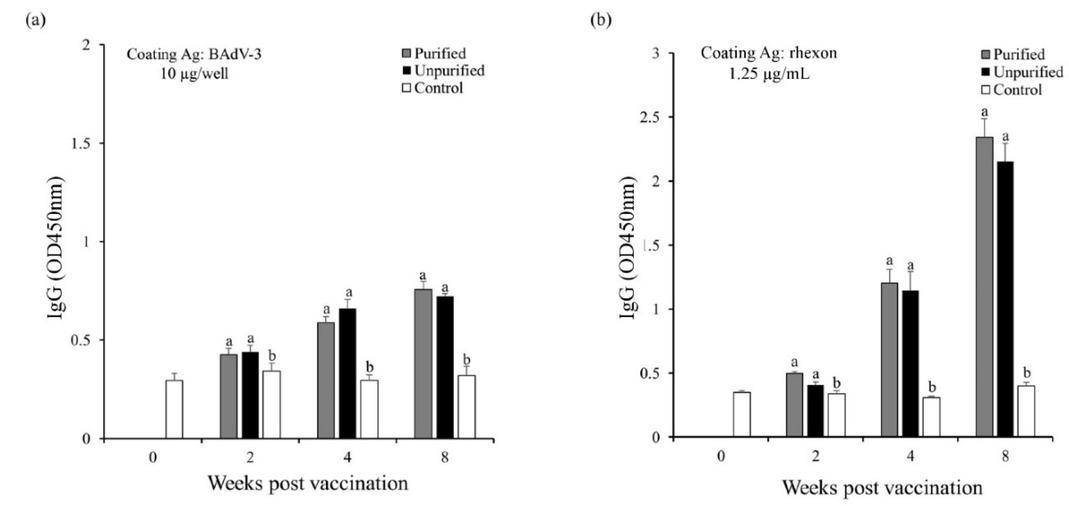
Fig. 4
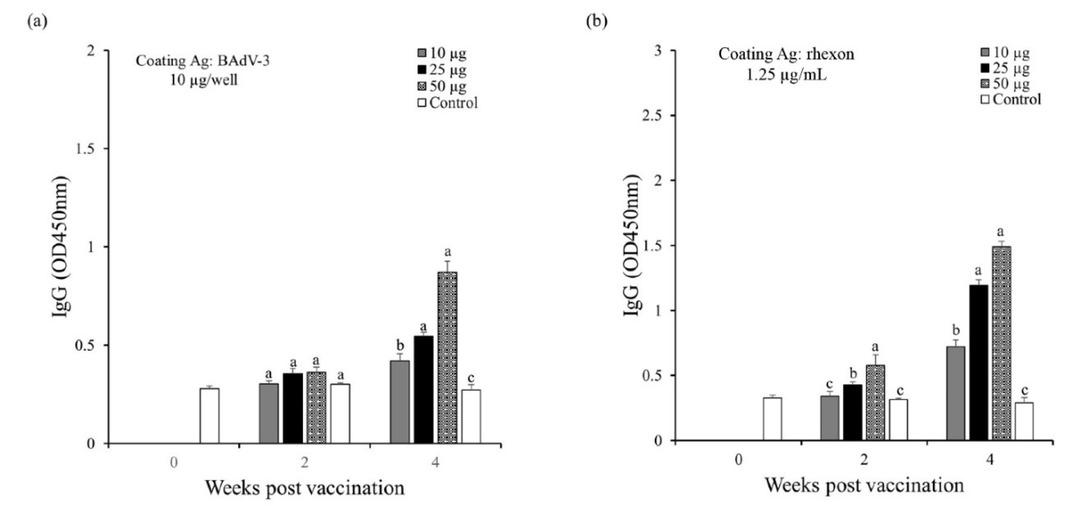
Fig. 5
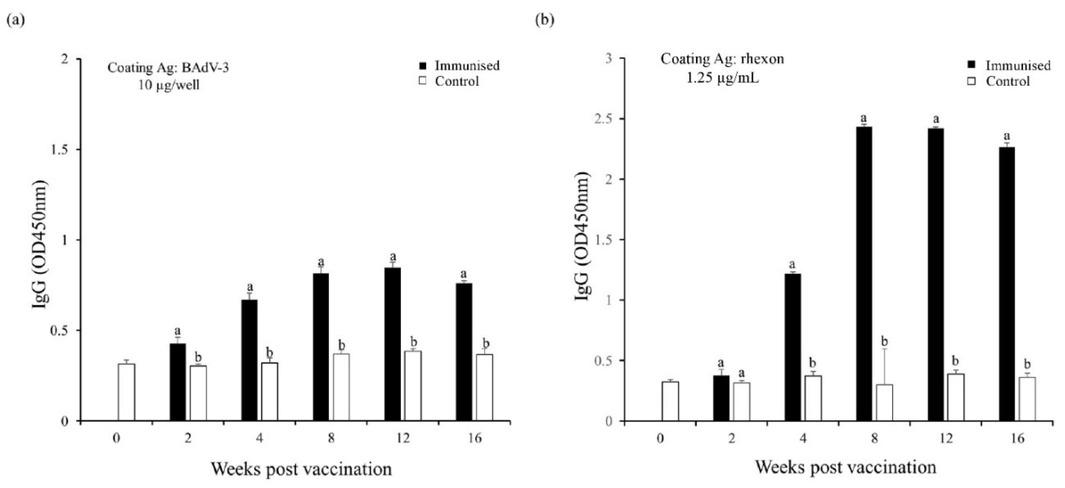
Fig. 6
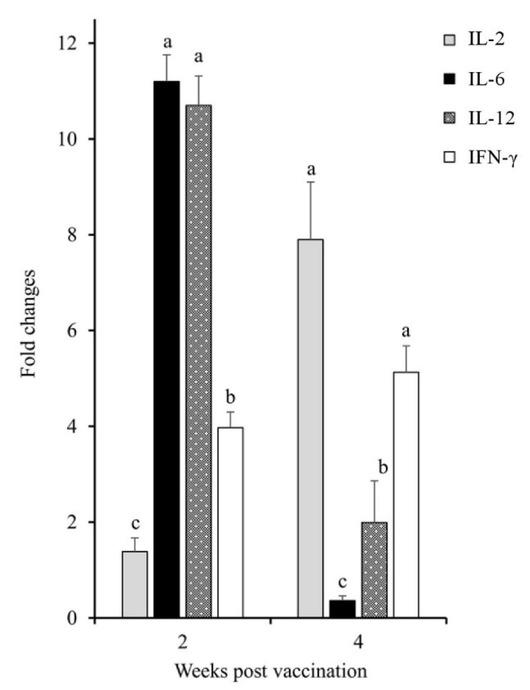
Fig. 7
The sequence of primers used for PCR identification
| Primer name | Position | Sequence (5′-3′) | Size (bp) | Reference |
|---|---|---|---|---|
| BALF | 19235–19256 | GRTGGTCIYTRGATRTRATGGA | 641 | (18) |
| BARF | 19852–19872 | AAGYCTRTCATCYCCDGGCCA | ||
| cBAdVH-F | 1645–1659 | AATGAGCTCCTTCAGAGCACTCTG | 693 | K01264.1 |
| cBAdVH-R | 2319–2337 | ACTGCGGCCGCAGTTTCTATGGTTCAC | GenBank |
Sequences of primers for mouse cytokines and glyceraldehyde 3-phosphate dehydrogenase (GAPDH) in real-time PCR
| Gene | Sequence (5′ ̶ 3′) | GenBank accession no. |
|---|---|---|
| GAPDH | F : TCA ACA GCA ACT CCC ACT CTT CCA | GU214026.1 |
| R : ACC CTG TTG CTG TAG CCG TAT TCA | ||
| IL-2 | F : CCT GAG CAG GGA GAA TTA CA | AH001969.2 |
| R : TCC AGA ACA TGC CGC AGA | ||
| IL-6 | F : GAG GAT ACC ACT CCC AAC AG CC | M20572.1 |
| R : AAG TGC ATC ATC GTT GTT CAT ACA | ||
| IL-12 | F : GAG CAC TCC CCA TTC CTA CT | M86671.1 |
| R : GCA TTC GAC TTC GGT AGA TG | ||
| INF-γ | F : GGC CAT CAG CAA CAT AAG GGT | AY423847.1 |
| R : TCG GTT GTT GAC CTC AAA CTT GGC |
Sequences of primers for goat cytokines and β-actin in real-time PCR
| Gene | Sequence (5′ ̶ 3′) | GenBank accession no. |
|---|---|---|
| β-actin | F : CCT TTT ACA ACG AGC TGC GTG TG | AH00130 |
| R : ACG TAG CAG AGC TTC TCC TTG ATG | ||
| INF-γ | F : TTC AGA GCC AAA TTG TCT CC | M29867 |
| R : CTG GAT CTG CAG ATC ATC CA | ||
| IL-6 | F : TCA TTA AGC GCA TGG TGG ACA AA | NM173923 |
| R : TCA GCT TAT TTT CTG CCA GTG TCT | ||
| IL-12 | F : TTA TTG AGG TCG TGG TAG AAG CTG | U11815 |
| R : GGT CTC AGT TGC AGG TTC TTG G | ||
| IL-21 | F : CAG TGG CCC ATA AGT CAA GC | AB073021 |
| R : TAC ATC TTC TGG AGC TGG CA |