
Table 1
Pathogroups, virulence factors and virulence genes
| Pathogroup | Virulence factor | Full name of virulence gene | Virulence gene |
|---|---|---|---|
| VTEC (EHEC) | toxin | verotoxin 1, 2 | vtx1, vtx2 |
| VTEC (EHEC) | haemolysin | haemolysin | ehxA |
| VTEC (EHEC) | adhesin | STEC autoagglutinating adhesin | saa |
| EAEC | adhesin | aggregative adherence regulation factor | aggR |
| EAEC | adhesin | aggR-activated island C | aaiC |
| EAEC | toxin | heat-stable enterotoxin 1 | EAST1 |
| EPEC | adhesin | bundle forming pili | bfp |
| EPEC | adhesin | intimin | eae |
| EIEC | invasion plasmid antigen H | ipaH | |
| ETEC | toxin | heat-stable enterotoxin I, II | STI (stp, sth), STII |
| ETEC | toxin | heat-labile enterotoxin | ltp |
| ExPEC | cytotoxin | cytotoxic necrotizing factor 1, 2 | cnf1, cnf2 |
Table 2
Occurrence of virulence genes and phylogenetic groups in different animal species
| Poultry | Game | Pig | Cattle | ||
|---|---|---|---|---|---|
| EAST1 | 4 (2A, 1B1, 1F); 3 BM, 1 MSM | 3 (1B1, 1D, 1A); FD, RD,WB | 2 (2A); CS | 4 (3A, 1C); CS | 13 (36.11) |
| eae | 4 (3A, 1E); BM | 1 (B1); RD | -- | 2 (2B1); MM | 7 (19.44) |
| EAST1, STII | -- | 4 (3A, 1B1); DE, 2 FD, M | 1 (B1); CS | -- | 5 (13.89) |
| EAST1, eae | 1 (B1); BM | -- | -- | -- | 1 (2.78) |
| EAST1, ehxA | -- | 1 (B1); WB | -- | -- | 1 (2.78) |
| eae, ehxA | -- | -- | 1 (D); CS | -- | 1 (2.78) |
| cnf1, cnf2 | 1 (F); BM | 1 (B2); DE | 1 (B1); CS | 1 (B1); MP | 4 (11.11) |
| cnf1 | -- | -- | 1 (B1); CS | 1 (B2); FM | 2 (5.56) |
| vtx1 | -- | 1 (E); RD | -- | -- | 1 (2.78) |
| vtx2 | -- | -- | 1 (C); CS | -- | 1 (2.78) |
| n2 (%) | 10 (27.78) | 11 (36.56) | 7 (19.44) | 8 (22.22) | 36 |
[i] A, B1, B2, C, D, E, F – phylogenetic group; BM – broiler meat; MSM – mechanically separated meat; DE – fresh red deer meat; FD – fresh fallow deer meat; RD – fresh roe deer meat; WB – fresh wild boar meat; M – fresh moufflon meat ; CS – carcass swab; MM – minced meat; MP – meat preparation; FM – fresh meat
Table 3
The frequency of virulent genes compared to the origin of the sample
| Strain origin | Number of strains (%) | Virulence gene presence | Number of virulence genes in strains | ||
|---|---|---|---|---|---|
| Negative (%) | Positive (%) | One (%) | Two (%) | ||
| Poultry | 27 (27) | 17 (62.96) | 10 (37.04) | 8 (80) | 2 (20) |
| Game | 14 (14) | 3 (21.43) | 11 (78.57) | 5 (45.45) | 6 (54.55) |
| Pig | 30 (30) | 23 (76.67) | 7 (23.33) | 4 (57.14) | 3 (42.86) |
| Cattle | 29 (29) | 21 (72.41) | 8 (27.59) | 7 (87.5) | 1 (12.5) |
| Total (%) | 100 (100) | 64 (64) | 36 (36) | 24 (24) | 12 (12) |
| P | 0.004 | 0.003 | |||
Table 4
Distribution of E. coli phylogenetic groups in different animal species
| A | B1 | B2 | C | D | E | F | ||
|---|---|---|---|---|---|---|---|---|
| Poultry | 11 | 6 | 0 | 0 | 2 | 2 | 6 | 27 |
| Game | 4 | 5 | 2 | 0 | 2 | 1 | 0 | 14 |
| Pig | 13 | 12 | 0 | 1 | 3 | 1 | 0 | 30 |
| Cattle | 10 | 13 | 2 | 2 | 2 | 0 | 0 | 29 |
| Total (%) | 38 (38) | 36 (36) | 4 (4) | 3 (3) | 9 (9) | 4 (4) | 6 (6) | 100 |
| P | 0.039 |
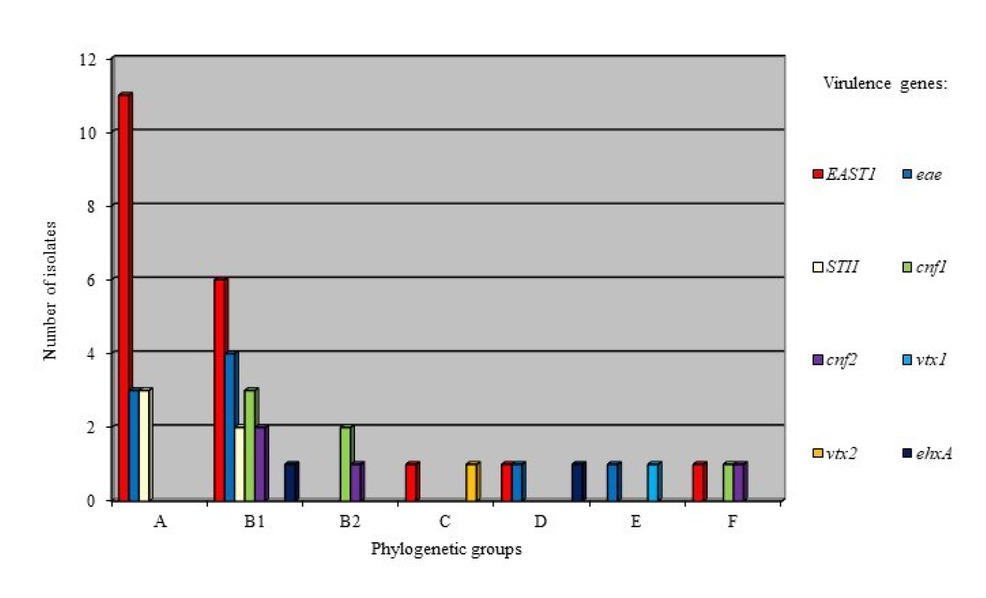
Fig. 1
Distribution of virulence genes within phylogenetic groups