
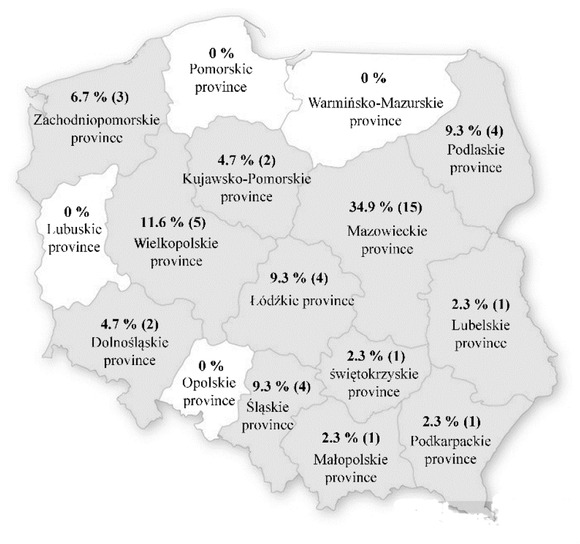
Fig. 1
Percentage share of alpaca farms participating in the study by Polish province. The number of farms per province in Poland is given in brackets
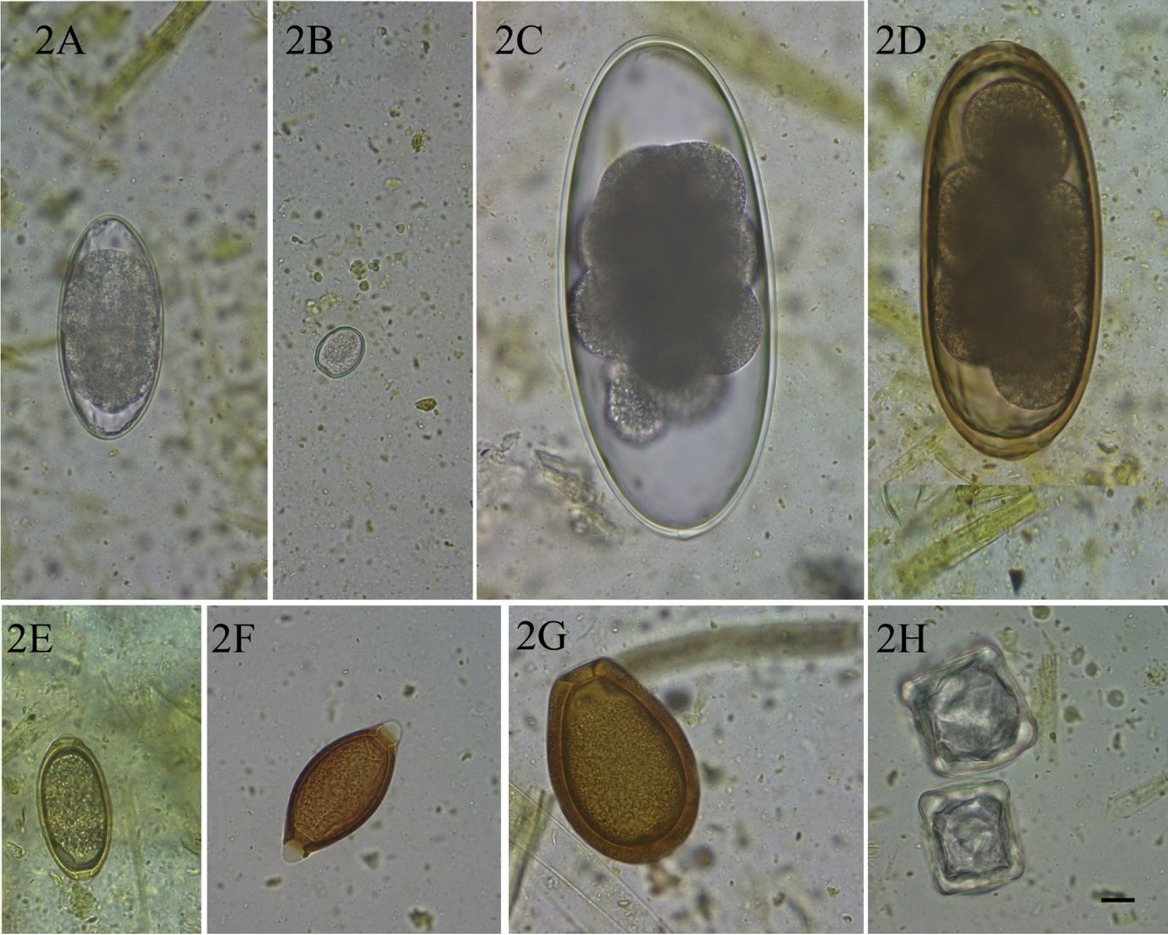
Fig. 2
Parasitic eggs and oocysts found in faeces of alpacas with the use of flotation techniques (400 × magnification, bar = 12 μm) 2A – an egg of the Trichostrongylidae family; 2B – an oocyst of the Eimeria genus; 2C – an egg of the Nematodirus genus; 2D – an egg of Nematodirus battus; 2E – an egg of the Aonchotheca genus; 2F – an egg of the Trichuris genus; 2G – an oocyst of Eimeria macusaniensis; 2H – eggs of the Moniezia genus
Table 1
Coprological findings in alpacas (n = 248) after applying a modified Willis method (WM), comparison of the results obtained using the Willis and a modified Stoll methods (SM) (n = 59) and statistical comparison with the McNemar test (P)
| Aonchotheca sp. | Eimeria spp. | E. macusaniensis | Moniezia sp. | Nematodirus sp. | N. battus | Trichostrongylidae | Trichuris sp. | ||
|---|---|---|---|---|---|---|---|---|---|
| Prevalence (%) | WM n = 248 | 14.1 | 41.9 | 4 | 2 | 33.9 | 15.7 | 46 | 11.7 |
| WM n = 59 | 16.9 | 40.7 | 1.7 | 1.7 | 40.7 | 15.3 | 45.8 | 13.6 | |
| SM n = 59 | 8.5 | 62.7 | 3.4 | ˗ | 20.3 | 8.5 | 28.8 | 8.5 | |
| P | 0.063 | 0.004* | 1.000 | 1.000 | 0.000* | 0.125 | 0.006* | 0.219 | |
| Eggs/oocysts per 3 g (WM) | Average n = 248 | 3.6 | 221.4 | 1,236.5 | 561.6 | 15.9 | 6.7 | 163.4 | 6.3 |
| Average n = 59 | 3.8 | 110 | 2 | 3 | 23.2 | 6 | 38.3 | 6.4 | |
| Median n = 248 | 2 | 11 | 2 | 321 | 8.5 | 2 | 8 | 2 | |
| Median n = 59 | 2 | 6.5 | 2 | 3 | 8.5 | 3 | 3.5 | 3 | |
| Range n = 248 | 1–19 | 1–6,270 | 1–12,187 | 3–1,496 | 1–160 | 1–81 | 1–10,532 | 1–31 | |
| Range n = 59 | 1–12 | 1–1,322 | 2–2 | 3–3 | 1–160 | 1–22 | 1–584 | 1–31 | |
| Eggs/oocysts per g (SM) | Average n = 59 | 8 | 129.2 | 5 | ˗ | 23.3 | 8 | 31.2 | 5 |
| Median n = 59 | 10 | 20 | 5 | ˗ | 10 | 10 | 5 | 5 | |
| Range n = 59 | 5–10 | 5–1,250 | 5–5 | ˗ | 5–115 | 5–10 | 5–345 | 5–5 | |