
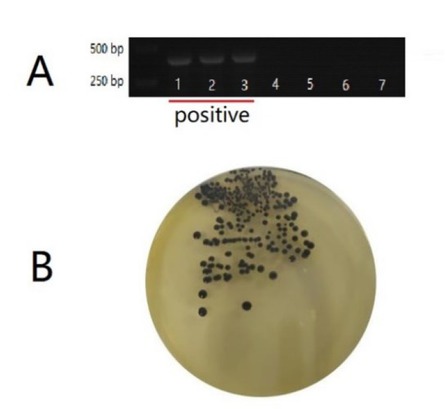
Fig. 1
Identification of Staphylococcus aureus isolated from milk samples from Holstein cows. A − specific PCR and electrophoresis map of the S. aureus protein A (spa) gene (323 bp); B − morphology of S. aureus colony on Baird-Parker agar
Table 1
Characteristics of the seven experimental and control dairy cows
| Animals | Group | Lactation (d) | SCC (×104/mL) | Milk (kg/day) yield | Milk morphology | Bacterium |
|---|---|---|---|---|---|---|
| NM002 | NM | 288 | 4.5 | 23 | normal | − |
| NM003 | NM | 256 | 5.1 | 19 | normal | − |
| NM013 | NM | 241 | 3.9 | 18 | normal | − |
| NM182 | NM | 198 | 4.4 | 20 | normal | − |
| M008 | M | 267 | 623 | 5.0 | thin, clots | Staphylococcus aureus |
| M010 | M | 213 | 456 | 4.6 | flakes | Staphylococcus aureus |
| M021 | M | 186 | 503 | 3.0 | clots | Staphylococcus aureus |
Table 2
RNA-seq data for the seven experimental and control dairy cows
| Samples | Total clean reads (bp) | Clean reads Q20 (%) | Clean reads Q30 (%) | Total mapping ratio (%) |
|---|---|---|---|---|
| NM002 | 47,493,260 | 97.78 | 91.07 | 82.86 |
| NM003 | 47,472,822 | 97.83 | 91.31 | 82.25 |
| NM013 | 47,646,180 | 97.87 | 91.34 | 83.81 |
| NM182 | 47,588,374 | 97.84 | 91.22 | 84.97 |
| M008 | 47,642,372 | 97.92 | 91.64 | 79.93 |
| M010 | 47,710,376 | 97.96 | 91.82 | 76.37 |
| M021 | 47,664,652 | 97.92 | 91.75 | 77.52 |
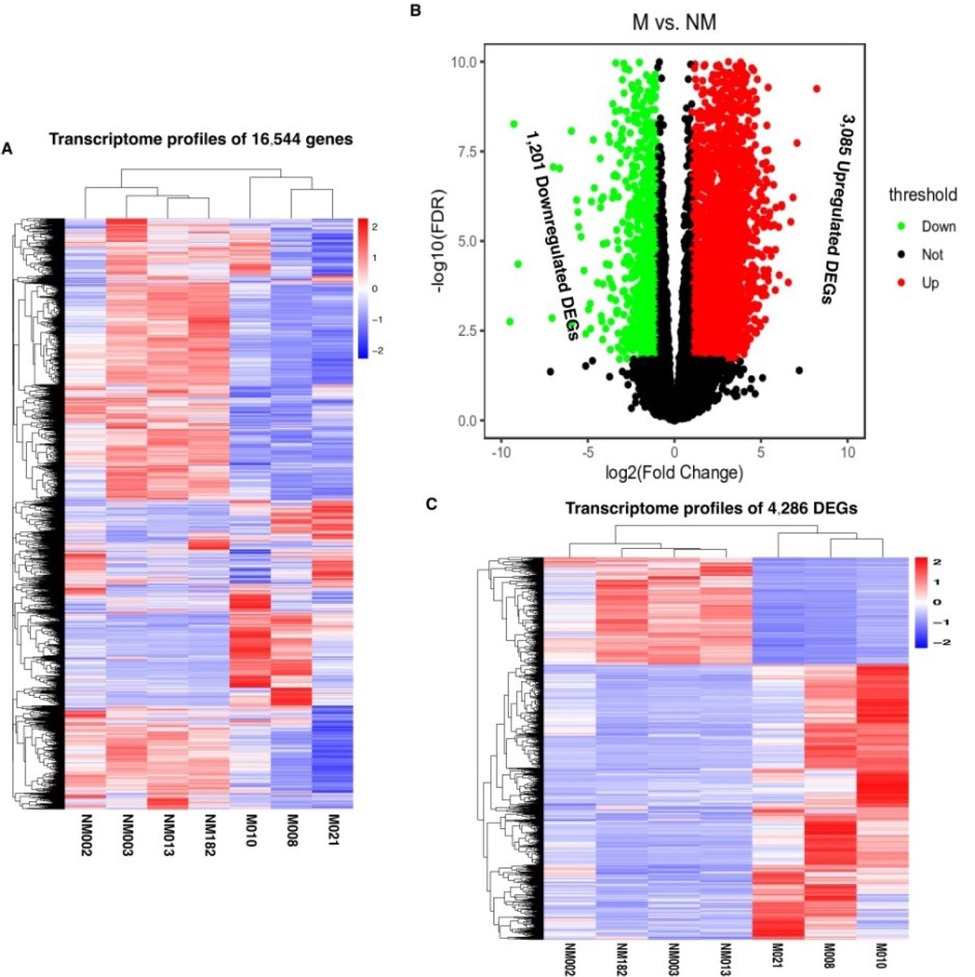
Fig. 2
Transcriptome profiles of 16,544 genes identified by mRNA in peripheral blood leukocytes (PBL) from all the samples (A); volcano plot of global differentially expressed genes (DEGs) in PBL between the mastitic (M) and non-mastitic (NM) groups (B); and transcriptome profiles of 4,286 DEGs between the M and NM groups (C)
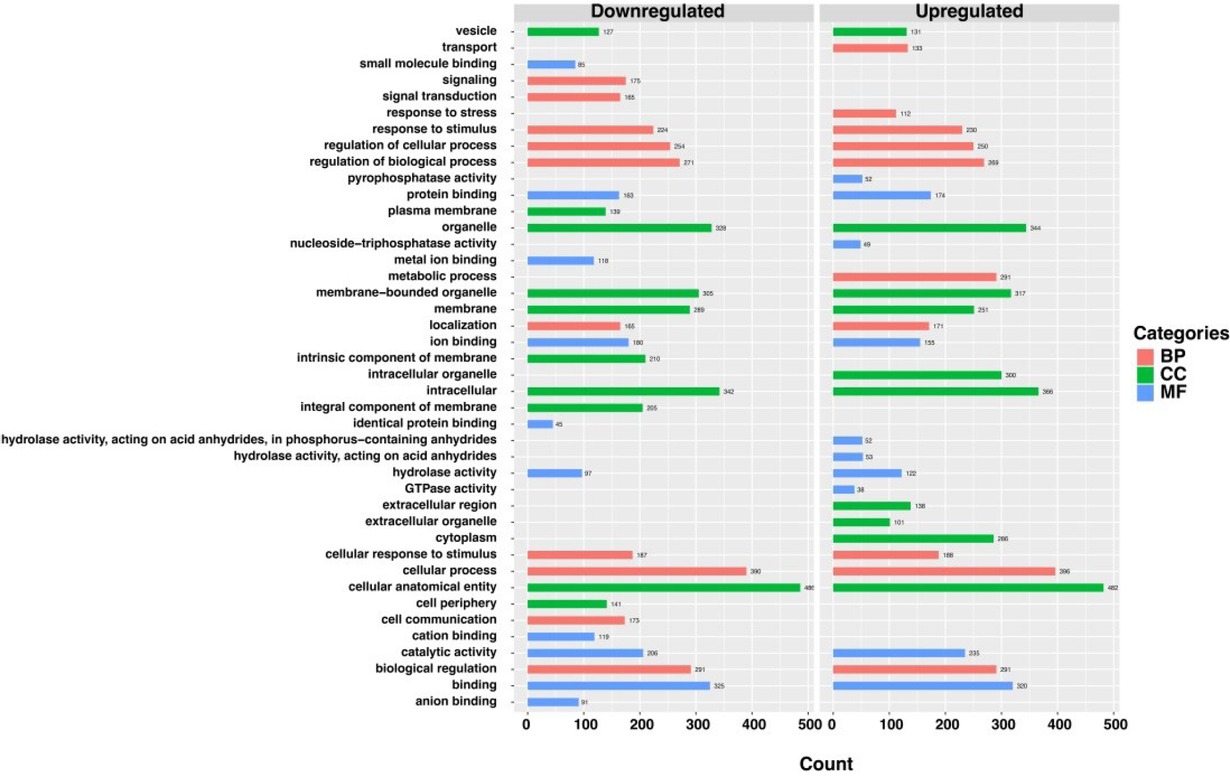
Fig. 3
The top 30 up- and downregulated differentially expressed genes analysed by Gene Ontology BP – biological processes; CC – cellular components; MF – molecular functions
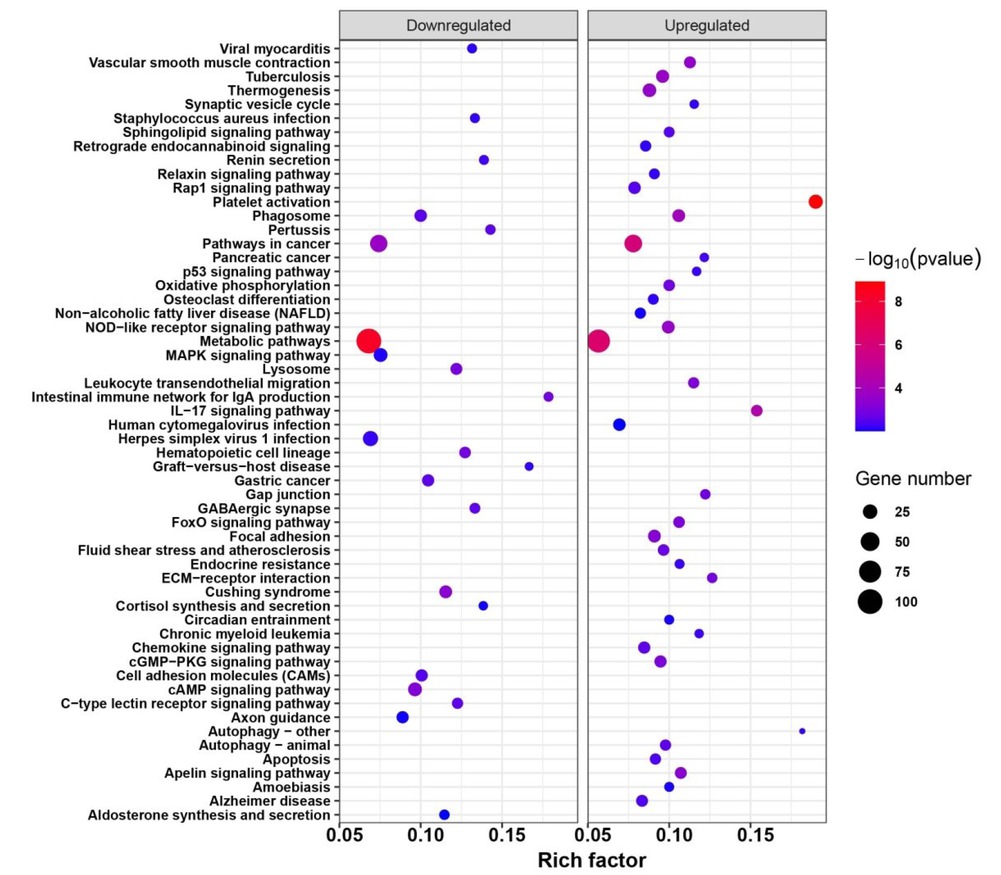
Fig. 4
Pathways significantly enriched with the upregulated and downregulated DEGs, as observed by KEGG enrichment
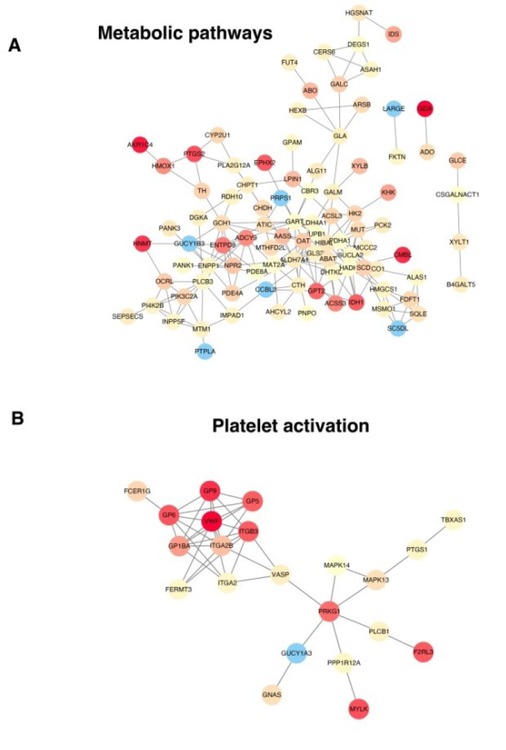
Fig. 5
DEGs downregulated in the metabolic pathway (A) and upregulated in platelet activation (B) observed by protein–protein interaction (PPI) analysis. The different colours represent degrees of connectivity
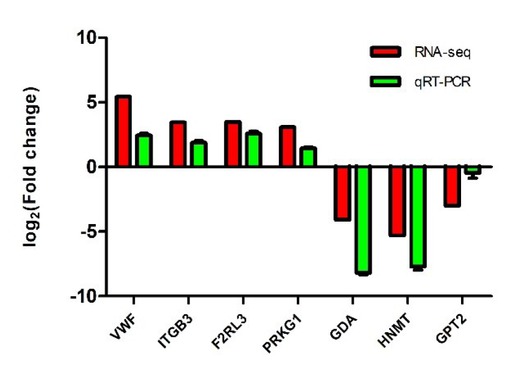
Fig. 6
Concordance of gene expression profiles obtained by RNA-seq and qRT-PCR methods for four upregulated genes (VWF, ITGB3, F2RL3, and PRKG1) and three downregulated genes (GDA, HNMT, and GPT2). The β-actin gene was used as an internal reference control gene