
Fig. 1
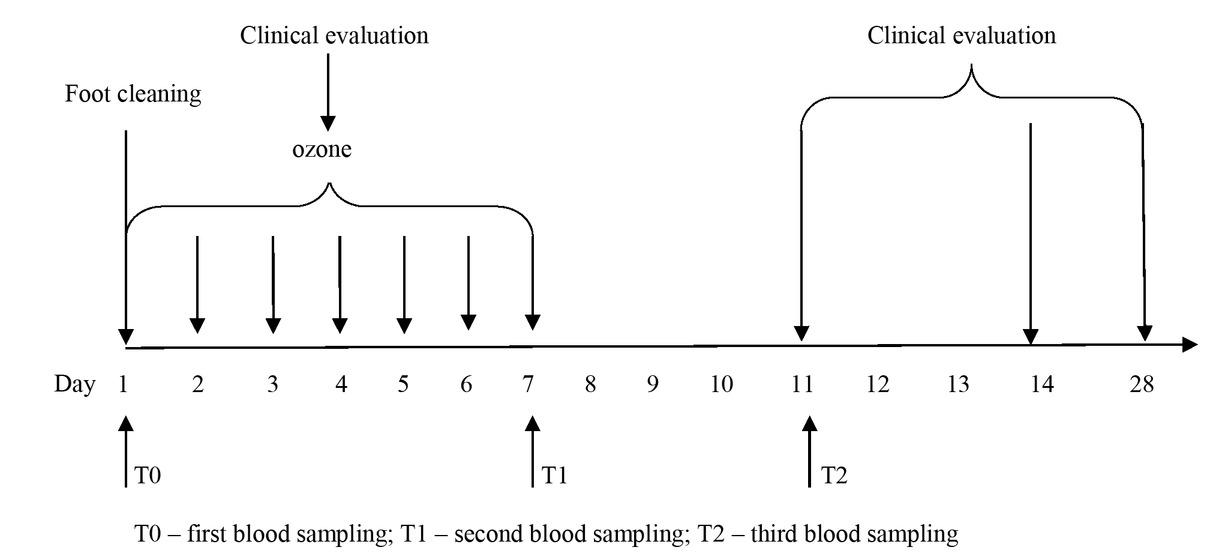
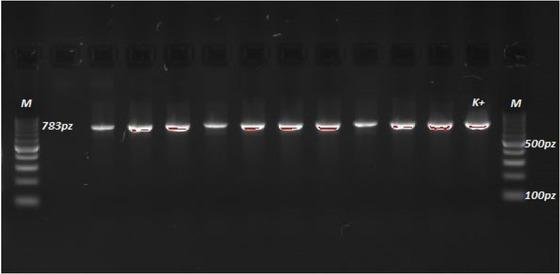
Fig 2
Antioxidant capacity, antioxidant/ oxidant balance, oxidative status
| Measurement | ABTS (μmolTe/mL) | RP (μmolTe/mL) | MDA (nmol/mL) | AOB by ABTS (% of T0) | AOB by RP (% of T0) |
|---|---|---|---|---|---|
| Control | 1.22 ± 0.01 | 0.14 ± 0.02 | 6.2 ± 0.18 | – | – |
| T0 | 1.16 ± 0.04 | 0.1 ± 0.02 | 7.84 ± 0.18 | – | – |
| T1 | 1.23 ± 0.03* | 0.14 ± 0.01* | 6.45 ± 0.39 | 129.93 ± 19.1 | 169.2 ± 22.0 |
| T2 | 1.2 ± 0.07 | 0.13 ± 0.01* | 7.4 ± 0.2 | 110.00 ± 16.2 | 130.77 ± 17.0 |
Changes in plasma concentration of selected acute-phase proteins in the course of local ozone treatment in sheep (n = 10)
| Protein | Control | Day 0 | Day 7 | Day 11 |
|---|---|---|---|---|
| Fibrinogen (g/L) | 4.10 ± 1.00 | 4.97 ± 0.51 | 4.67 ± 0.61* | 5.06 ± 0.61* |
| Haptoglobin (g/L) | 0.22 ± 0.20 | 0.61 ± 0.13 | 0.35 ± 0.11* | 0.67 ± 0.16* |