
Fig. 1
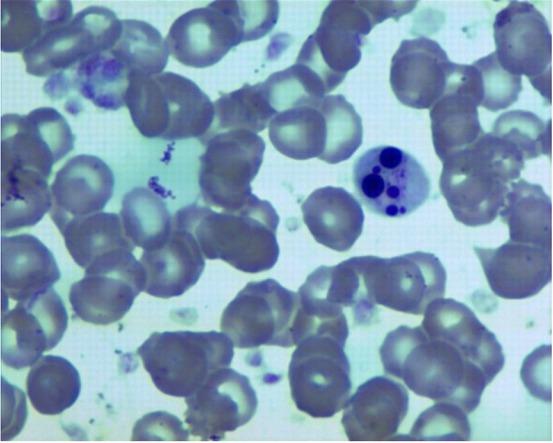
Fig. 2
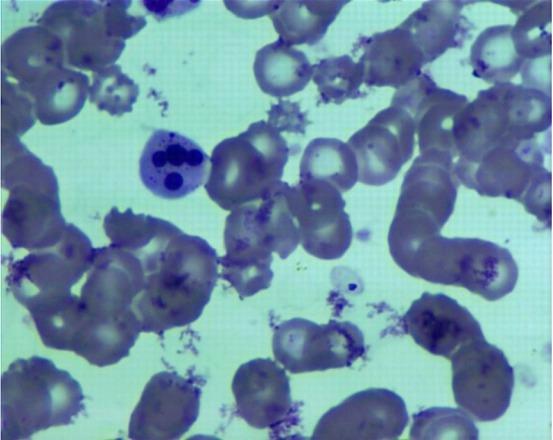
Fig. 3
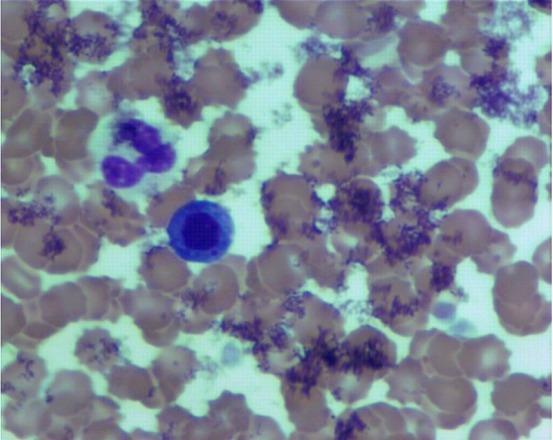
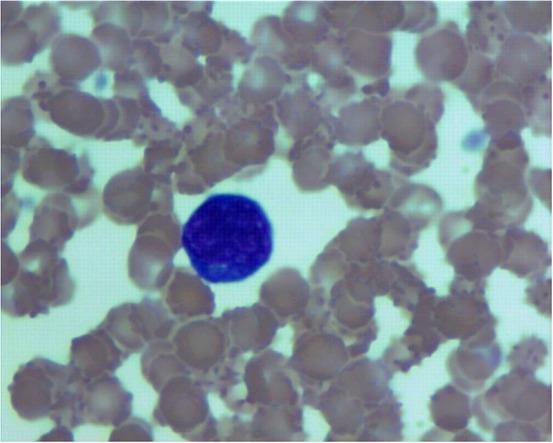
Fig. 4
The average number of cells from the granulocytic cell line per 1,000 porcine bone marrow cells (mean ±SD) on the 28th day of the experiment
| Cell type | Control group | Low dose group | High dose group |
| Myeloblasts | 2.680 ± 0.576 statistically significant difference between control and low dose group (P ≤ 0.05) statistically significant difference between control and high dose group (P ≤ 0.05) | 1.160 ± 0.512 statistically significant difference between control and low dose group (P ≤ 0.05) | 1.080 ± 0.104 statistically significant difference between control and high dose group (P ≤ 0.05) |
| Promyelocytes | 2.100 ± 0.68 statistically significant difference between control and low dose group (P ≤ 0.05) statistically significant difference between control and high dose group (P ≤ 0.05) | 1.460 ± 0.728 statistically significant difference between control and low dose group (P ≤ 0.05) | 1.320 ± 0.504 statistically significant difference between control and high dose group (P ≤ 0.05) |
| Myelocyte | 3.540 ± 0.088 statistically significant difference between control and low dose group (P ≤ 0.05) | 2.180 ± 0.896 statistically significant difference between control and low dose group (P ≤ 0.05) statistically significant difference between low dose and high dose group (P ≤ 0.05) | 3.300 ± 1.600 statistically significant difference between low dose and high dose group (P ≤ 0.05) |
| Metamyelocyte | 6.540 ± 1.208 statistically significant difference between control and low dose group (P ≤ 0.05) statistically significant difference between control and high dose group (P ≤ 0.05) | 3.840 ± 1.568 statistically significant difference between control and low dose group (P ≤ 0.05) statistically significant difference between low dose and high dose group (P ≤ 0.05) | 3.120 ± 1.824 statistically significant difference between control and high dose group (P ≤ 0.05) statistically significant difference between low dose and high dose group (P ≤ 0.05) |
| Band neutrophils | 15.940 ± 2.872 statistically significant difference between control and low dose group (P ≤ 0.05) statistically significant difference between control and high dose group (P ≤ 0.05) | 8.620 ± 1.304 statistically significant difference between control and low dose group (P ≤ 0.05) statistically significant difference between low dose and high dose group (P ≤ 0.05) | 6.520 ± 1.944 statistically significant difference between control and high dose group (P ≤ 0.05) statistically significant difference between low dose and high dose group (P ≤ 0.05) |
| Neutrophilic granulocytes | 12.460 ± 2.192 statistically significant difference between control and high dose group (P ≤ 0.05) | 10.920 ± 1.104 statistically significant difference between low dose and high dose group (P ≤ 0.05) | 18.680 ± 9.016 statistically significant difference between control and high dose group (P ≤ 0.05) statistically significant difference between low dose and high dose group (P ≤ 0.05) |
| Eosinophilic myelocytes | 1.740 ± 0.456 | 1.180 ± 0.776 | 0.820 ± 0.384 |
| Eosinophilic metamyelocytes | 2.220 ± 0.464 | 2.320 ± 1.464 | 0.840 ± 0.568 |
| Band eosinophils | 2.960 ± 1.952 statistically significant difference between control and high dose group (P ≤ 0.05) | 3.300 ± 2.200 statistically significant difference between low dose and high dose group (P ≤ 0.05) | 1.420 ± 1.112 statistically significant difference between control and high dose group (P ≤ 0.05) statistically significant difference between low dose and high dose group (P ≤ 0.05) |
| Eosinophilic granulocytes | 2.000 ± 1.480 statistically significant difference between control and low dose group (P ≤ 0.05) | 2.460 ± 1.632 statistically significant difference between control and low dose group (P ≤ 0.05) statistically significant difference between low dose and high dose group (P ≤ 0.05) | 2.120 ± 1.096 statistically significant difference between control and low dose group (P ≤ 0.05) statistically significant difference between low dose and high dose group (P ≤ 0.05) |
| Basophilic myelocytes | 0.020 ± 0.032 | 0.000 | 0.000 |
| Basophilic metamyelocytes | 0.080 ± 0.064 | 0.000 | 0.040 ± 0.048 |
| Band basophiles | 0.260 ± 0.192 statistically significant difference between control and low dose group (P ≤ 0.05) statistically significant difference between control and high dose group (P ≤ 0.05) | 0.060 ± 0.072 statistically significant difference between control and low dose group (P ≤ 0.05) statistically significant difference between low dose and high dose group (P ≤ 0.05) | 1.420 ± 1.112 statistically significant difference between control and high dose group (P ≤ 0.05) statistically significant difference between low dose and high dose group (P ≤ 0.05) |
| Basophilic granulocytes | 0.320 ± 0.184 statistically significant difference between control and low dose group (P ≤ 0.05) statistically significant difference between control and high dose group (P ≤ 0.05) | 0.040 ± 0.064 statistically significant difference between control and low dose group (P ≤ 0.05) statistically significant difference between low dose and high dose group (P ≤ 0.05) | 0.080 ± 0.064 statistically significant difference between control and high dose group (P ≤ 0.05) statistically significant difference between low dose and high dose group (P ≤ 0.05) |
| Hypersegmented granulocytes | 0.000 statistically significant difference between control and high dose group (P ≤ 0.05) | 0.000 statistically significant difference between low dose and high dose group (P ≤ 0.05) | 0.500 ± 0.640 statistically significant difference between control and high dose group (P ≤ 0.05) statistically significant difference between low dose and high dose group (P ≤ 0.05) |
| Total granulocytes | 52.860 ± 2.528 statistically significant difference between control and low dose group (P ≤ 0.05) statistically significant difference between control and high dose group (P ≤ 0.05) | 37.520 ± 8.784 statistically significant difference between control and low dose group (P ≤ 0.05) | 44.680 ± 3.144 statistically significant difference between control and high dose group (P ≤ 0.05) |
The average number of cells from the granulocytic cell line per 1,000 porcine bone marrow cells (mean ± SD) before acrylamide administration
| Cell type | Control group | Low dose group | High dose group |
|---|---|---|---|
| Myeloblasts | 2.720 ± 0.504 | 2.980 ± 0.336 | 2.820 ± 0.344 |
| Promyelocytes | 2.080 ± 0.656 | 2.160 ± 0.672 | 2.240 ± 0.192 |
| Myelocyte | 3.600 ± 0.120 | 3.520 ± 0.144 | 3.200 ± 0.240 |
| Metamyelocyte | 6.500 ± 1.000 | 6.360 ± 0.568 | 6.360 ± 0.888 |
| Band neutrophils | 15.180 ± 2.584 | 13.620 ± 1.064 | 14.520 ± 1.576 |
| Neutrophilic granulocytes | 12.400 ± 2.200 | 13.380 ± 2.224 | 12.820 ± 2.296 |
| Eosinophilic myelocytes | 1.740 ± 0.416 | 1.320 ± 0.384 | 1.620 ± 0.264 |
| Eosinophilic metamyelocytes | 1.960 ± 0.552 | 2.260 ± 0.568 | 2.200 ± 0.280 |
| Band eosinophils | 2.640 ± 1.728 | 2.820 ± 1.624 | 2.780 ± 1.176 |
| Eosinophilic granulocytes | 1.300 ± 0.720 | 1.560 ± 1.272 | 1.960 ± 1.632 |
| Basophilic myelocytes | 0.000 | 0.000 | 0.000 |
| Basophilic metamyelocytes | 0.060 ± 0.048 | 0.020 ± 0.032 | 0.080 ± 0.064 |
| Band basophiles | 0.280 ± 0.136 | 0.320 ± 0.184 | 0.375 ± 0.225 |
| Basophilic granulocytes | 0.360 ± 0.192 | 0.280 ± 0.136 | 0.300 ± 0.160 |
| Hypersegmented granulocytes | 0.000 | 0.000 | 0.000 |
| Total granulocytes | 50.820 ± 1.184 | 50.600 ± 2.76 | 51.220 ± 0.896 |