
Fig. 1
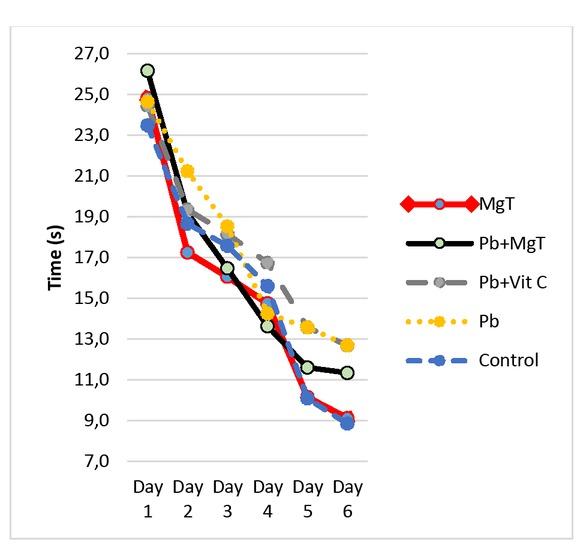
Fig. 2
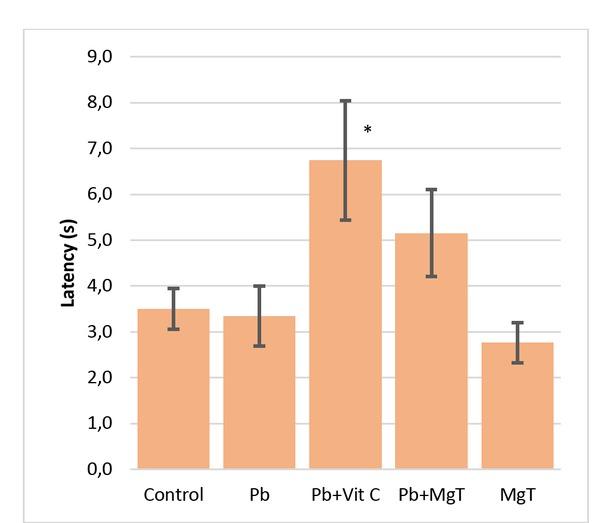
Fig. 3
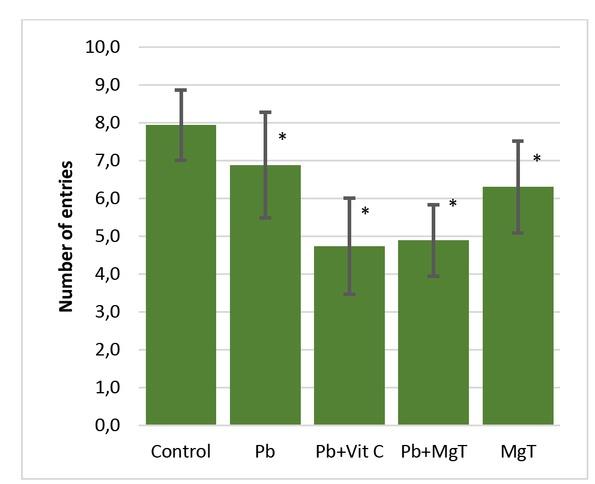
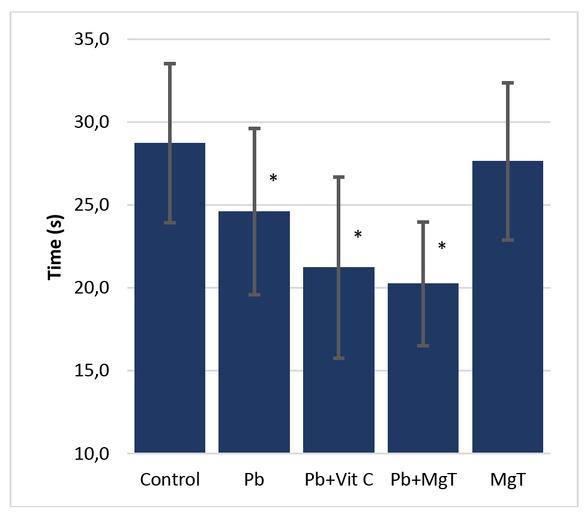
Fig. 4
Catalase activity level (CAT IU/ mg protein) in Swiss albino mouse liver, kidney, pancreas and brain tissue after administration of lead acetate
| Group | ||||||
|---|---|---|---|---|---|---|
| Control (n = 10) | Pb (n = 10) | Pb+Vit C (n = 10) | Pb+MgT (n = 10) | MgT (n = 10) | ||
| Organ | Liver | 222.5 ± 45.61 | 501.8 ± 70.10* | 229.3 ± 54.13 | 250.2 ± 81.52 | 204.9 ± 50.02 |
| Pancreas | 18.5 ± 8.98 | 51.2 ± 16.12* | 31.3 ± 17.54 | 26.3 ± 13.22 | 37.3 ± 16.75 | |
| Kidney | 97.3 ± 34.56 | 269.1 ± 55.89** | 124.6 ± 43.54 | 105.3 ± 52.23 | 130.5 ± 42.54 | |
| Brain | 3.9 ± 2.86 | 8.1 ± 3.05* | 9.3 ± 3.67* | 8.9 ± 3.11* | 4.4 ± 2.26 | |
Lead concentration (mg/kg) in the brains of mice treated with different combinations of chemicals
| Group | |||||
|---|---|---|---|---|---|
| Parameter | Control (n = 10) | Pb (n = 10) | Pb+Vit C (n = 10) | Pb+MgT (n = 10) | MgT (n = 10) |
| Pb | 0.35 ± 0.001 | 1.58 ± 0.009* | 1.67 ± 0.039* | 0.94 ± 0.035* | 0.41 ± 0.025 |
Average values of body weight and food and water intake during the 40 days of treatment
| Group | Initial average body weight (g) | Terminal average body weight (g) | Average daily food intake (g) | Average daily water intake (mL) |
|---|---|---|---|---|
| Control | 35.24 | 35.05 | 6.89 | 6.21 |
| Pb | 33.34 | 36.97 | 7.01 | 6.07 |
| Pb+Vit C | 32.24 | 35.69 | 6.51 | 6.11 |
| Pb+MgT | 33.52 | 35.91 | 6.78 | 6.15 |
| MgT | 34.04 | 37.12 | 7.12 | 6.52 |
Average organs weights in grams (liver, kidney, pancreas and brain) of mice (Mus musculus Swiss albino) after dissection
| Group | ||||||
|---|---|---|---|---|---|---|
| Control (n = 10) | Pb (n = 10) | Pb+Vit C (n = 10) | Pb+MgT (n = 10) | MgT (n = 10) | ||
| Organ | Liver | 1.02 ± 0.29 | 0.89 ± 0.08 | 0.93 ± 0.16 | 0.92 ± 0.49 | 1.11 ± 0.26 |
| Pancreas | 0.20 ± 0.10 | 0.17 ± 0.07 | 0.23 ± 0.07 | 0.15 ± 0.10 | 0.17 ± 0.05 | |
| Kidney | 0.38 ± 0.16 | 0.50 ± 0.08 | 0.56 ± 0.12 | 0.55 ± 0.10 | 0.43 ± 0.10 | |
| Brain | 0.35 ± 0.03 | 0.36 ± 0.05 | 0.35 ± 0.02 | 0.36 ± 0.02 | 0.36 ± 0.04 | |