
Fig. 1
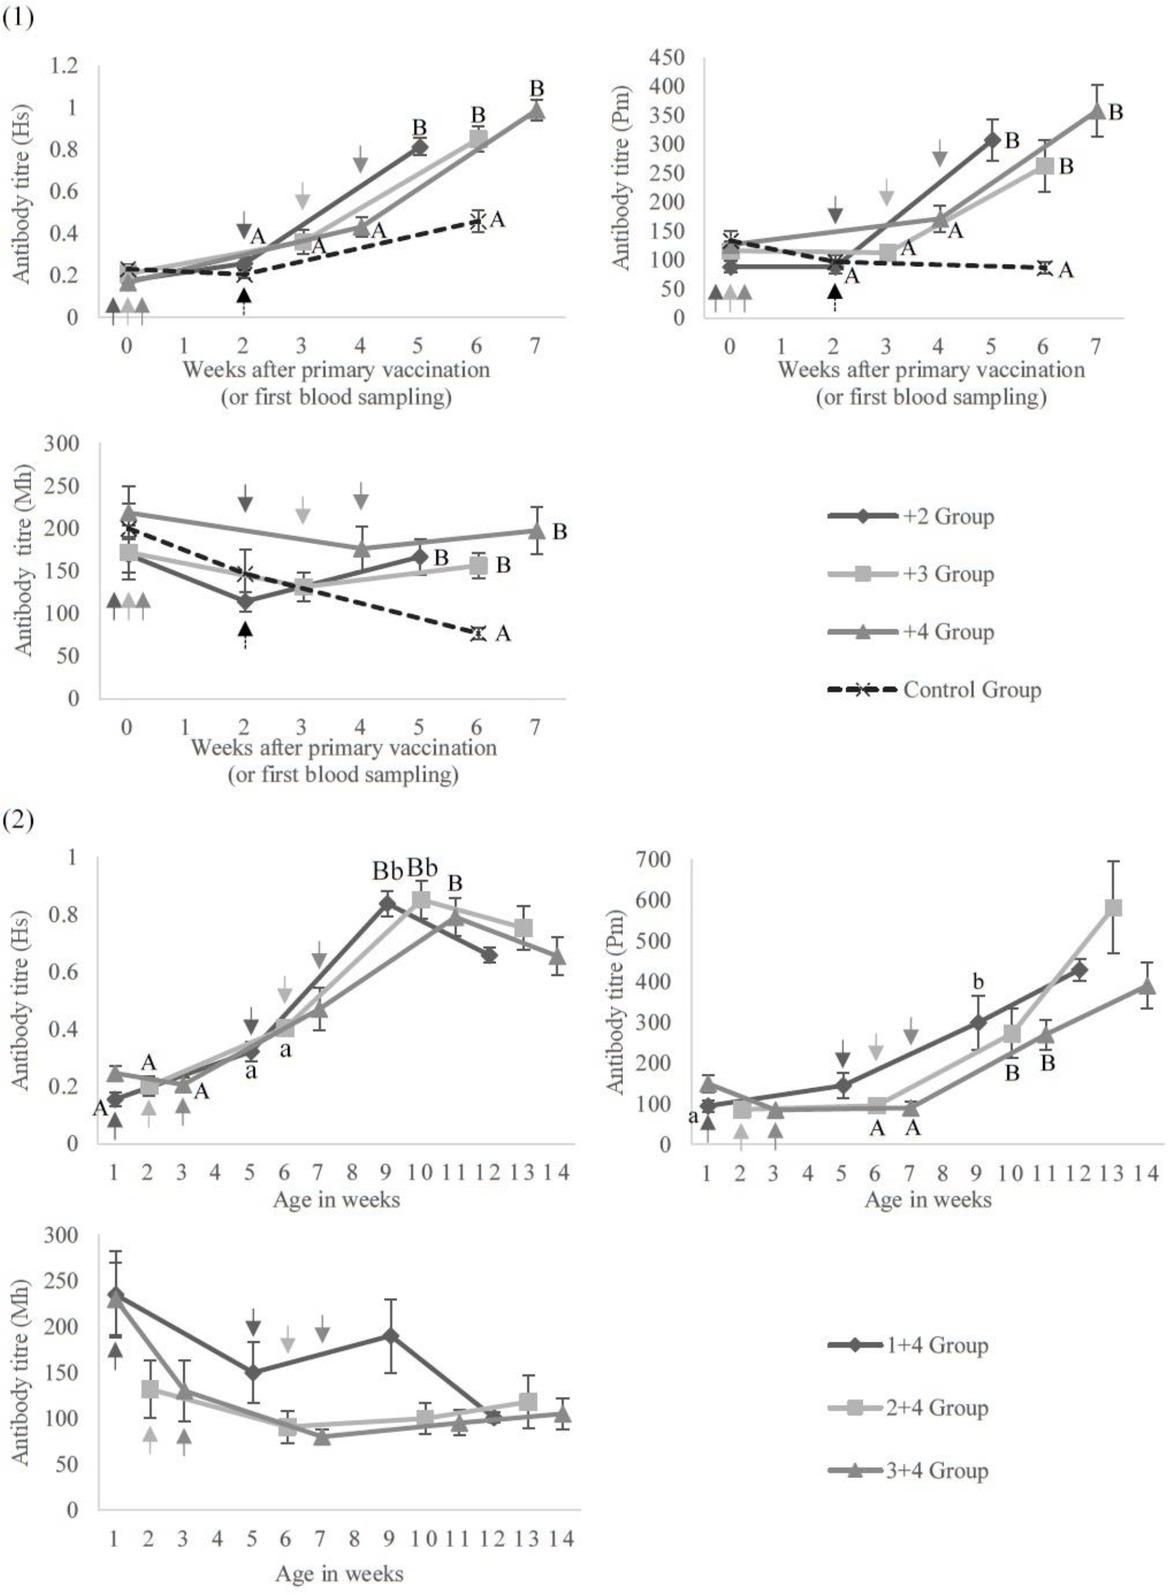
Fig. 2
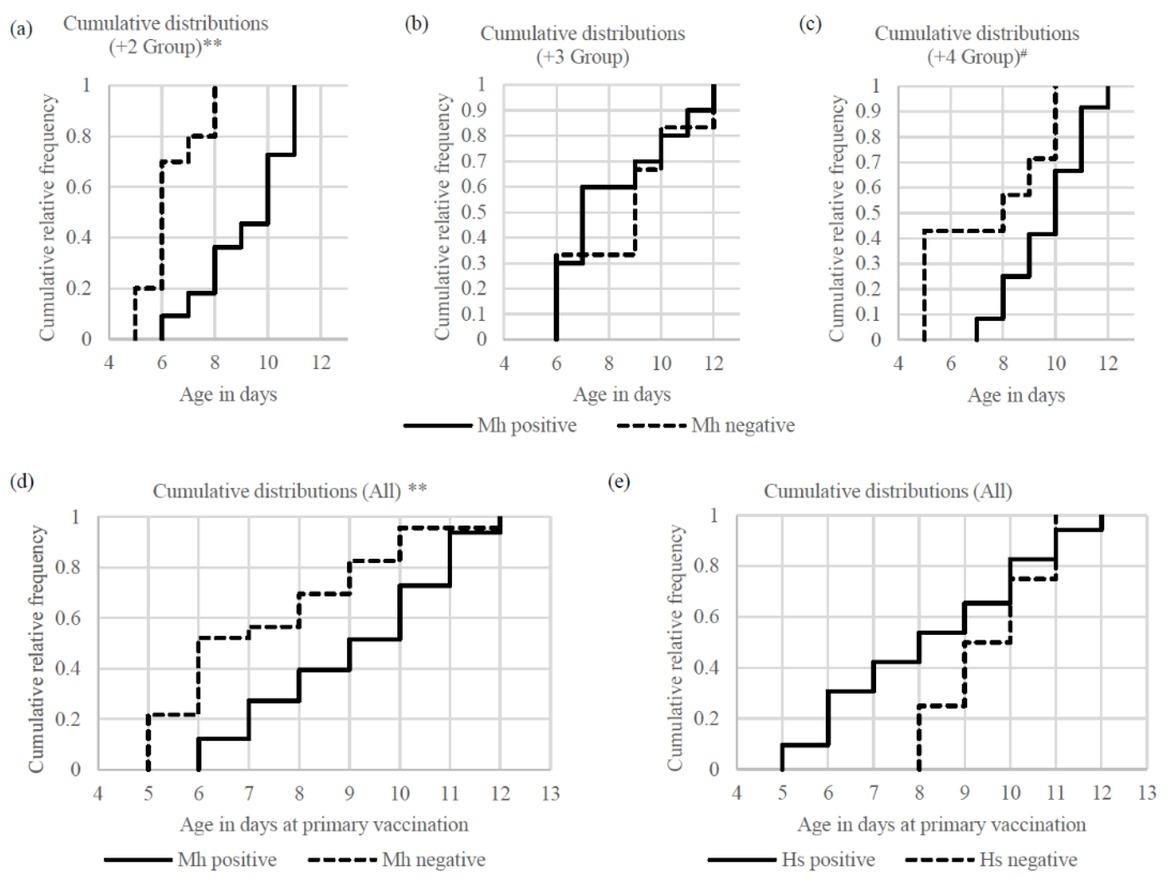
Fig. 3
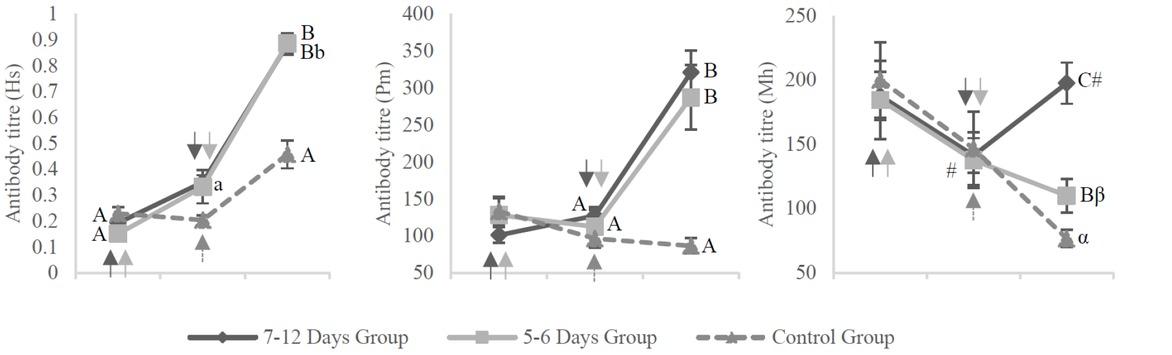
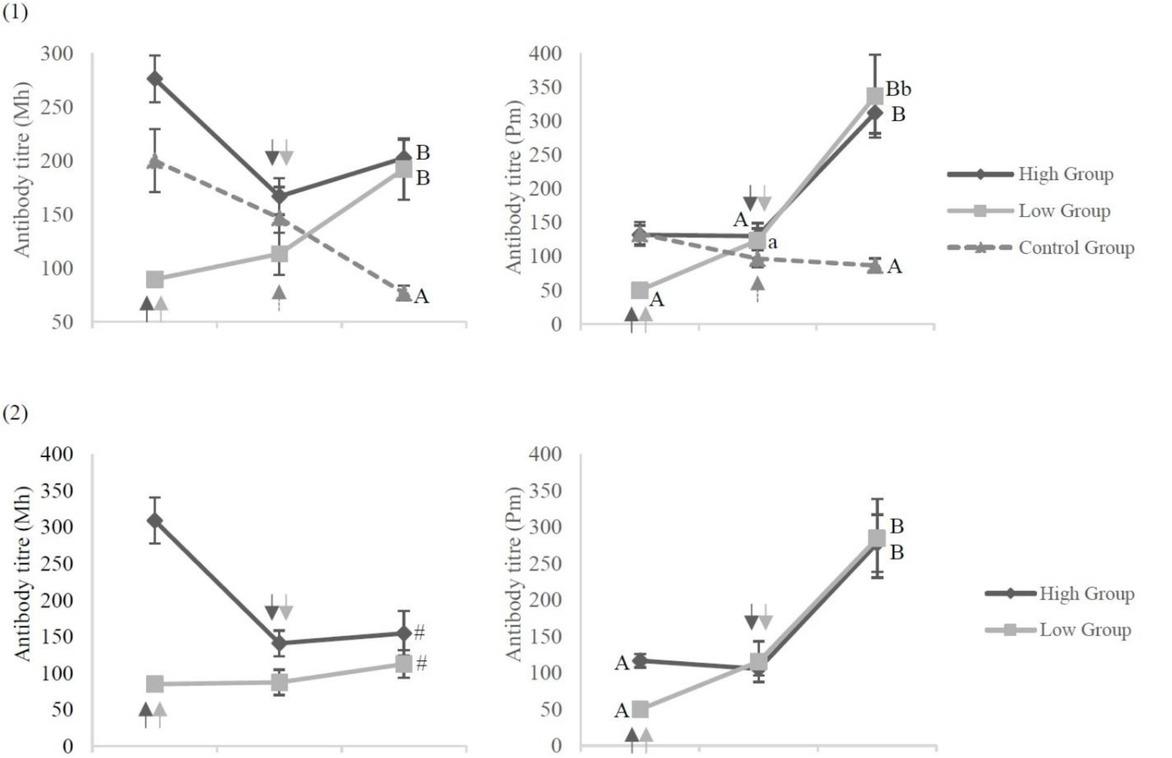
Fig. 4
Time schedules of vaccination and blood sampling
| First experiment | |||||||||
|---|---|---|---|---|---|---|---|---|---|
| Weeks after primary vaccination (or first blood sampling) | 0 | 1 | 2 | 3 | 4 | 5 | 6 | 7 | Sample size |
| +2 group | Primary* | Booster | BS | n = 21 | |||||
| +3 group | Primary* | Booster | BS | n = 16 | |||||
| +4 group | Primary* | Booster | BS | n = 19 | |||||
| Control group | BS** | Vaccination | BS | n = 15 | |||||
j_jvetres-2020-0042_tab_005_w2aab3b7c90b1b6b1ab1b1b8Aa
| Maternal antibody level | Primary vaccination | Booster vaccination | Blood sampling | Sample size | |
| Mh high group | Mh: 200 or over | n = 11 | |||
| Mh low group | Mh: under 200 | the age of 1–3 weeks | 4 weeks | 3 weeks | n = 20 |
| Pm high group | Pm: 100 or over | after primary vaccination | after booster vaccination | n = 18 | |
| Pm low group | Pm: under 100 | n = 13 | |||
j_jvetres-2020-0042_tab_004_w2aab3b7c90b1b6b1ab1b1b7Aa
| Second experiment | |||||||||||||
| Age (weeks) | 1 | 2 | 3 | 4 | 5 | 6 | 7 | 8 | 9 | 10 | 11 | 12 | Sample size |
| 1+4 Group | Primary | Booster | BS | BS | n = 10 | ||||||||
| 2+4 Group | Primary | Booster | BS | BS | n = 11 | ||||||||
| 3+4 Group | Primary | Booster | BS | BS | n = 10 | ||||||||
Number and percentage of seropositive or seronegative calves at 3 weeks after the booster dose
| First Experiment | Second Experiment | |||||||||||||
|---|---|---|---|---|---|---|---|---|---|---|---|---|---|---|
| +2 | +3 | +4 | Cont. | 7–12 | 5–6 | High | Low | 1+4 | 2+4 | 3+4 | High | Low | ||
| H. somni | Positive | 19 | 14 | 19 | 3 | 36 | 16 | - | - | 10 | 10 | 8 | - | - |
| 90.5% | 87.5% | 100% | 20.0% | 90.0% | 100% | - | - | 100% | 91.0% | 80.0% | - | - | ||
| Negative | 2 | 2 | 0 | 12 | 4 | 0 | - | - | 0 | 1 | 2 | - | - | |
| 9.5% | 12.5% | 0.0% | 80.0% | 10.0% | 0.0% | - | - | 0.0% | 9.0% | 20.0% | - | - | ||
| P. multocida | Positive | 20 | 16 | 19 | 9 | 39 | 16 | 25 | 14 | 10 | 11 | 10 | 18 | 13 |
| 92.5% | 100% | 100% | 60.0% | 97.5% | 100% | 100% | 93.3% | 100% | 100% | 100% | 100% | 100% | ||
| Negative | 1 | 0 | 0 | 6 | 1 | 0 | 0 | 1 | 0 | 0 | 0 | 0 | 0 | |
| 4.8% | 0.0% | 0.0% | 40.0% | 2.5% | 0.0% | 0.0% | 6.7% | 0.0% | 0.0% | 0.0% | 0.0% | 0.0% | ||
| M. haemolytica | Positive | 11 | 10 | 12 | 0 | 29 | 4 | 18 | 11 | 6 | 2 | 1 | 5 | 4 |
| 52.4% | 62.5% | 63.2% | 0.0% | 72.5% | 25.0% | 85.7% | 57.9% | 60.0% | 18.0% | 10.0% | 45.5% | 20.0% | ||
| Negative | 10 | 6 | 7 | 15 | 11 | 12 | 3 | 8 | 4 | 9 | 9 | 6 | 16 | |
| 47.6% | 37.5% | 36.8% | 100.0% | 27.5% | 75.0% | 14.3% | 42.1% | 40.0% | 82.0% | 90.0% | 54.5% | 80.0% | ||
j_jvetres-2020-0042_tab_003_w2aab3b7c90b1b6b1ab1b1b6Aa
| Maternal antibody level | Primary vaccination | Booster vaccination | Blood sampling | Sample size | |
| Mh High group | Mh: 200 or over | n = 21 | |||
| Mh Low group | Mh: under 200 | 2, 3 or 4 weeks | 3 weeks | n = 19 | |
| Pm High group | Pm: 100 or over | the age of 7–12 days | after primary vaccination | after booster vaccination | n = 25 |
| Pm Low group | Pm: under 100 | n = 15 | |||
j_jvetres-2020-0042_tab_002_w2aab3b7c90b1b6b1ab1b1b5Aa
| Primary vaccination | Booster vaccination | Blood sampling | Sample size | |
| 7–12 day group | age of 7–12 days | 2, 3 or 4 weeks after | 3 weeks after booster | n = 40 |
| 5–6 day group | age of 5 or 6 days | primary vaccination | vaccination | n = 16 |