
Table 1
Primer sequences used for detection of classical SE genes (sea–see) and the gene encoding toxic shock syndrome tsst-1
| Gene | Primer sequences | Product size (bp) | Reference |
|---|---|---|---|
| nuc | GCGATTGATGGTGATACGGTT | 279 | (12) |
| AGCCAAGCCTTGACGAACTAAAGC | |||
| sea | ACCGTTTCCAAAGGTACTGTA | 135 | (28) |
| TGGTACACCAAACAAAACAGC | |||
| seb | CCTAAACCAGATGAGTTGCAC | 592 | (28) |
| CAGGCATCATGTCATACCAAA | |||
| sec | AGATGAAGTAGTTGATGTGTATGG CTTCACACTTTTAGAATCAACCG | 454 | (20) |
| sed | GCTTGTACATATGGAGGTGTCA | 263 | (28) |
| GACCCATCAGAAGAATCAAACT | |||
| see | CAGTACCTATAGATAAAGTTAAAACAAGC | 178 | (10) |
| TAACTTACCGTGGACCCTTC | |||
| tsst-1 | GGCAGCATCAGCCTTATAATTT | 371 | (28) |
| GTGGATCCGTCATTCATTGTT |
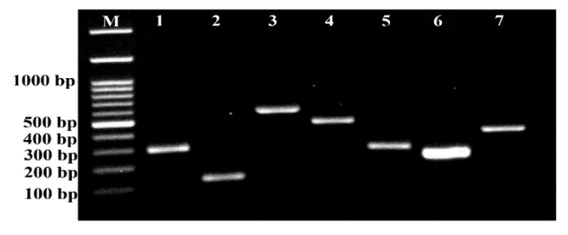
Fig. 1
PCR amplification of a S. aureus specific gene (nuc), classical SE genes (sea–see), and the tsst-1 gene. Lane M – 100 bp DNA marker; Lanes 1–7 – nuc, sea, seb, sec, sed, see, and tsst-1, respectively
Table 2
Detection of classical SE and tsst-1 genes by PCR and of classical SE production by RPLA
| S. aureus enterotoxin genotype | Thai fermented pork sausages (n = 36) | Hospitalised patients (n = 54) | Healthy carriers (n = 10) | |||
|---|---|---|---|---|---|---|
| PCR | RPLA | PCR | RPLA | PCR | RPLA | |
| sea | 17 (47%) | 22 (61%) a | 7 (13%) | 4 (7%) | 4 (40%) | 6 (60%) b |
| seb | 4 (11%) | 15 (42%) | 18 (33%) | 15 (28%) | 1 (10%) | 3 (30%) |
| sec | 0 (0%) | 10 (28%) | 1 (2%) | 6 (11%) | 0 (0%) | 1 (10%) |
| sed | 0 (0%) | 0 (0%) | 0 (0%) | 0 (0%) | 0 (0%) | 0 (0%) |
| see | 1 (3%) | ND | 1 (2%) | ND | 0 (0%) | ND |
| tsst-1 | 0 (0%) | - | 0 (0%) | - | 0 (0%) | - |
| sea/seb | 2 (5%) | - | 1 (2%) | - | 1 (10%) | - |
| seb/sec | 6 (17%) | - | 9 (17%) | - | 0 (0%) | - |
| sea/seb/sec | 4 (11%) | - | 2 (4%) | - | 1 (10%) | - |
| seb/sec/tsst-1 | 0 (0%) | - | 4 (7%) | - | 0 (0%) | - |
| Total | 34 (94%) | 43 (80%) | 7 (70%) | |||
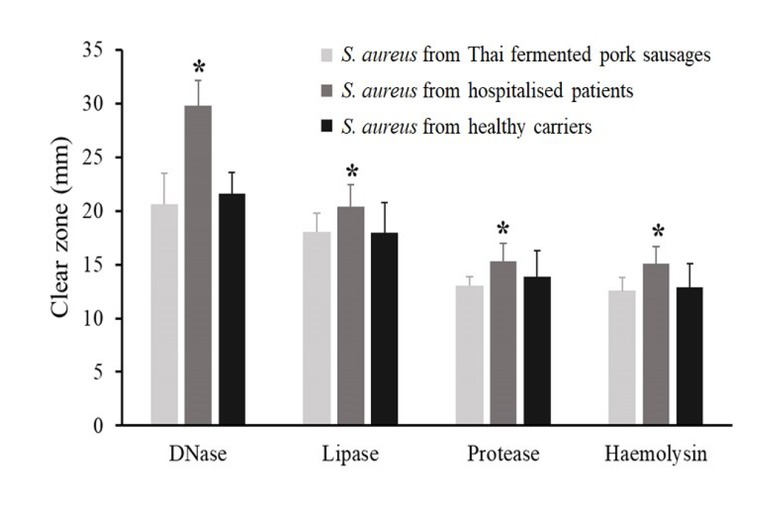
Fig. 2
Production of extracellular enzymes (DNase, lipase, protease) and haemolysin by S. aureus strains isolated from three different sources. Data are presented as the mean diameter of clear zones surrounding colonies (mm), determined from triplicate independent experiments. * P < 0.05 is considered to be statistically significant in between-group comparisons
Table 3
Grading of biofilm formation in S. aureus strains isolated from three different sources
| OD ranges (570 nm) | Biofilm quantity grade | S. aureus isolates | ||
|---|---|---|---|---|
| Thai fermented pork sausages (n = 36) | Hospitalised patients (n = 54) | Healthy carriers (n = 10) | ||
| <0.19 | Biofilm non-former | 0 (0%) | 0 (0%) | 0 (0%) |
| ≥0.19 and ≤0.38 | Weak biofilm former | 0 (0%) | 0 (0%) | 0 (0%) |
| ≥0.38 and ≤0.76 | Moderate biofilm former | 2 (6%) | 0 (0%) | 0 (0%) |
| ≥0.76 | Strong biofilm former | 34 (94%) | 54 (100%) | 10 (100%) |
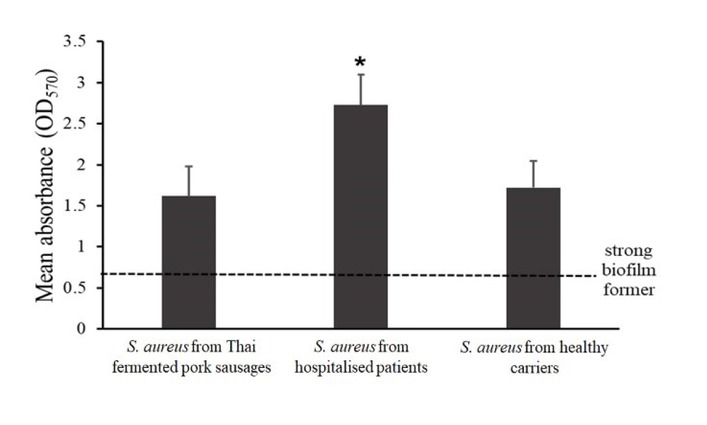
Fig. 3
Biofilm formation was evaluated by crystal violet staining in triplicate independent experiments. Absorbance at 570 nm was measured with a microplate reader. Isolates with OD570 values ≥0.76 were considered to be strong biofilm formers. * P < 0.05 was considered to be significantly different in between-group comparisons
Table 4
Antibiotic resistance in S. aureus strains isolated from samples of Thai fermented pork sausage, hospitalised patients, and healthy carriers
| Antibiotic group | Antibiotic | Antibiotic resistance in S. aureus isolates | ||
|---|---|---|---|---|
| Thai fermented pork sausages (n = 36) | Hospitalised patients (n = 54) | Healthy carriers (n = 10) | ||
| β-lactams | penicillin | 30 (83%) | 47 (87%) | 8 (80%) |
| ampicillin | 26 (72%) | 47 (87%) | 7 (70%) | |
| amoxicillin/clavulanic acid | 3 (8%) | 1 (2%) | 1 (10%) | |
| ceftriaxone | 0 (0%) | 0 (0%) | 0 (0%) | |
| cephazolin | 0 (0%) | 0 (0%) | 0 (0%) | |
| ceftazidime | 0 (0%) | 0 (0%) | 0 (0%) | |
| cefoxitin | 0 (0%) | 0 (0%) | 0 (0%) | |
| Lincosamides | clindamycin | 0 (0%) | 4 (7%) | 1 (10%) |
| Macrolides | erythromycin | 0 (0%) | 4 (7%) | 1 (10%) |
| Aminoglycosides | gentamicin | 0 (0%) | 0 (0%) | 0 (0%) |
| Phenicols | chloramphenicol | 0 (0%) | 2 (4%) | 0 (0%) |
| Glycopeptides | vancomycin | 0 (0%) | 0 (0%) | 0 (0%) |
| Sulphonamides | trimethoprim/sulfamethoxazole | 0 (0%) | 0 (0%) | 0 (0%) |