
Table 1
List of primers used for quantitative RT-PCR
| Target gene | Primer sequence (5′–3′) | Amplicon size (bp) |
|---|---|---|
| ENO1 | F: GCGGTGCCTCAACTGGAATT | 183 |
| R: CCATGTCCAGCATCAGTTTGTC | ||
| GAPDH | F: GCTGATGCTCCCATGTTCGTGAT R: GTGGTGCAAGAGGCATTGCTGAC | 86 |
| LHR | F: GTAACACTGGAATAAGGGAAT R: GAAGGCTTGACTGTGGATA | 191 |
| ERα | F: ACCCAAACAGACCATTCAACGAA R: CGCCAGACTAAGCCAATCATCAG | 187 |
| ERβ | F: AAGTGGGAATGATGAAATGTGGC R: GGACTGACCGTGCTGAGGAGAAT | 163 |
| FSHR | F: TCCTGTGCTAACCCTTTCCTCTA R: AACCAGTGAATAAATAGTCCCATC | 207 |
| IGFBP-1 | F: CCTTGTCAGAAGGAGCTCTA R: CATCCAGTGAAGTTTCACACT | 145 |
| GHR | F: GCCCCTGCTGACATTTGAGAAT R: GGCCACTGCAGAAGATCATCAC | 115 |
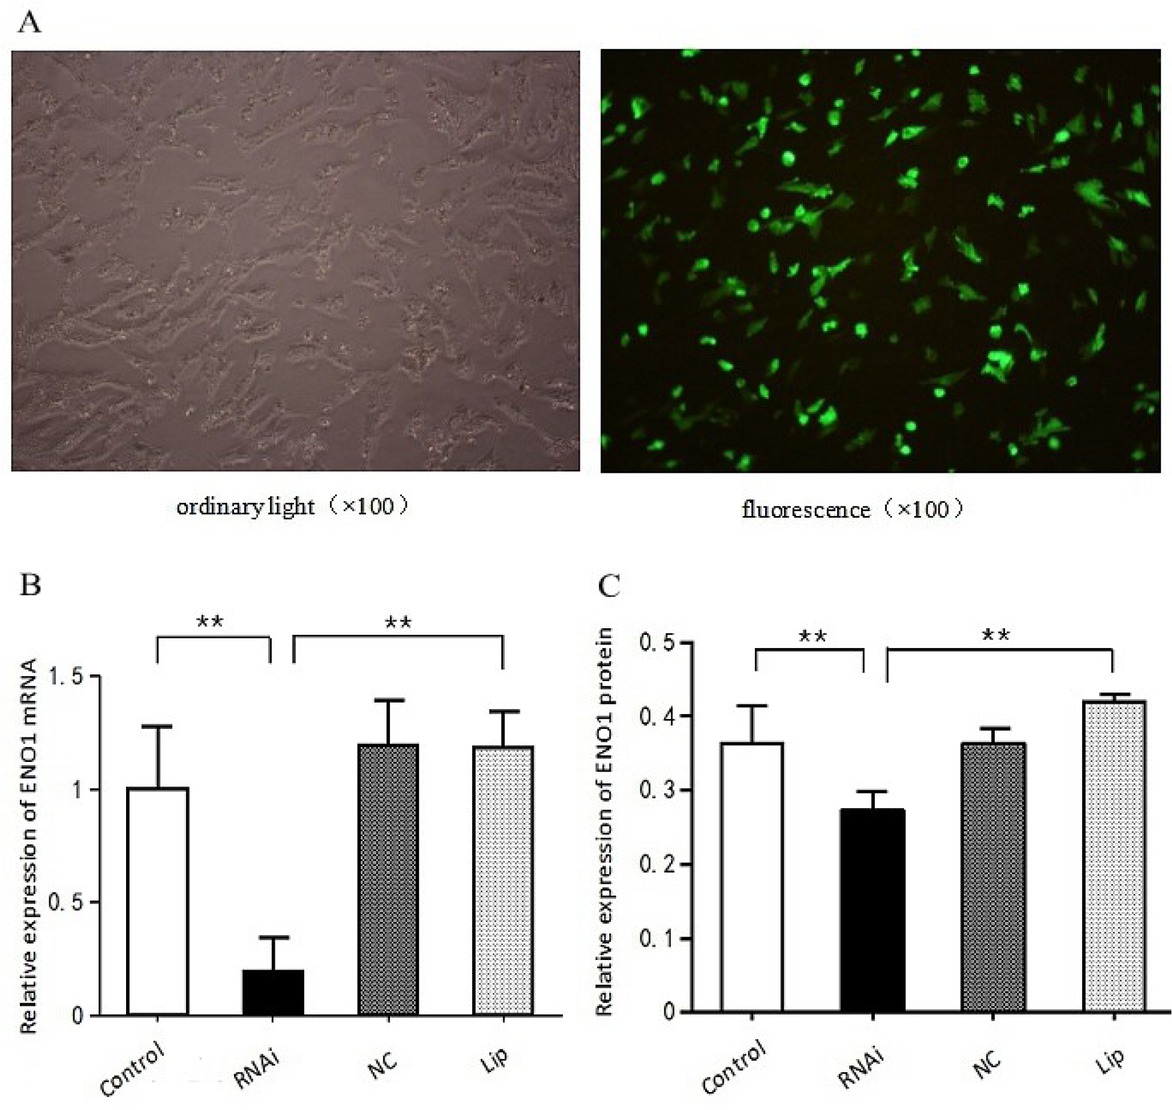
Fig. 1
Transfection of shRNA-ENO1 in granulosa cells and detection of ENO1 expression. A – transfection of shRNA-ENO1 in granulosa cells (100 ×) including granulosa cells under ordinary light and fluorescence. B – ENO1 mRNA expression by qRT-PCR in granulosa cells transfected with shRNA-ENO1 after 48 h. ENO1 mRNA expression by qRT-PCR in granulosa cells was measured by qRT-PCR. C – ENO1 expression by Western blot in granulosa cells transfected with shRNA-ENO1 after 48 h. The significance of difference for the ENO1 expression level among the different groups was determined by Student’s t-test. ** P < 0.01, and * P < 0.05 when compared with the control sample
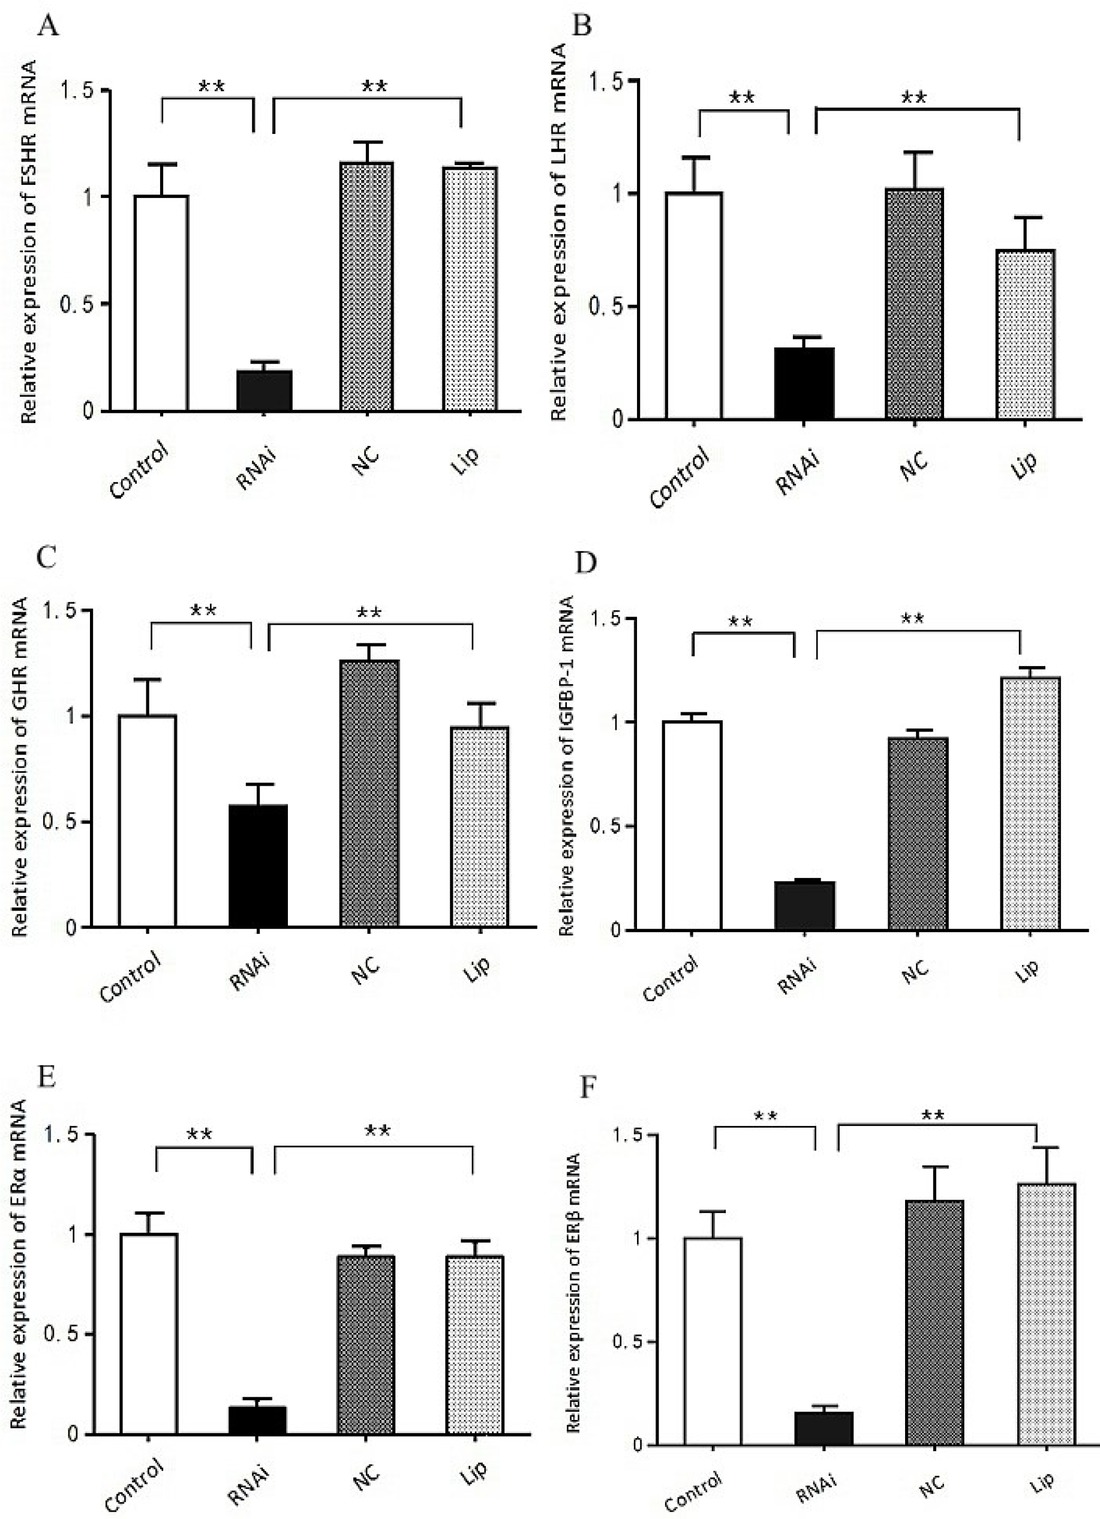
Fig. 2
Quantitative RT-PCR–detected expression of FSHR, LHR, ERα, ERβ, GHR, and IGFBP-1 mRNA in the granulosa transfected with shRNA-ENO1 after 48 h detected by qRT-PCR. A – FSHR, B – LHR, C – GHR, D – IGFBP-1, E – ERα, F – ERβ. The significance of difference for the hormone receptor levels were determined by Student’s t-test. ** p < 0.01, and * p < 0.05 when compared with the control sample
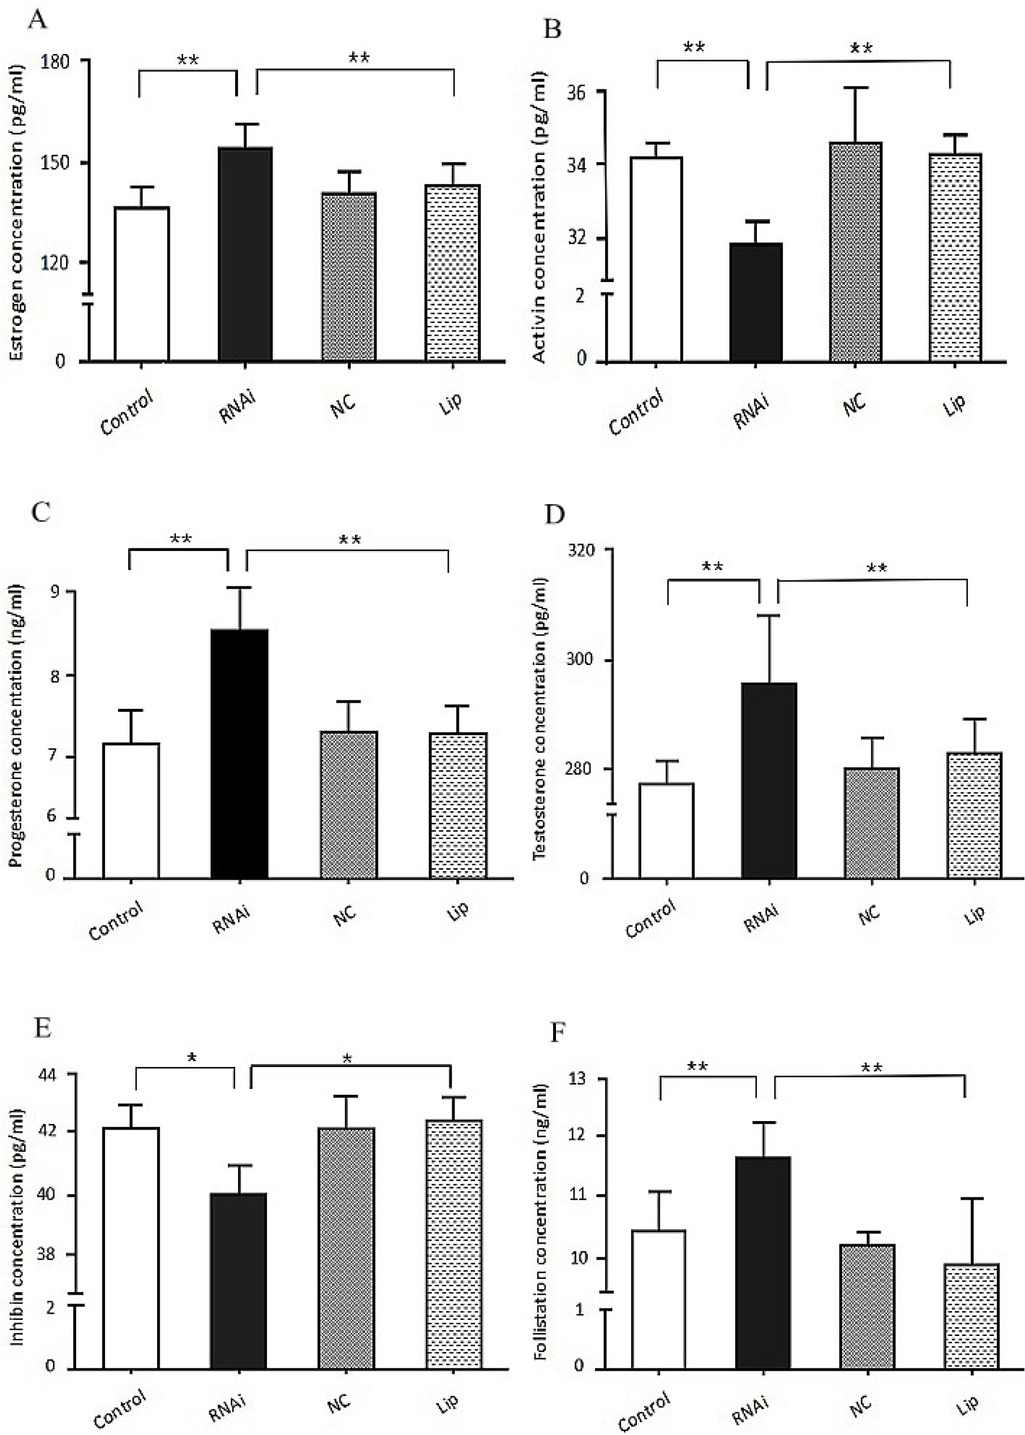
Fig. 3
ELISA-detected concentration of six hormones in the supernatant of granulosa transfected with shRNA-ENO1 after 48 h. A – oestradiol. B – activin. C – progesterone. D – testosterone. E – inhibin. F – follistatin. The significance of difference for the hormone levels was determined by Student’s t-test. ** P < 0.01, and * P < 0.05 when compared with the control sample