
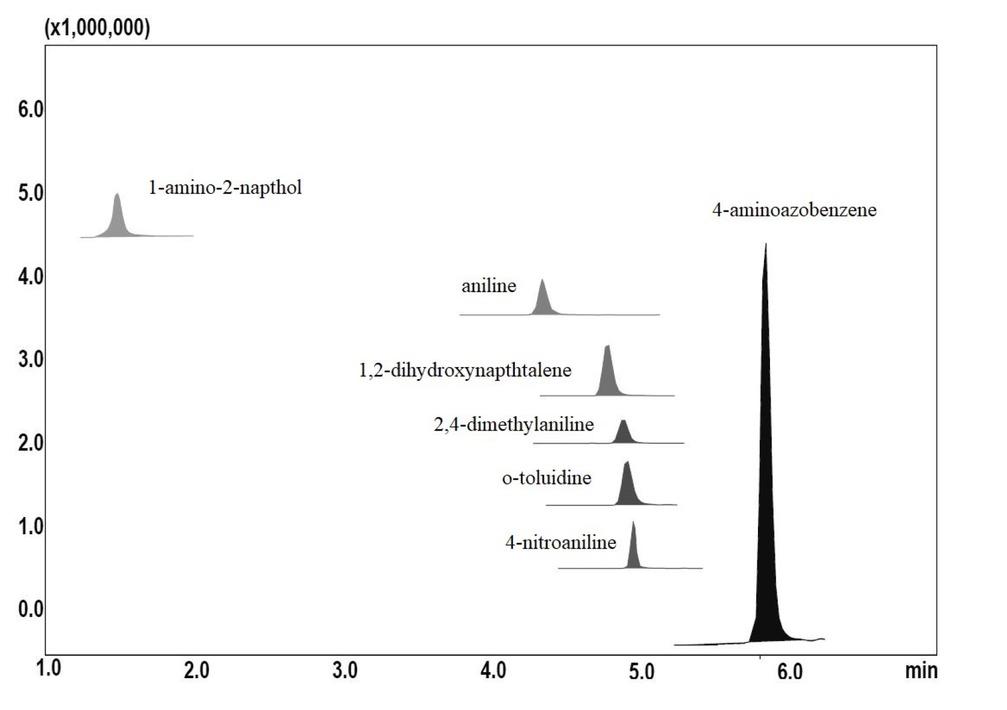
Fig. 1
Signals (m/z ratio) acquired during the electrochemical step
| Azo dye | Acquired m/z ratio | ||||||||||||||
|---|---|---|---|---|---|---|---|---|---|---|---|---|---|---|---|
| Sudan I | 94 | 105 | 128 | 159 | 161 | 181 | 198 | ||||||||
| Sudan II | 105 | 122 | 138 | 158 | 160 | 181 | 201 | ||||||||
| Sudan III | 94 | 108 | 128 | 158 | 160 | 173 | 181 | 198 | |||||||
| Sudan IV | 108 | 158 | 160 | ||||||||||||
| Para Red | 108 | 159 | 160 | 199 | |||||||||||
Mass spectrometry parameters for analytes in scope of the LC–MS/MS method
| Analyte | Ionisation | Precursor | Products | Collision energy (eV) |
|---|---|---|---|---|
| 1,2-dihydroxynaphthalene | positive | 161.0 | 131.0/77.1 | −33.0/−18.0 |
| 2,4-dimethyaniline | positive | 122.6 | 108.1/80.1 | −27.0/−21.0 |
| 1-amino-2-naphthol | positive | 160.0 | 130.0/103.3 | −13.0/−11.0 |
| 4-aminoazobenzene | positive | 197.6 | 93.2/77.1 | −25.0/−49.0 |
| 4-nitroaniline | negative | 137.0 | 107.0/93.0 | 30.0/18.0 |
| aniline | positive | 94.2 | 77.1/51.0 | −25.0/−30.0 |
| o-toluidine | positive | 108.0 | 91.1/65.1 | −21.0/−27.0 |