
Table 1
Sequences of β-actin and proglucagon (GCG) specific primer pairs
| Gene | Primers of genes | Reference number | |
|---|---|---|---|
| β-actin 5' | 5'-TCATGAAGTGTGACGTTGACATCCGT-3' | 20 | |
| β-actin 3' | 5'-CCTAGAAGCATTTGCGGTGCACGATG-3' | 20 | |
| Proglucagon | (GCG) 5' | 5'-GACTTCCCAGAAGAAGTCGCCAT-3' | 28 |
| Proglucagon | (GCG) 3' | 5'-CTACGGTTACCAGGTGGTCATGT-3' | 28 |
Table 2
Blood glucose level (mg/dL) on the 3rd day. Comparison among groups
| Group | N | Blood glucose (mg/dL) minimum | Blood glucose (mg/dL) maximum | Blood glucose (mg/dL) mean ± SD |
|---|---|---|---|---|
| Diabetic | 6 | 240 | 360 | 275.66a ± 45.71 |
| Control | 6 | 74 | 83 | 79.50b ± 3.27 |
| Sham | 6 | 72 | 84 | 79.33b ± 4.13 |
[i] a, b – values with different letters are significantly different (P < 0.05), N – number of mice, SD – standard deviation
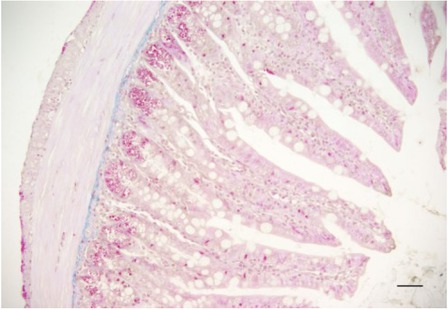
Fig. 1
General view of ileum tissue. Diabetic group. Triple staining. Bar: 100 μm
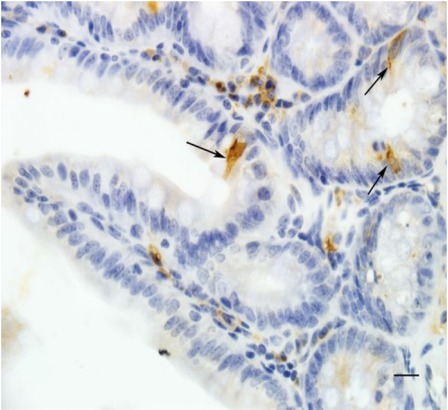
Fig. 2
GLP-1 immunoreactivity. Diabetic group. Arrows show GLP-1 immunoreactivity. Bar: 50 μm
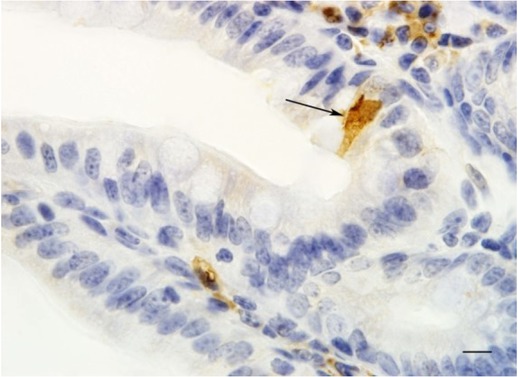
Fig. 3
GLP-1 immunoreactivity. Diabetic group. Arrow shows GLP-1 immunoreactivity. Bar: 20 μm
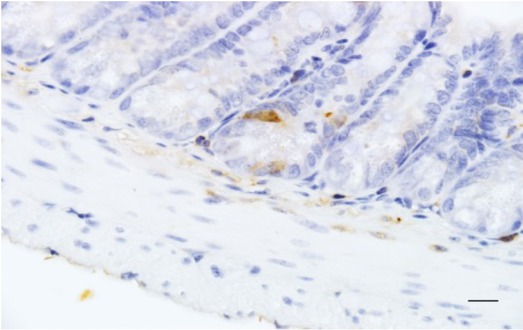
Fig. 4
GLP-1 immunoreactivity. Sham group. Bar: 50 μm
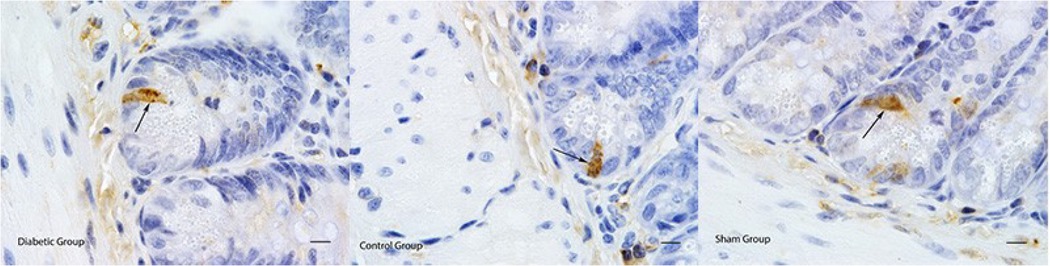
Fig. 5
GLP-1 Immunoreactivity in diabetic, control, and sham groups. Arrows show GLP-1 immunoreactivity. Bars: 20 μm
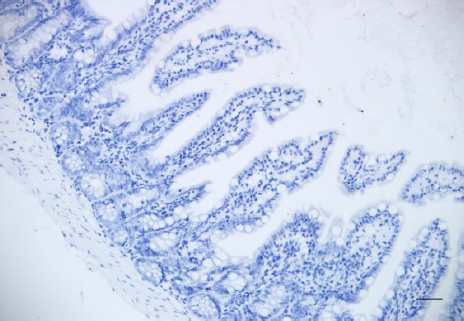
Fig. 6
Negative control group. Bar: 100 μm
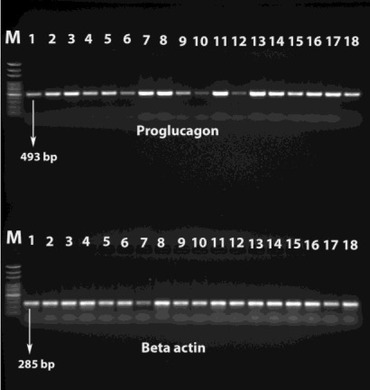
Fig. 7
RT PCR results for proglucagon and β-actin genes. M – 100 bp DNA ladder, 1–6 – diabetic group, 7–12 – control group, 12– 18 – sham group
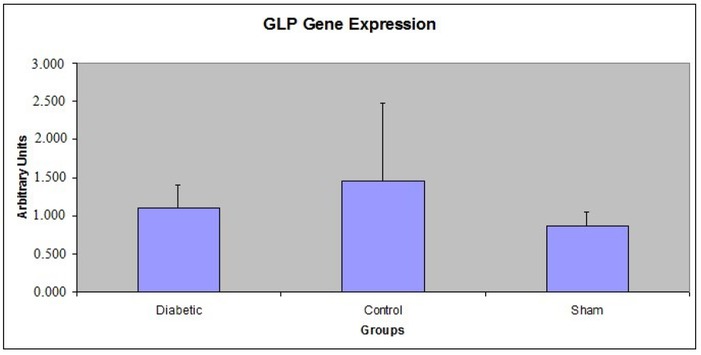
Fig. 8
Comparison of mean ±standard deviation among groups in terms of proglucagon gene expression. P > 0.05