
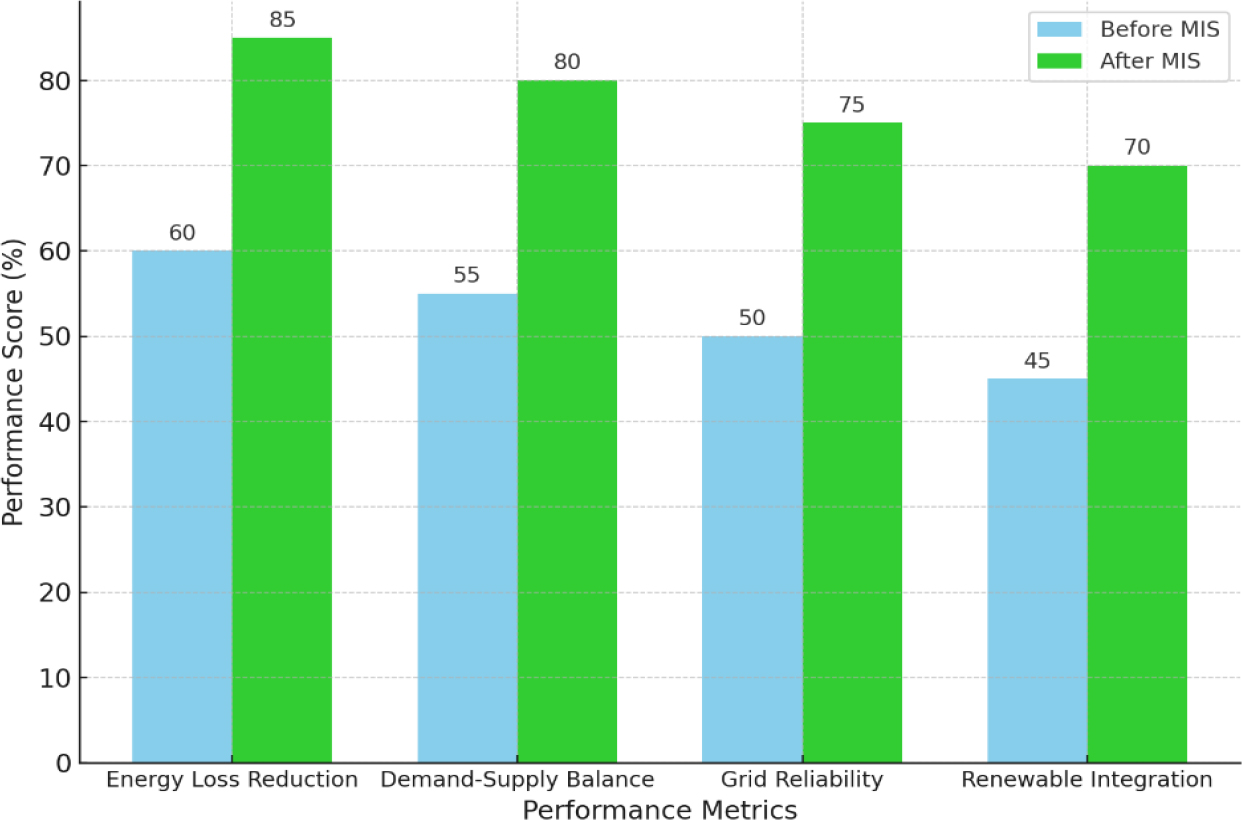
Figure 1.
Impact of MIS on smart Grid Performance.
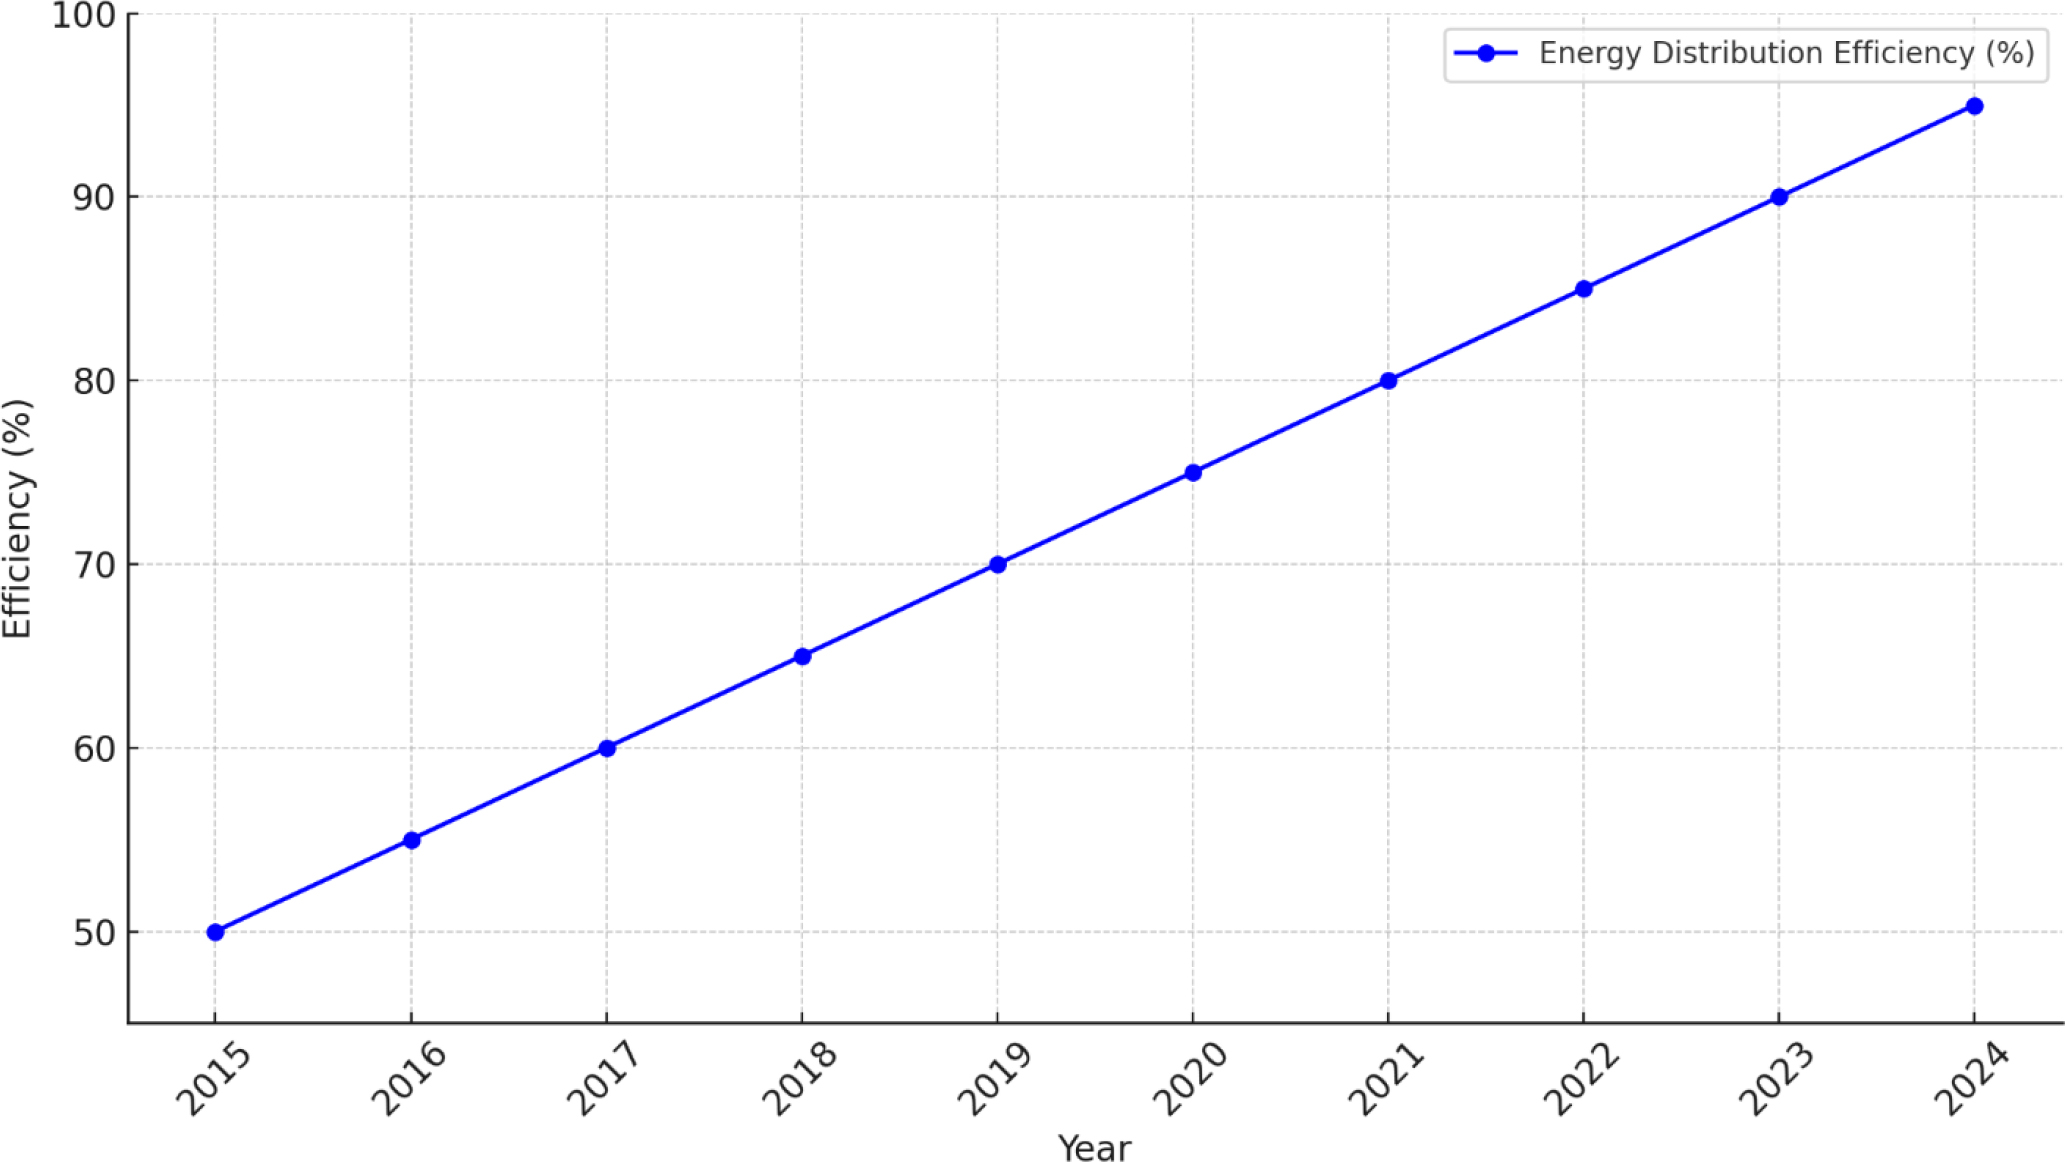
Figure 2.
Trends in Energy Distribution Efficiency with MIS(2015-2024).
Table 1.
The evolution of MIS in real-time decision-making and its key developments leading up to 2024
| Year | Development | Impact on Real-Time Decision-Making |
|---|---|---|
| 2010 | Emergence of Cloud-Based MIS | Enabled remote access to data, reducing decision delays and improving collaboration across distributed teams. |
| 2012 | Integration of Mobile Technologies | Empowered decision-makers to access MIS data and reports on the go, facilitating timely responses to dynamic situations. |
| 2015 | Big Data Analytics in MIS | Allowed organizations to process vast datasets, gaining deeper insights and predictive capabilities for strategic decisions. |
| 2017 | Adoption of IoT for Real-Time Data | Provided real-time monitoring in industries like logistics, manufacturing, and healthcare through connected devices. |
| 2019 | Artificial Intelligence in MIS | Enhanced decision-making with predictive analytics, automation, and prescriptive recommendations based on data trends. |
| 2020 | Rise of Remote Work and Collaboration Tools | Accelerated the adoption of MIS integrated with tools like Slack, Zoom, and Teams for real-time coordination and reporting. |
| 2021 | Advanced Cybersecurity Measures in MIS | Strengthened real-time data protection, ensuring secure and uninterrupted decision-making processes. |
| 2022 | Machine Learning Models in MIS | Improved adaptive decision-making, with systems learning from historical data to refine outcomes in real-time scenarios. |
| 2023 | Increased Focus on Sustainable MIS Solutions | Incorporated environmental metrics in real-time dashboards to support decisions aligned with sustainability goals. |
| 2024 | AI-Driven Real-Time Decision Systems | Achieved seamless integration of AI with MIS, offering autonomous decision-making capabilities in dynamic business environments. |
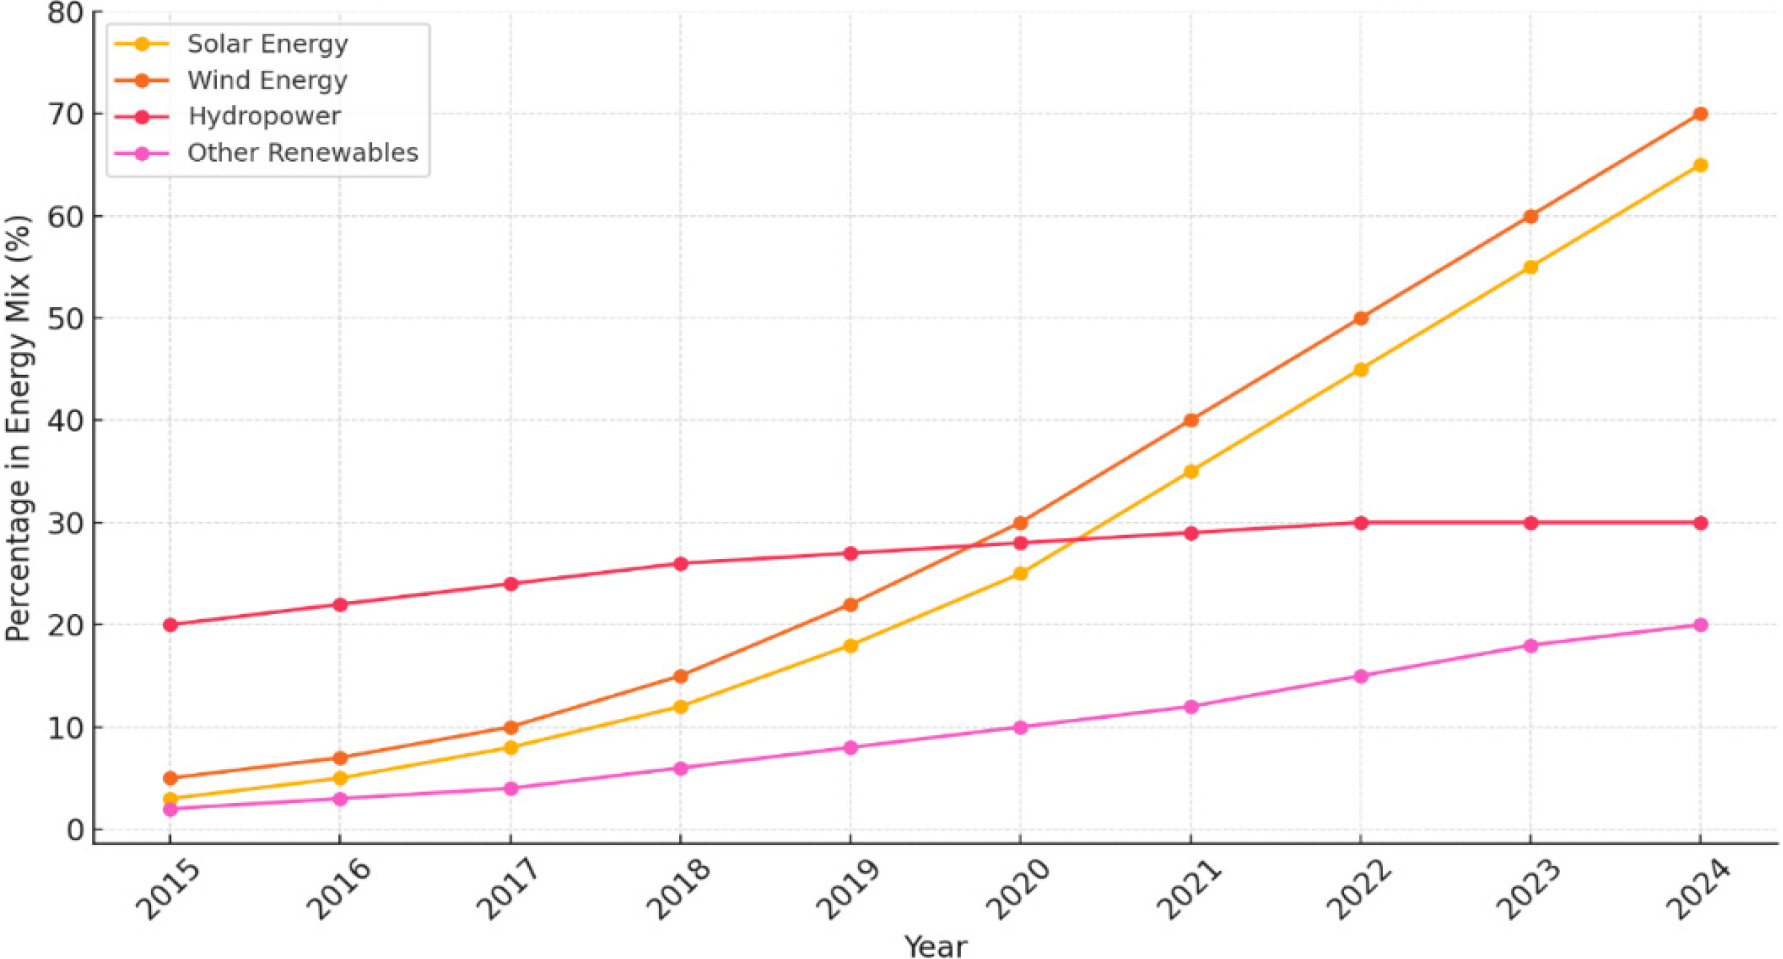
Figure 3.
Renewable Energy Integration over time (2015-2024).
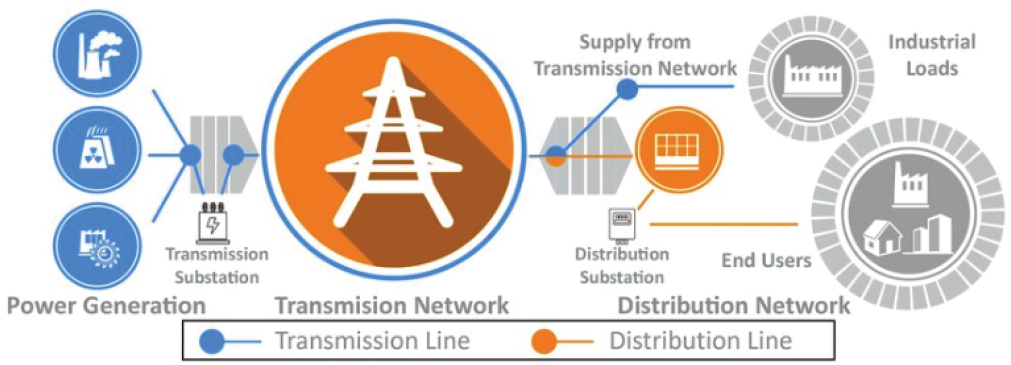
Figure 4.
Integrated transmission and distribution (T&D) model
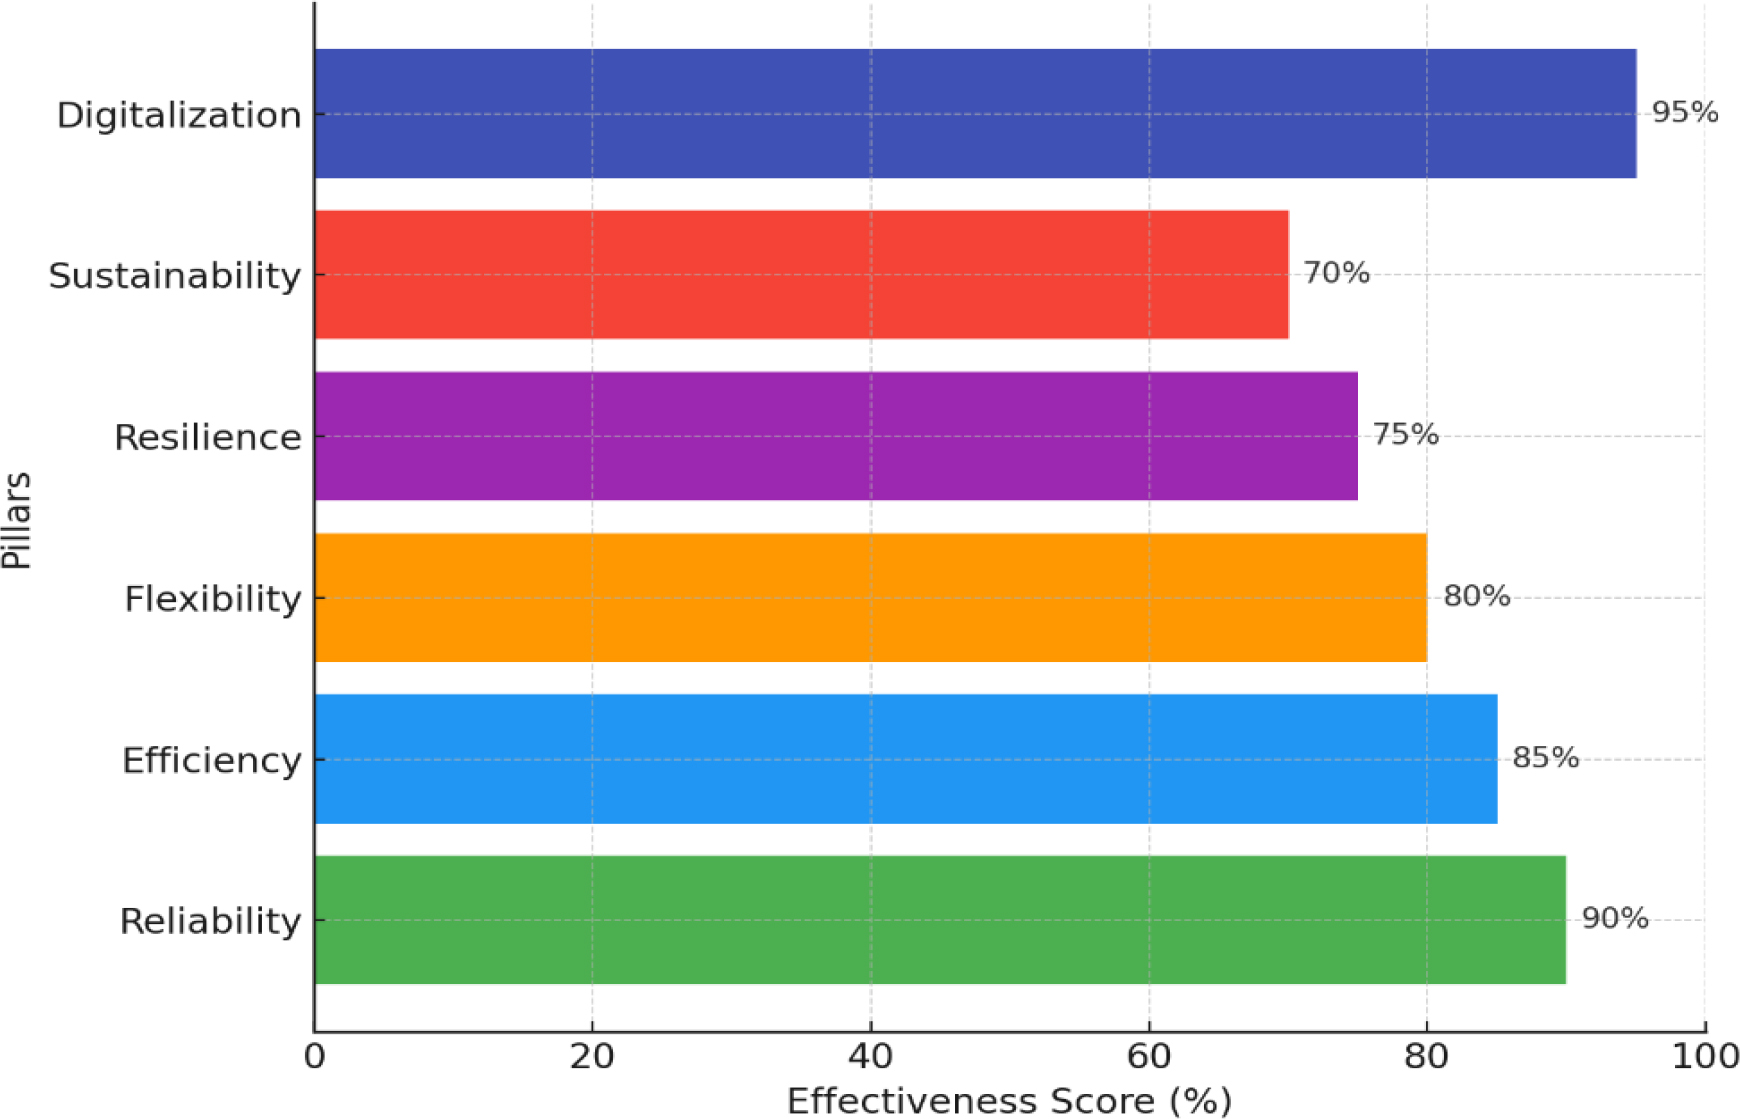
Figure 5.
Grid Effectiveness Pillar and Their Hypothetical Scores.
Table 2.
Energy Theft Detection Model
| Notation+ F6:G13 | Description |
|---|---|
| Pi | Power consumption recorded by the smart meter at consumer iii. |
| P pred, i | Predicted power consumption for consumer i based on historical patterns. |
| ΔPi | Difference between recorded and predicted power (ΔPi=Pi– Ppred, i) |
| Ti | Theft indicator for consumer i Ti=1T_i = 1 if theft is detected, 0 otherwise. |
| θ | Threshold value for acceptable deviations in consumption data. |
| V | Voltage levels monitored at various grid points. |
| I | Current levels monitored at various grid points. |
| Lloss | Total technical losses calculated for the grid. |
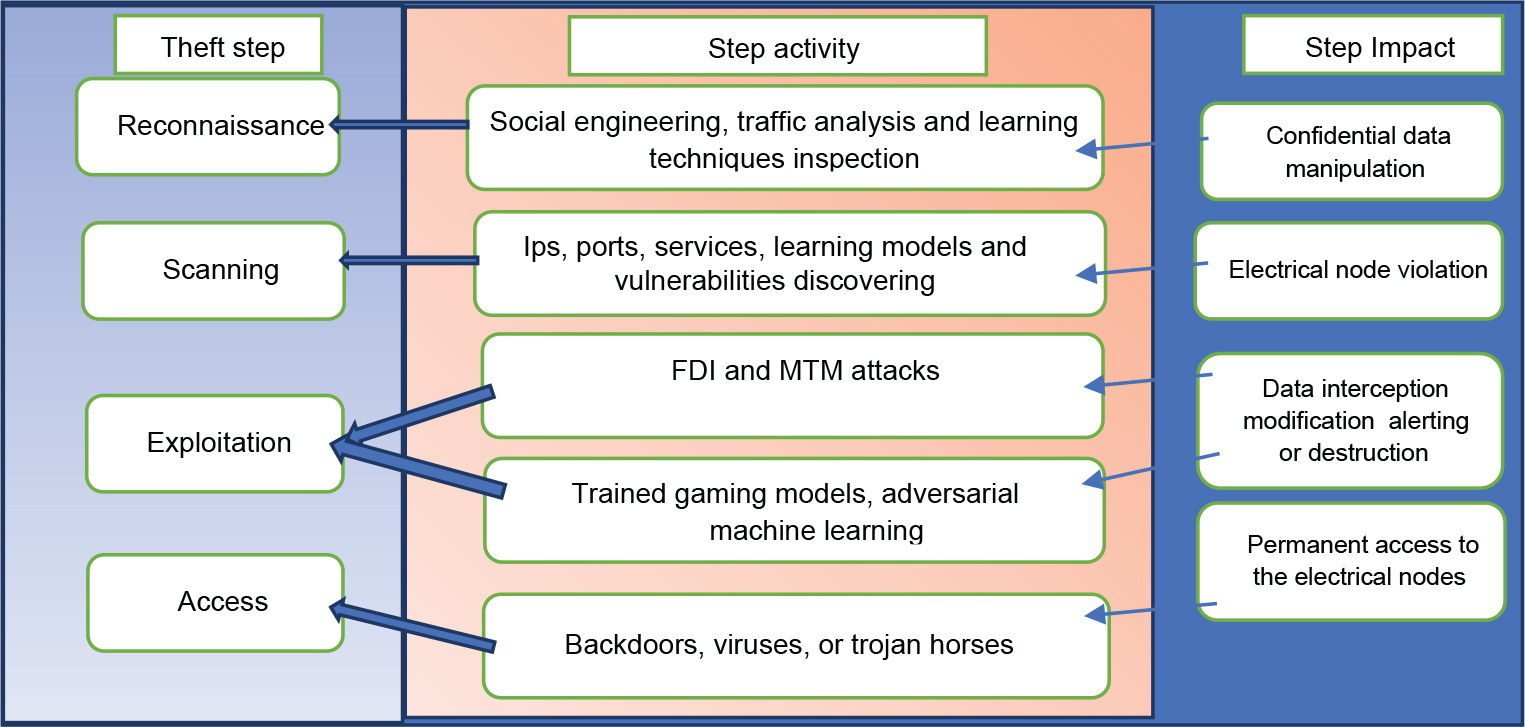
Figure 6.
Steps and associated activities in cyber-physical attacks enabling energy theft.
Table 3.
Overview of the data-driven energy theft attacks
| Category | Strategies | Infrastructure | Resources | Attack Effect | Remarks |
|---|---|---|---|---|---|
| Prevention & Detection | - Smart Metering Systems: Use of tamper-resistant meters. | - Smart Grids: Intelligent grids with real-time monitoring. | - Skilled Workforce: Engineers, data scientists, and cybersecurity experts. | - Revenue Losses: Loss of income due to undetected theft. | - Proactive Monitoring: Continuous surveillance and real-time analysis are essential for quick detection. |
| Data Analytics & ML | - Data Analytics: Using AI algorithms for anomaly detection. | - IoT Devices: Sensors to monitor energy flow. | - Investment in Technology: Funding for smart meters and AI-powered detection systems. | - Grid Instability: Voltage fluctuations, outages, or overloads caused by unauthorized usage. | - Collaboration with Law Enforcement: Necessary for addressing criminal activity associated with theft. |
| Anomaly Detection | - Setting usage thresholds to flag irregular data. | - Communication Networks: Secure channels for meter-to-system data transfer. | - Big Data Infrastructure: Systems to process large volumes of meter and sensor data. | - Increased Operational Costs: High costs from efforts to detect and mitigate theft. | - Public Awareness: Educating consumers about the impacts of energy theft and responsible consumption. |
| Tamper Detection | - Using advanced tamper-proof meters. | - Real-time Monitoring: Continuous monitoring tools to identify irregularities promptly. | - Cybersecurity Resources: Investments in securing smart grid systems from cyber threats. | - Decreased Efficiency: Distorted data disrupts energy forecasting and grid management. | |
| Predictive Maintenance | - Using predictive analytics to anticipate potential points of theft. | - Advanced Metering Infrastructure (AMI): Infrastructure that supports real-time data transmission. | - Data Analysts & Technicians: Experts to interpret data and apply predictive models. | - Customer Discontent: Increased rates to offset losses, leading to consumer dissatisfaction. |
Table 4.
Overview of the data-driven energy theft detection methods
| Category | Techniques | Nature | Distribution | Attack Infrastructure | Attack Type | Data |
|---|---|---|---|---|---|---|
| Statistical Methods | - Outlier Detection | - Supervised Learning | - Centralized (Energy Company Servers) | - Smart Meters, Energy Distribution Networks | - Unauthorized usage | - Consumption Data (time-series, load profiles) |
| Machine Learning (ML) | - Decision Trees, Random Forests, SVM, KNN | - Supervised/Unsupervised Learning | - Distributed (Edge Devices, IoT Sensors) | - Smart Meters, Communication Networks | - Meter tampering, Load manipulation | - Historical Consumption, Customer Profiles, Anomalous Data |
| Neural Networks (Deep Learning) | - Artificial Neural Networks (ANN) | - Deep Learning | - Centralized and Distributed (Cloud and Edge Computing) | - Smart Meters, Data Storage, Real-time Monitoring Systems | - Data manipulation, Sub-metering | - Real-Time Consumption Data, Sensor Data, Voltage Fluctuations |
| Anomaly Detection | - Isolation Forest, Autoencoders, DBSCAN | - Unsupervised Learning | - Distributed across regions, real-time monitoring | - IoT Devices, Smart Meters, SCADA systems | - Stealthy usage or consumption bypass | - Historical and Real-Time Consumption, Load Profiles |
| Time-Series Analysis | - Trend Analysis, Seasonal Decomposition, ARIMA | - Supervised/Unsupervised Learning | - Distributed (Regional, Smart Grid Level) | - IoT Sensors, Smart Meters, Grid Data | - Energy load shifts, Consumption spikes | - Time-Series Energy Usage Data, Historical Load Patterns |
| Data Mining | - Clustering, Association Rule Mining, Support Vector Machines | - Supervised/Unsupervised Learning | - Centralized with periodic updates from local meters | - Smart Meters, Utility Databases, Communication Systems | - Non-compliance with usage regulations, Unauthorized tapping | - Energy Usage Data, User Profiles, Consumption History |
| Hybrid Models | - Combining multiple techniques (e.g., ML + Anomaly Detection) | - Mixed/Hybrid Learning | - Distributed and Centralized (Real-Time, Cloud-based Analysis) | - Energy Grid Infrastructure, Smart Meter Networks | - Complex attack schemes, Multiple Data Manipulation | - Real-Time Energy Data, Customer Usage, Historical Consumption |