
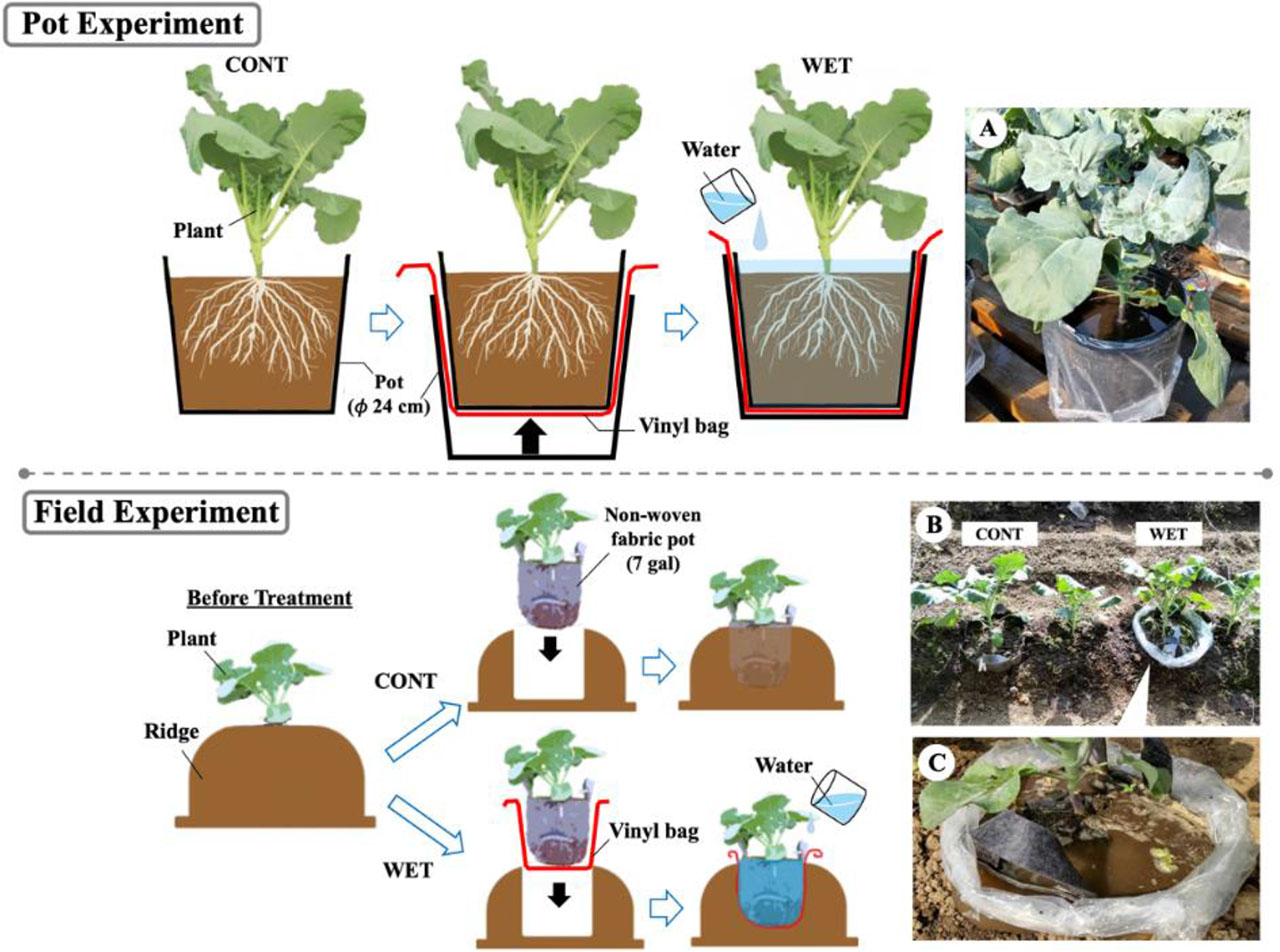
Figure 1.
Wet treatment in the pot experiment (upper, A) and in the field experiment (lower, B and C)
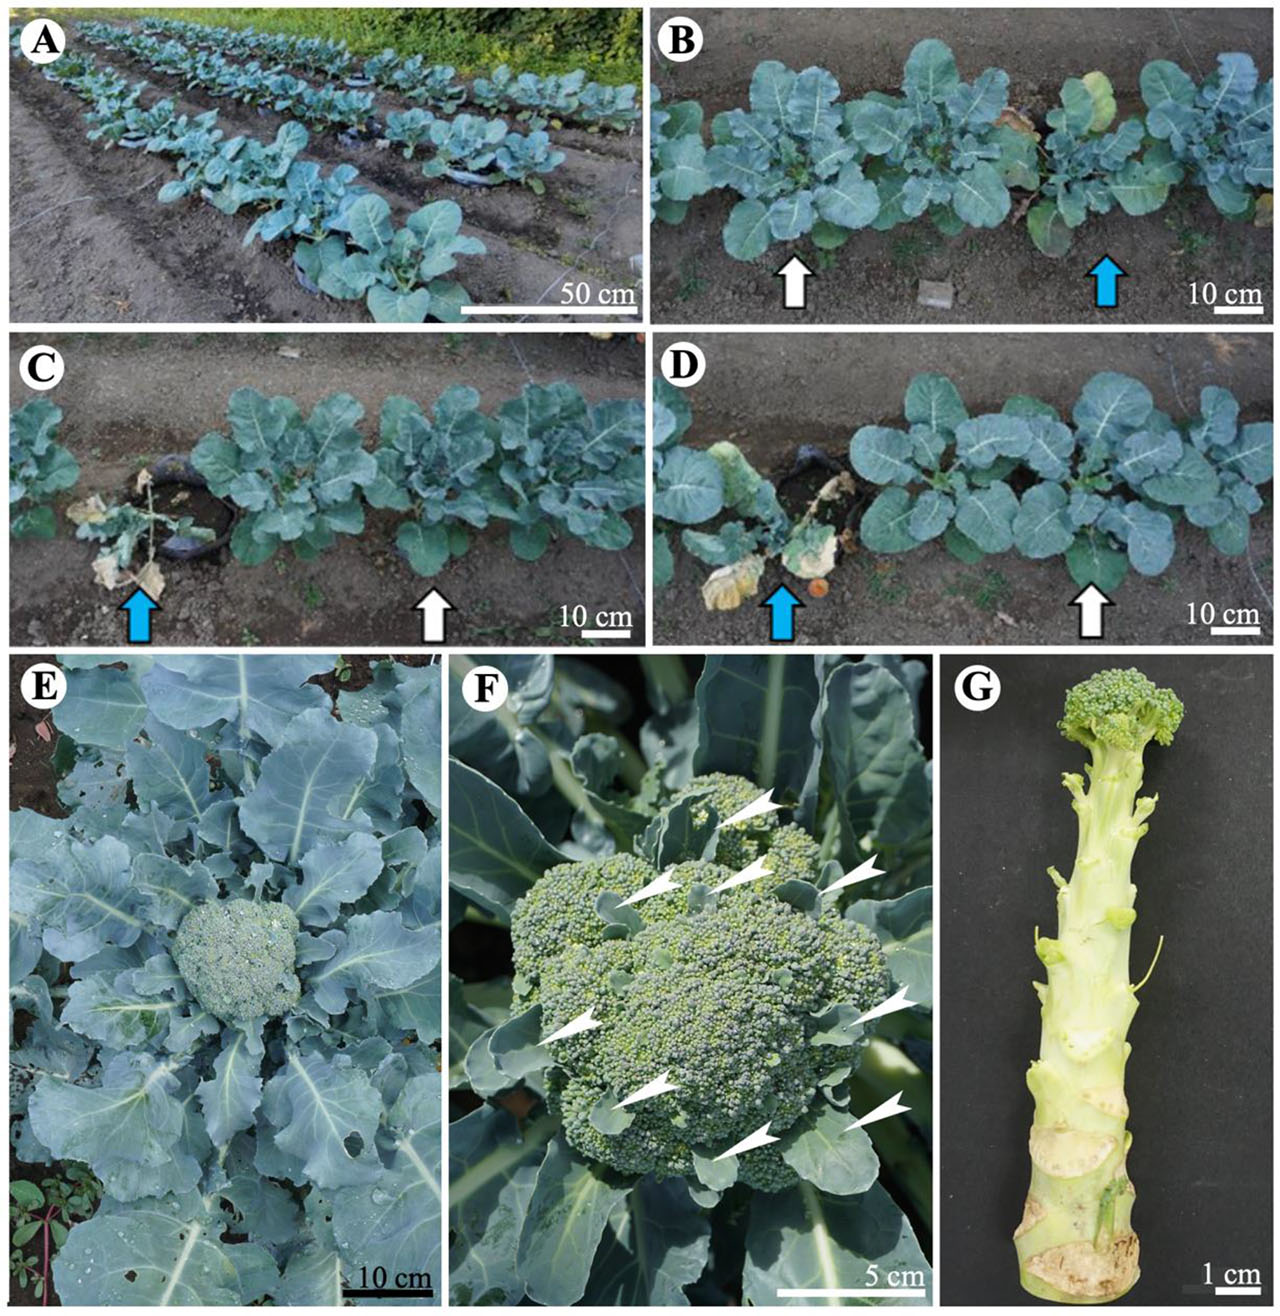
Figure 2.
The entire site of the field experiment (A), three broccoli cultivars on the 6th day after waterlogging treatment (71–74 days after sowing) in 2021 (white and blue arrows indicate CONT and WET, respectively): ‘Shigemori’ (B), ‘Sawayutaka’ (C), and ‘First Star’ (D), head of ‘Shigemori’ in CONT at harvest stage (E), “leafy” head of ‘Shigemori’ (white arrows indicate leafy symptom) in CONT (F), flower head of ‘First Star’ in WET (G)
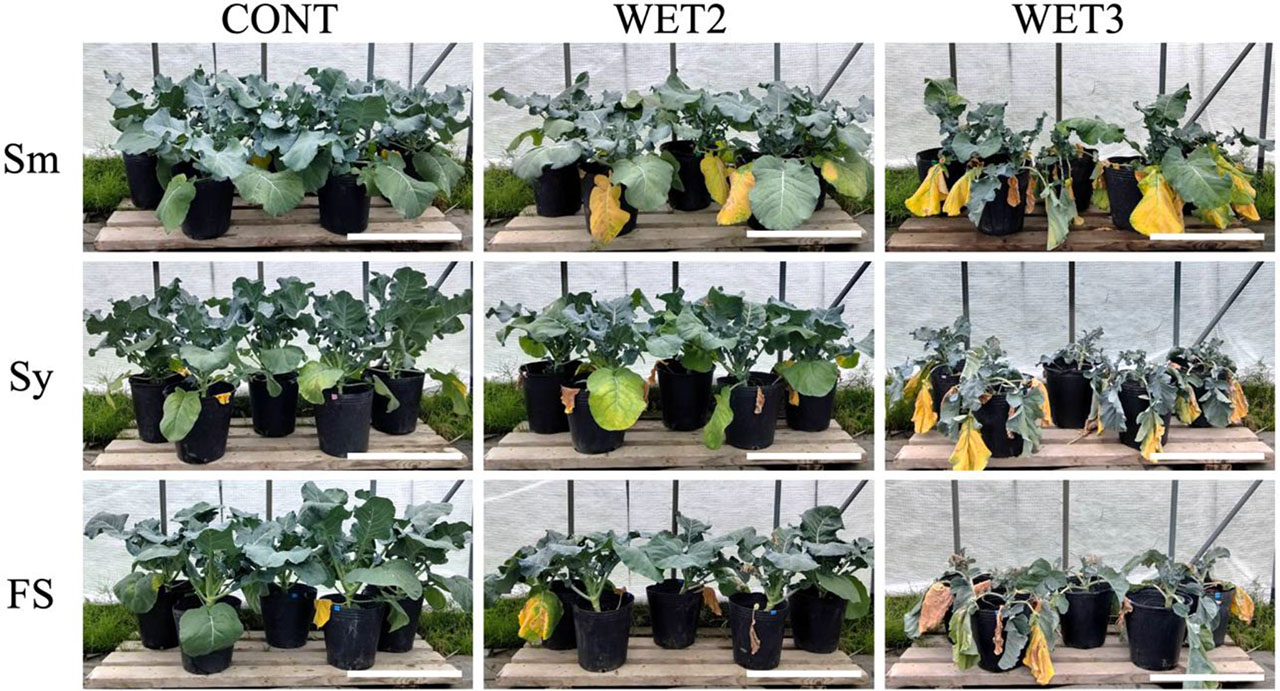
Figure 3.
Plants of three broccoli cultivars 5–6 days after waterlogging treatment (65–66 days after sowing) in the 2021 pot experiment (scale bars represent 50 cm)
Table 1.
Comparison of variables over years of experiment, treatments, and cultivars at 82–83 days after sowing (later growth stage) in the pot experiment
| Fresh weight (g FW)z | |||||||
|---|---|---|---|---|---|---|---|
| shoots | leaves | stems | |||||
| Year (Y) | 2020 | 445.9 ± 57.1 a | 291.2 ± 38.6 a | 154.7 ± 24.1 a | |||
| 2021 | 409.4 ± 39.0 a | 293.5 ± 28.0 a | 115.9 ± 14.6 b | ||||
| Treatment (T) | CONT | 668.2 ± 16.9 a | 452.1 ± 13.6 a | 216.1 ± 18.0 a | |||
| WET3 | 187.1 ± 23.0 b | 132.6 ± 18.1 b | 54.5 ± 6.9 b | ||||
| Cultivar (C) | Sm | 423.6 ± 45.2 a | 330.0 ± 35.2 a | 93.6 ± 10.9 b | |||
| Sy | 412.5 ± 63.9 a | 226.1 ± 32.0 b | 186.4 ± 33.4 a | ||||
| FS | 385.7 ± 69.5 a | 279.2 ± 51.3 ab | 106.5 ± 19.0 b | ||||
| ANOVAy | df | MS | Sig. | MS | Sig. | MS | Sig. |
| Y | 1 | 20018 | † | 79 | ns | 22613 | *** |
| T | 1 | 3471190 | *** | 1530891 | *** | 391652 | *** |
| C | 2 | 8368 | ns | 59574 | *** | 55733 | *** |
| Y × T | 1 | 138018 | ** | 45899 | ** | 24733 | ** |
| Y × C | 2 | 4530 | ns | 4079 | ns | 3374 | ns |
| T × C | 2 | 82750 | *** | 47534 | *** | 42691 | *** |
| Y × T × C | 2 | 5460 | ns | 410 | ns | 4386 | † |
different letters within each column indicate significant differences at the 5% level based on the Tukey–Kramer test;
df – degree of freedom, MS – mean square, Sig. – significance
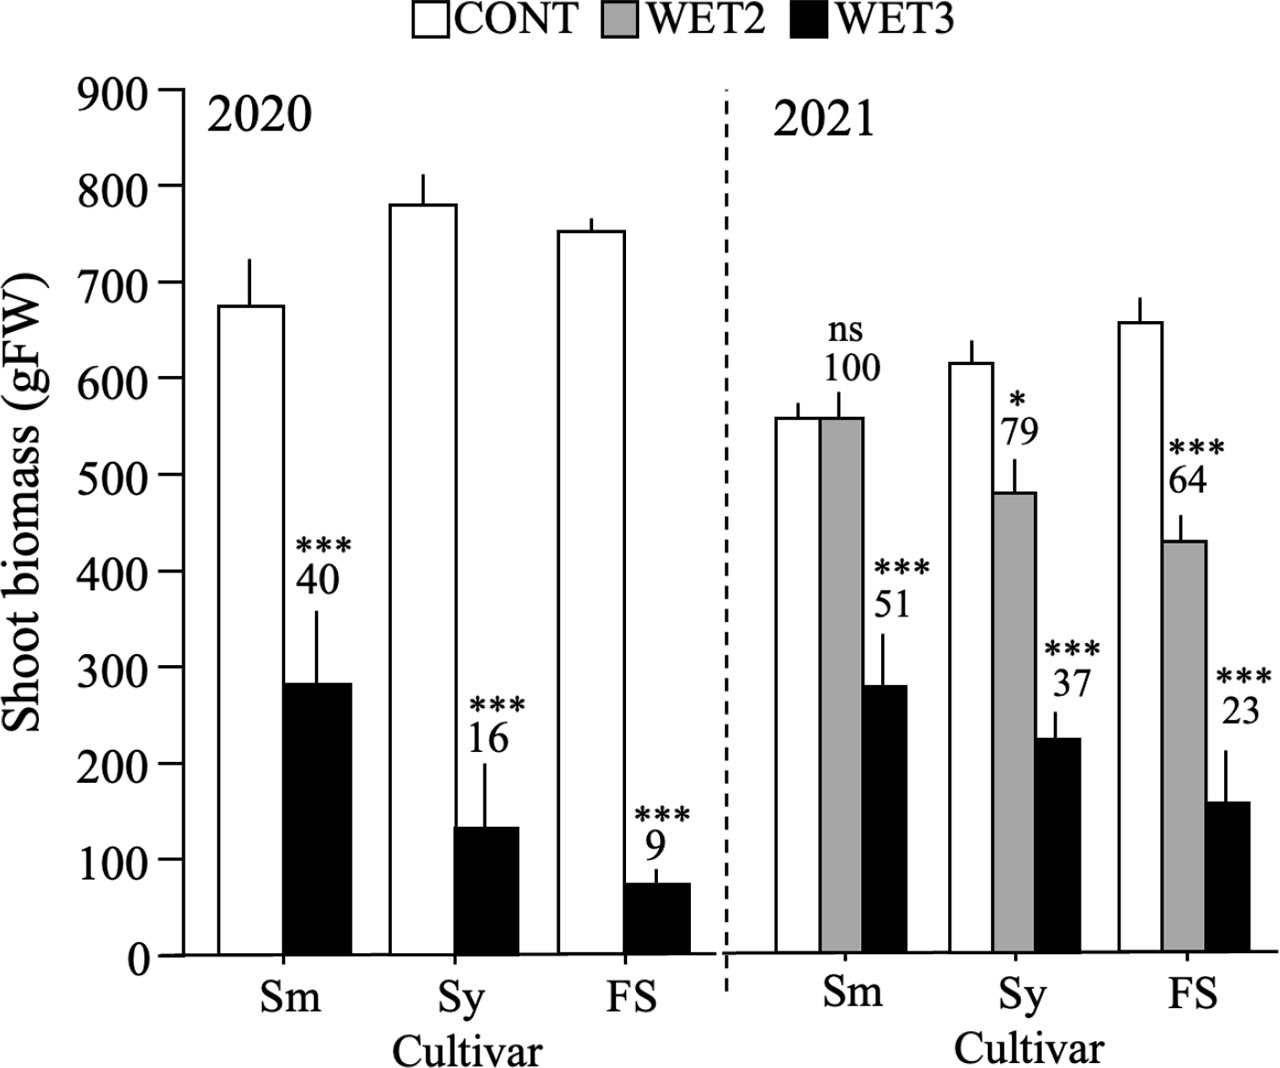
Figure 4.
Shoot fresh weight of three broccoli cultivars at 79–80 days after sowing in the 2020 and 2021 pot experiment
Sm – ‘Shigemori’, Sy – ‘Sawayutaka’, FS – ‘First Star’; the asterisks (*, ***) within a cultivar indicate significant differences from CONT at the 5% and 0.1% level according to Dunnett's test (n = 5), ns – nonsignificant; vertical bars represent standard errors; the number above the standard error shows the percentage compared with CONT of the same cultivar in the same experimental year; treatment WET2 was not conducted in 2020
Table 2.
Comparison of variables between treatments and cultivars at 65–66 days after sowing (just after wet treatment) in the 2021 pot experiment
| Water content (%)z | |||||||
|---|---|---|---|---|---|---|---|
| shoots | leaves | stems | |||||
| Treatment (T) | CONT | 88.5 ± 0.3 a | 88.5 ± 0.2 a | 88.1 ± 0.4 a | |||
| WET2 | 87.5 ± 0.1 a | 87.5 ± 0.1 a | 87.5 ± 0.3 a | ||||
| WET3 | 79.4 ± 0.7 b | 78.9 ± 0.7 b | 81.4 ± 0.7 b | ||||
| Cultivar (C) | Sm | 85.5 ± 0.9 a | 85.4 ± 1.1 a | 85.5 ± 0.6 a | |||
| Sy | 85.2 ± 1.5 a | 85.0 ± 1.5 a | 85.9 ± 1.2 a | ||||
| FS | 84.8 ± 1.5 a | 84.6 ± 1.5 a | 85.6 ± 1.2 a | ||||
| ANOVAy | df | MS | Sig. | MS | Sig. | MS | Sig. |
| T | 2 | 371.1 | *** | 418.3 | *** | 201.0 | *** |
| C | 2 | 1.9 | ns | 2.5 | ns | 0.9 | ns |
| T × C | 4 | 10.6 | * | 9.6 | * | 20.3 | * |
different letters within each column indicate significant differences at the 5% level based on the Tukey–Kramer test (treatment, n = 15; cultivar, n = 15);
df – degree of freedom, MS – mean square, Sig. – significance
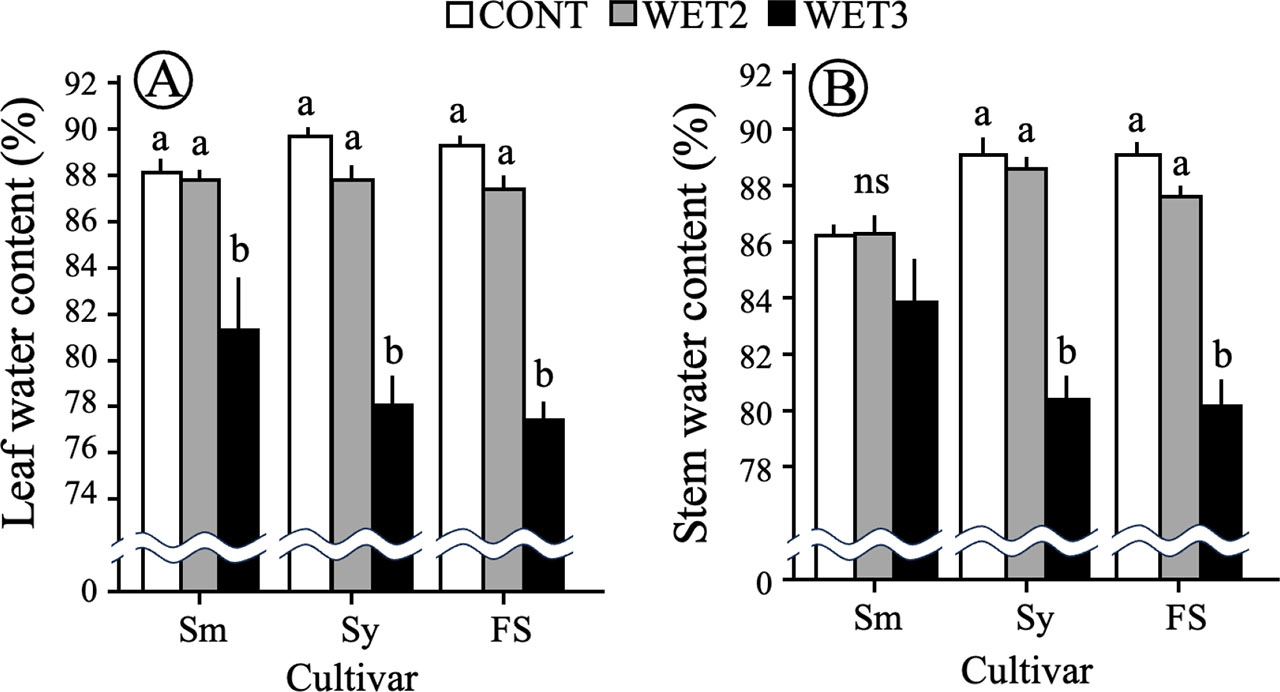
Figure 5.
Water content of leaf (A) and stem (B) of three broccoli cultivars at 65–66 days after sowing in the 2021pot experiment
Sm – ‘Shigemori’, Sy – ‘Sawayutaka’, FS – ‘First Star’; different letters within the same cultivar indicate significant differences at the 5% level according to the Tukey–Kramer test (n = 5), ns – nonsignificant; vertical bars represent standard errors
Table 3.
Comparison of variables between treatments and cultivars between 65–66 days after sowing (just after wet treatment) and 79–80 days after sowing (later growth stage) in the 2021 pot experiment
| CGR (g DW·m−2·d−1) | Mean LAI (m2·m−2) | NAR (g DW·m−2·d−1) | |||||
|---|---|---|---|---|---|---|---|
| Treatment (T) | CONT | 98.5 ± 2.8 a | 5.6 ± 0.2 a | 17.5 ± 0.6 a | |||
| WET2 | 76.1 ± 5.8 b | 5.0 ± 0.3 a | 15.5 ± 1.4 a | ||||
| WET3 | 7.1 ± 6.4 c | 3.1 ± 0.3 b | 0.6 ± 3.0 b | ||||
| Cultivar (C) | Sm | 70.9 ± 12.1 a | 5.3 ± 0.4 a | 12.2 ± 1.7 a | |||
| Sy | 51.0 ± 12.1 b | 4.3 ± 0.3 ab | 11.5 ± 2.2 a | ||||
| FS | 59.9 ± 14.1 b | 4.1 ± 0.5 b | 9.8 ± 4.6 a | ||||
| ANOVAy | df | MS | Sig. | MS | Sig. | MS | Sig. |
| T | 2 | 34010.8 | *** | 26.4 | *** | 1268.8 | *** |
| C | 2 | 1489.2 | * | 6.6 | *** | 22.4 | ns |
| T × C | 4 | 349.4 | ns | 1.7 | * | 165.9 | * |
[i] Note: see Table 2
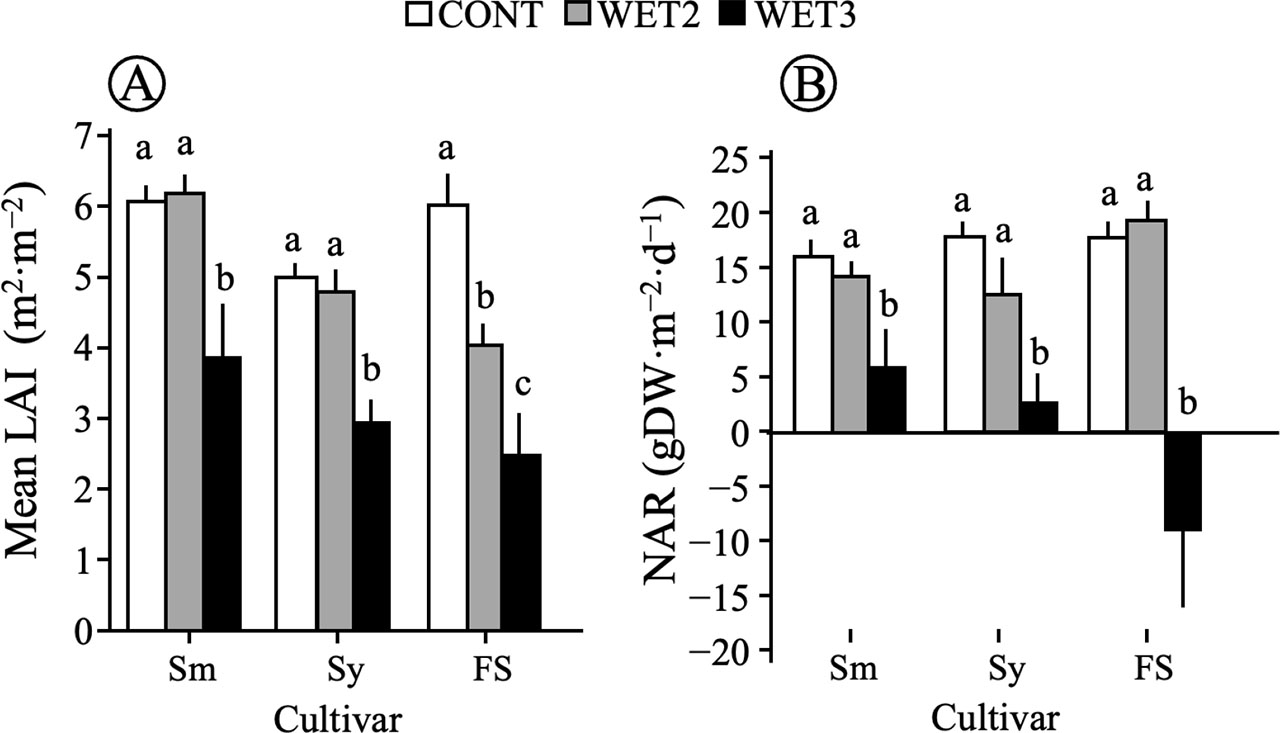
Figure 6.
Mean leaf area index (A) and net assimilation rate (B) of 3 broccoli cultivars calculated from the dry weight measurements between the wet treatment period (65–66 days after sowing) and the later growth stage (79–80 days after sowing) in the 2021 pot experiment
Note: see Figure 5
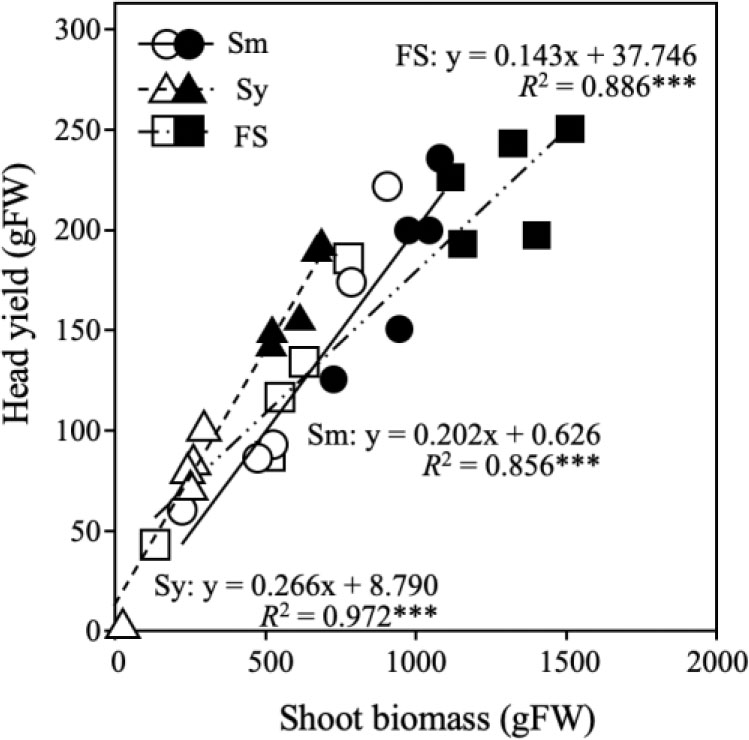
Figure 7.
Relationships between shoot biomass and flower head yield of broccoli at the harvest stage in the 2021 field experiment
Sm – ‘Shigemori’, Sy – ‘Sawayutaka’, FS – ‘First Star’; closed symbols represent the control group (CONT), opened symbols represent the wet treatment group (WET); the asterisks (***) represent significance in the regression analysis at the 0.1% level using Pearson correlation coefficient
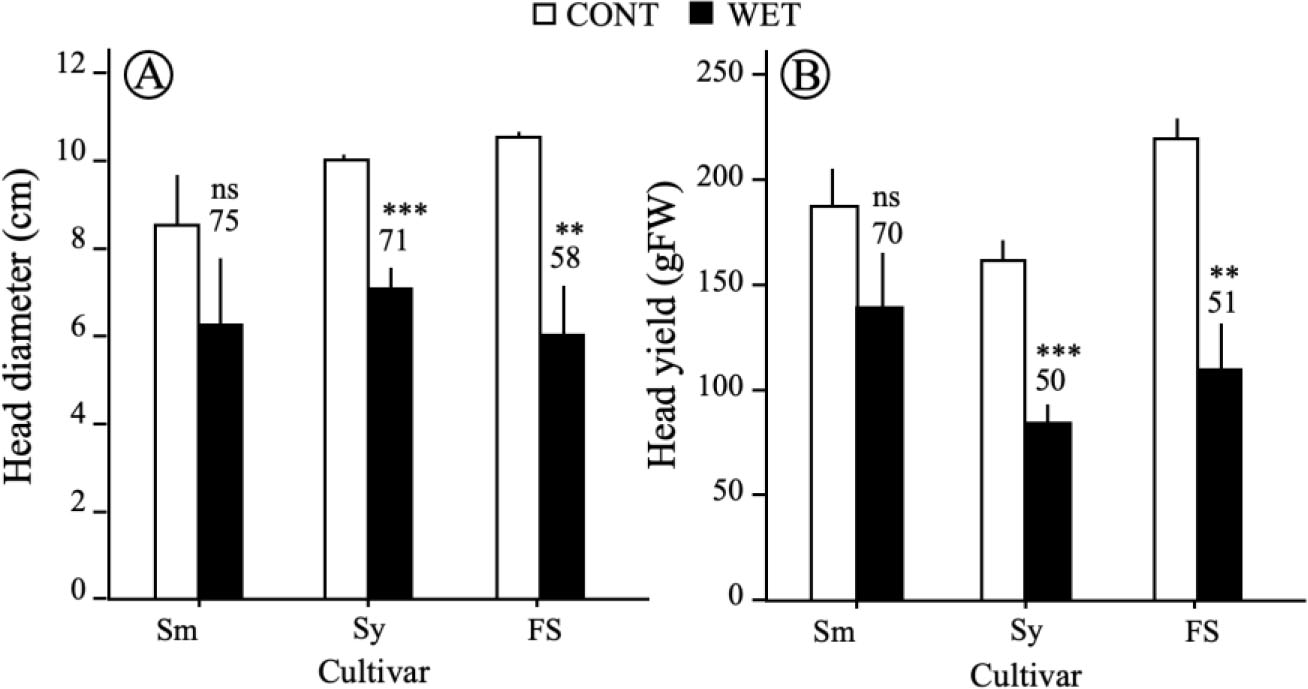
Figure 8.
Flower head diameter (A) and head yield (B) of three broccoli cultivars at harvest in the 2021 field experiment
Sm – ‘Shigemori’, Sy – ‘Sawayutaka’, FS – ‘First Star’; the asterisks (**, ***) within a cultivar indicate significant differences from CONT at the 1% and 0.1% level according to Student's t-test (n = 5), ns – nonsignificant; vertical bars represent standard errors; the number above the standard error shows the percentage compared with CONT of the same cultivar