
Figure 1
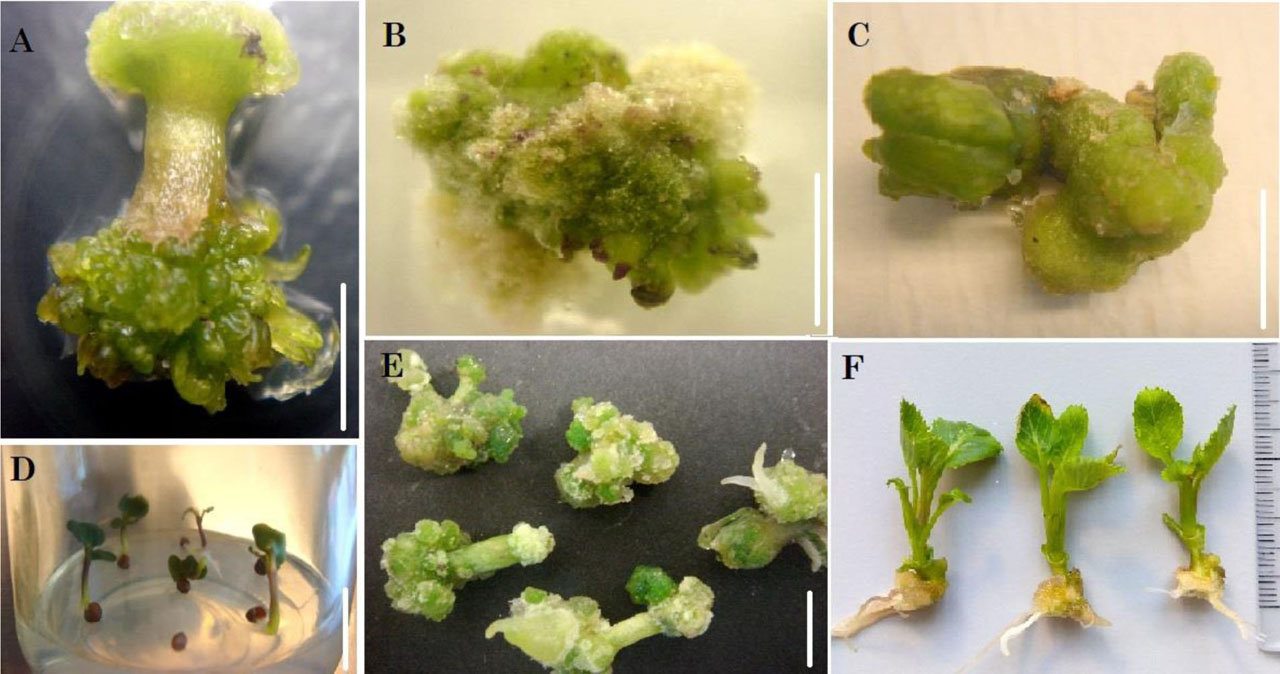
Organogenesis of cabbage in in vitro cultures: A – shoot induction from cut ends of treated hypocotyl on shoot induction medium in control (bar = 0.5 cm); B – shoot induction from trifluralin treated callus on shoot induction medium (bar = 0.5 cm); C – green dormant callus from treated calli on shoot induction medium (bar = 0.5 cm); D – germinating seeds treated with trifluralin after seven days on seed germination medium (bar = 1 cm); E – growing calli from treated hypocotyls after 14 days on shoot induction medium (bar = 0.5 cm); F – rooted shootlets derived from treated seeds
Table 1
Results of ANOVA to test the influence of cultivar, trifluralin concentration, treatment condition on in vitro culture of cabbage starting from seeds
| Trait | Effect | MS | F | P |
|---|---|---|---|---|
| Rate of seed germination | cultivar | 11339.3 | 87.4 | 0.0000* |
| trifluralin concentration | 33654.1 | 259.3 | 0.0000* | |
| treatment condition | 7613.4 | 58.668 | 0.0000* | |
| treatment condition × cultivar | 638.6 | 4.9213 | 0.0000* | |
| treatment condition × concentration | 382.4 | 2.9465 | 0.0015* | |
| concentration × cultivar | 925.4 | 7.131 | 0.000* | |
| treatment × concentration × cultivar | 237.4 | 1.829 | 0.00262* | |
| Shoots per germinated seed | cultivar | 17.91 | 2.813 | 0.014* |
| trifluralin concentration | 4.4 | 0.692 | 0.5990 | |
| treatment condition | 6.5 | 1.021 | 0.3867 | |
| treatment condition × cultivar | 10.05 | 1.5795 | 0.0799 | |
| treatment condition × concentration | 9.34 | 1.4674 | 0.1492 | |
| concentration × cultivar | 9.53 | 1.4972 | 0.0860 | |
| treatment × concentration × cultivar | 6.96 | 1.094 | 0.337 | |
| Rate of root induction | cultivar | 10575.3 | 47.1 | 0.0000* |
| trifluralin concentration | 23284.8 | 103.6 | 0.0000* | |
| treatment condition | 6557.2 | 29.186 | 0.0000* | |
| treatment condition × cultivar | 377.3 | 1.6793 | 0.05559 | |
| treatment condition × concentration | 717.0 | 3.1912 | 0.00068* | |
| concentration × cultivar | 1636.5 | 7.2842 | 0.0000* | |
| treatment × concentration × cultivar | 446.7 | 1.988 | 0.000749* |
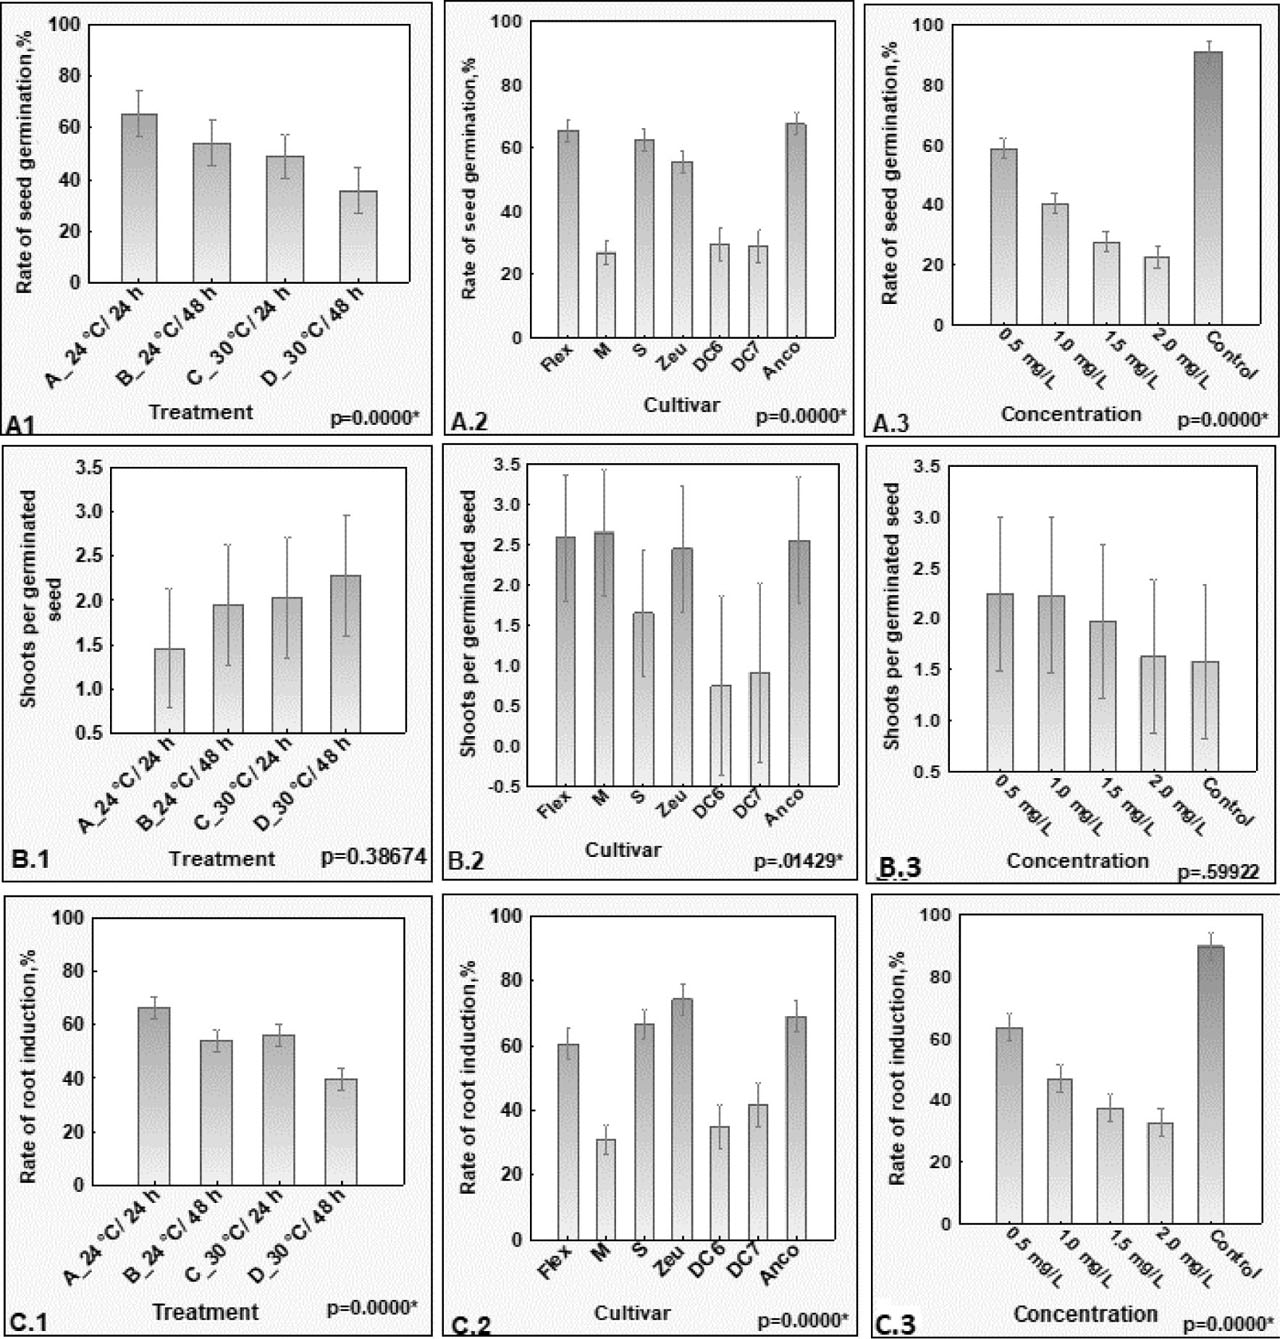
Figure 2
Effect of cultivar, trifluralin concentration, treatment condition on in vitro culture of seeds and their interaction with each other: A1, B1, C1 – the effect of different treatment conditions on the rate of seed germination, shoot induction, and root induction respectively; A2, B2, C2 – the effect of different cultivars on the rate of seed germination, shoot induction, and root induction respectively; A3, B3, C3 – the effect of different concentrations of trifluralin on seed germination, shoot induction, and root induction respectively. Vertical bars denote 0.95 confidence intervals