
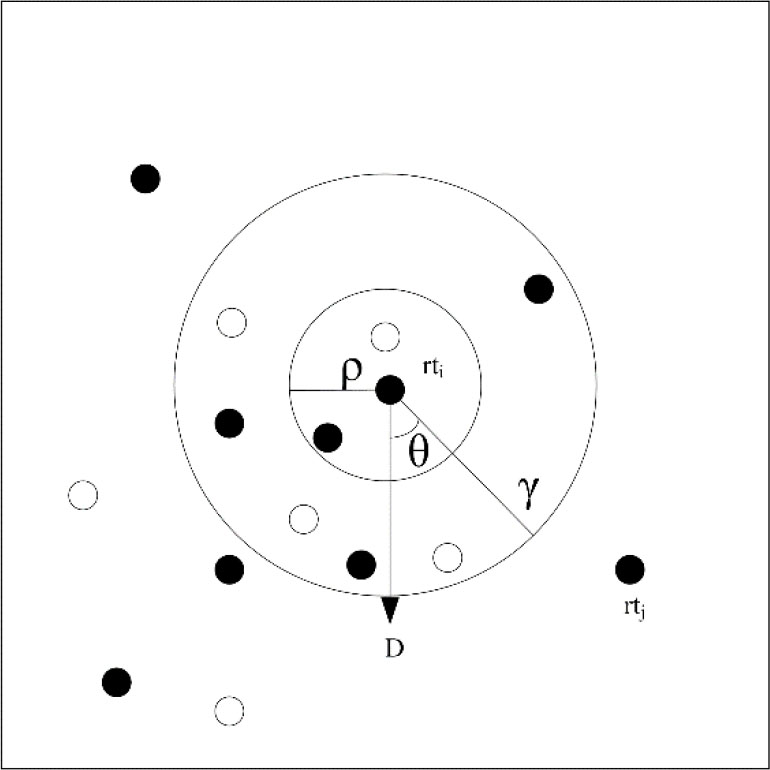
Fig. 1
Schema of neighboring single roots. rti defines the position of the ith single root, D defines the growth direction of the ith single root, black circles represent single root tips, and white circles represent nutrient particles
Table 1
Parameters used in the study
| Model parameter | Value | Unit | Description |
|---|---|---|---|
| Root growth period | 20 | day | Steps of simulation |
| Root initial radius | 0.0018 | m | Root radius at the initiation of the root |
| Root initial position | (0.25, 0.15, 0.25) | - | Root tip position at the initiation of the root |
| E | 12 | per day | Slope of growth rate versus diameter (Pagès 2011) |
| dmin | 0.0002 | m | Minimum diameter (Pagès 2011) |
| dmax | 0.0018 | m | Maximum diameter (Pagès 2011) |
| ipd | 0.0012 | m | Interprimordium distance (Pagès 2011) |
| plre | 0.7 | - | Potential probability of lateral root emergence (Araya et al. 2016) |
| σ | 2 | - | Variation in diameter of branch root (Pagès 2011) |
| ρ | 0.01 | m | Radius of repulsive volume (Henke et al. 2014) |
| γ | 0.05 | m | Radius of attractive volume (Henke, et al. 2014) |
| θ | 65 | ° | Opening angle of the cone within which the nutrient particle is absorbed (Henke et al. 2014) |
| Gravitropic intensity | 0.15 | - | Intensity of gravitropism (Henke et al. 2014) |
| Intensity of D′ | 0.75 | - | Intensity with which the root turns by the swarming behavior (Henke et al. 2014) |
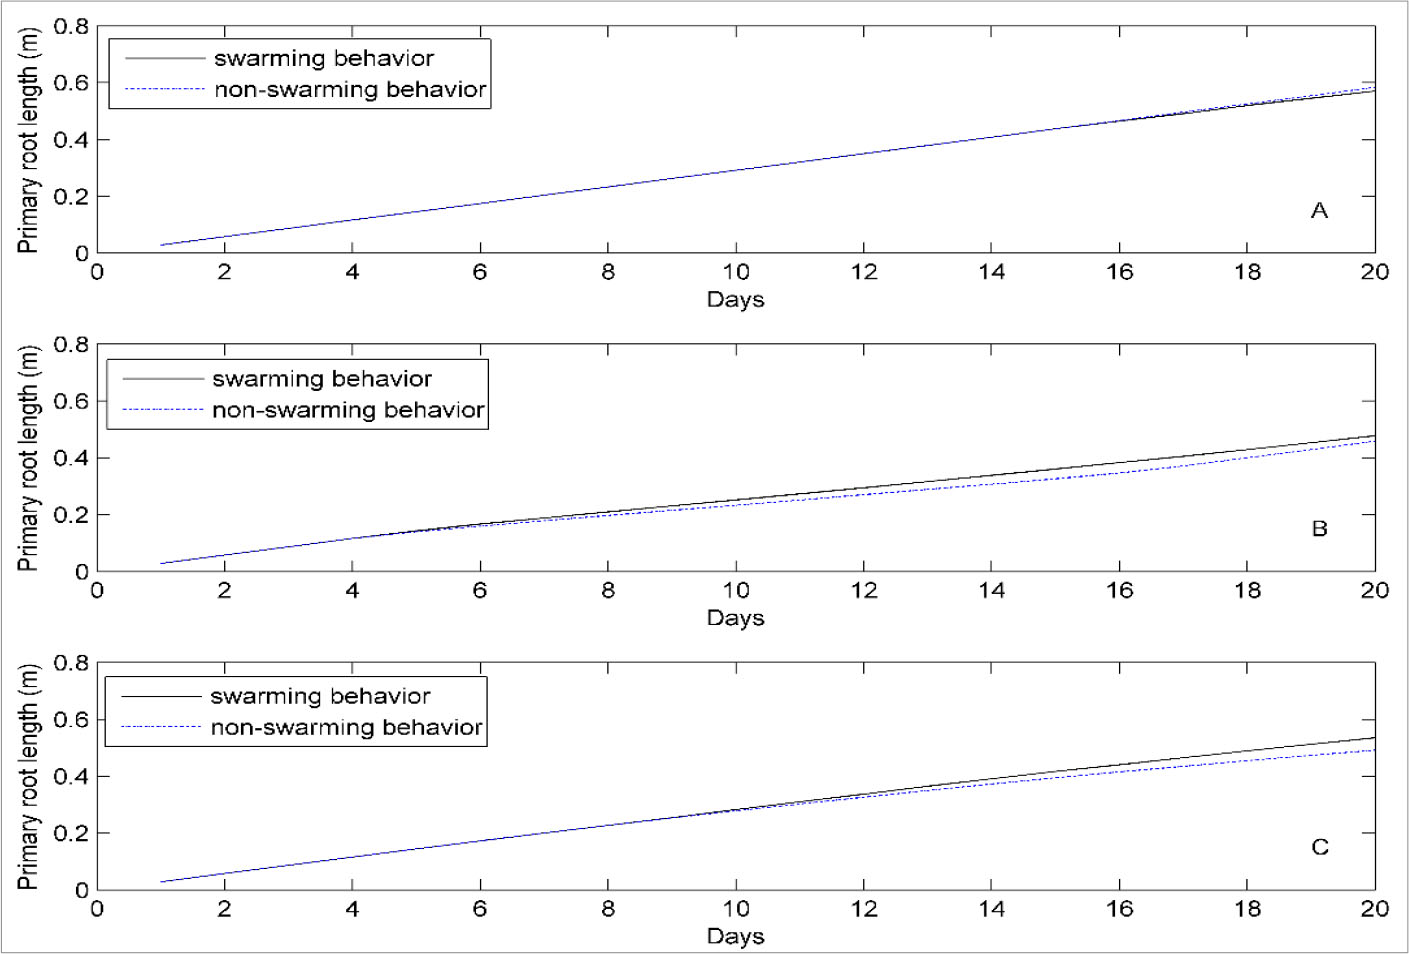
Fig. 2
Effect of swarming behavior on primary root lengths; primary root lengths in (a) random (p = 0.174), (b) layer (p = 0.003), and (c) gradient (p = 0.00) distributions
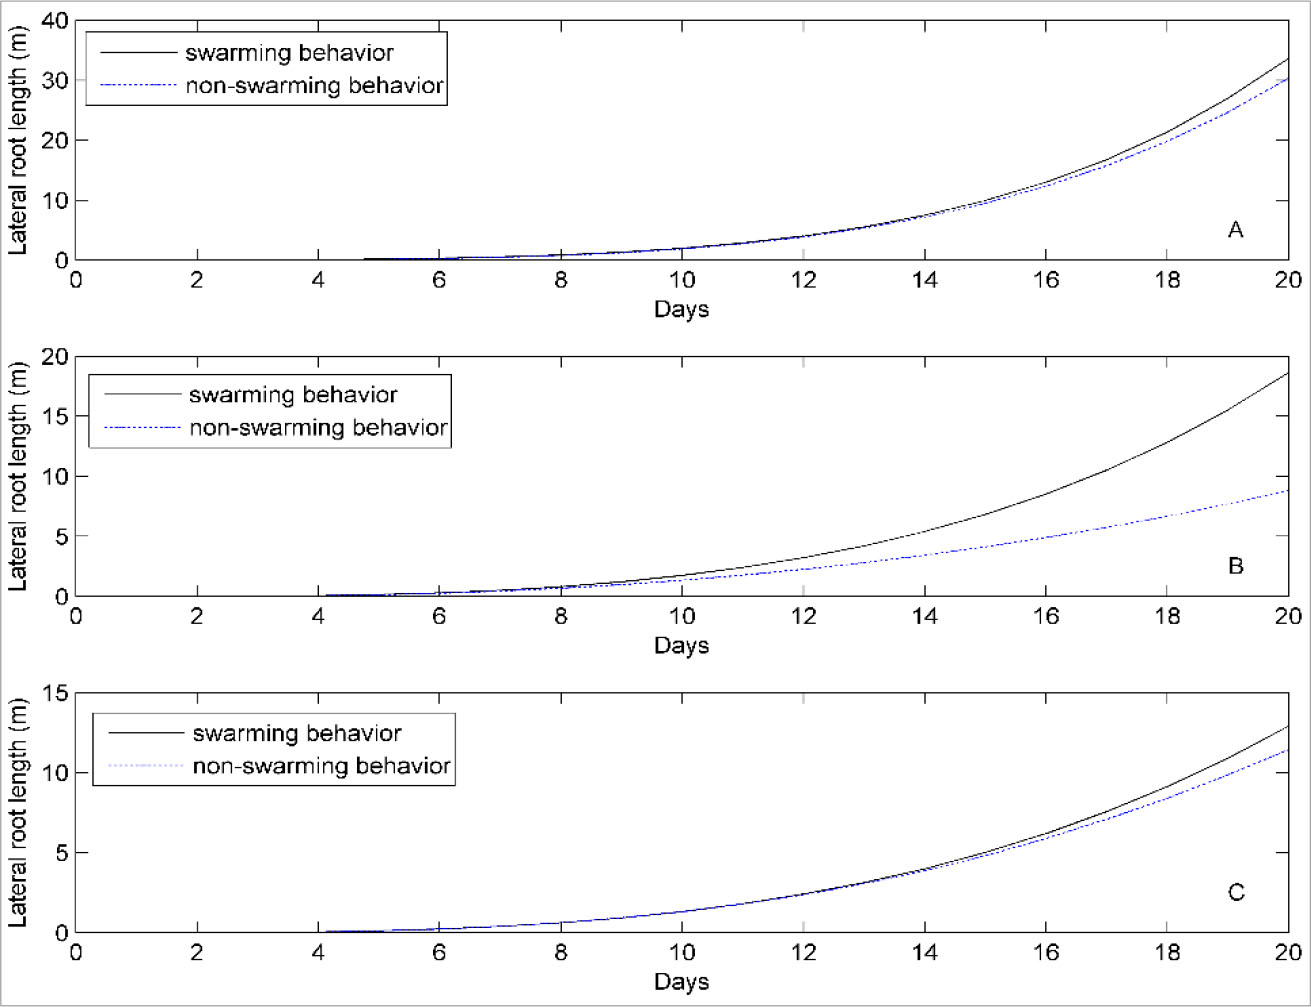
Fig. 3
Effect of the swarming behavior on the lateral root length; lateral root lengths in the (a) random (p = 0.591), (b) layer (p = 0.00), and (c) gradient (p = 0.491) distributions
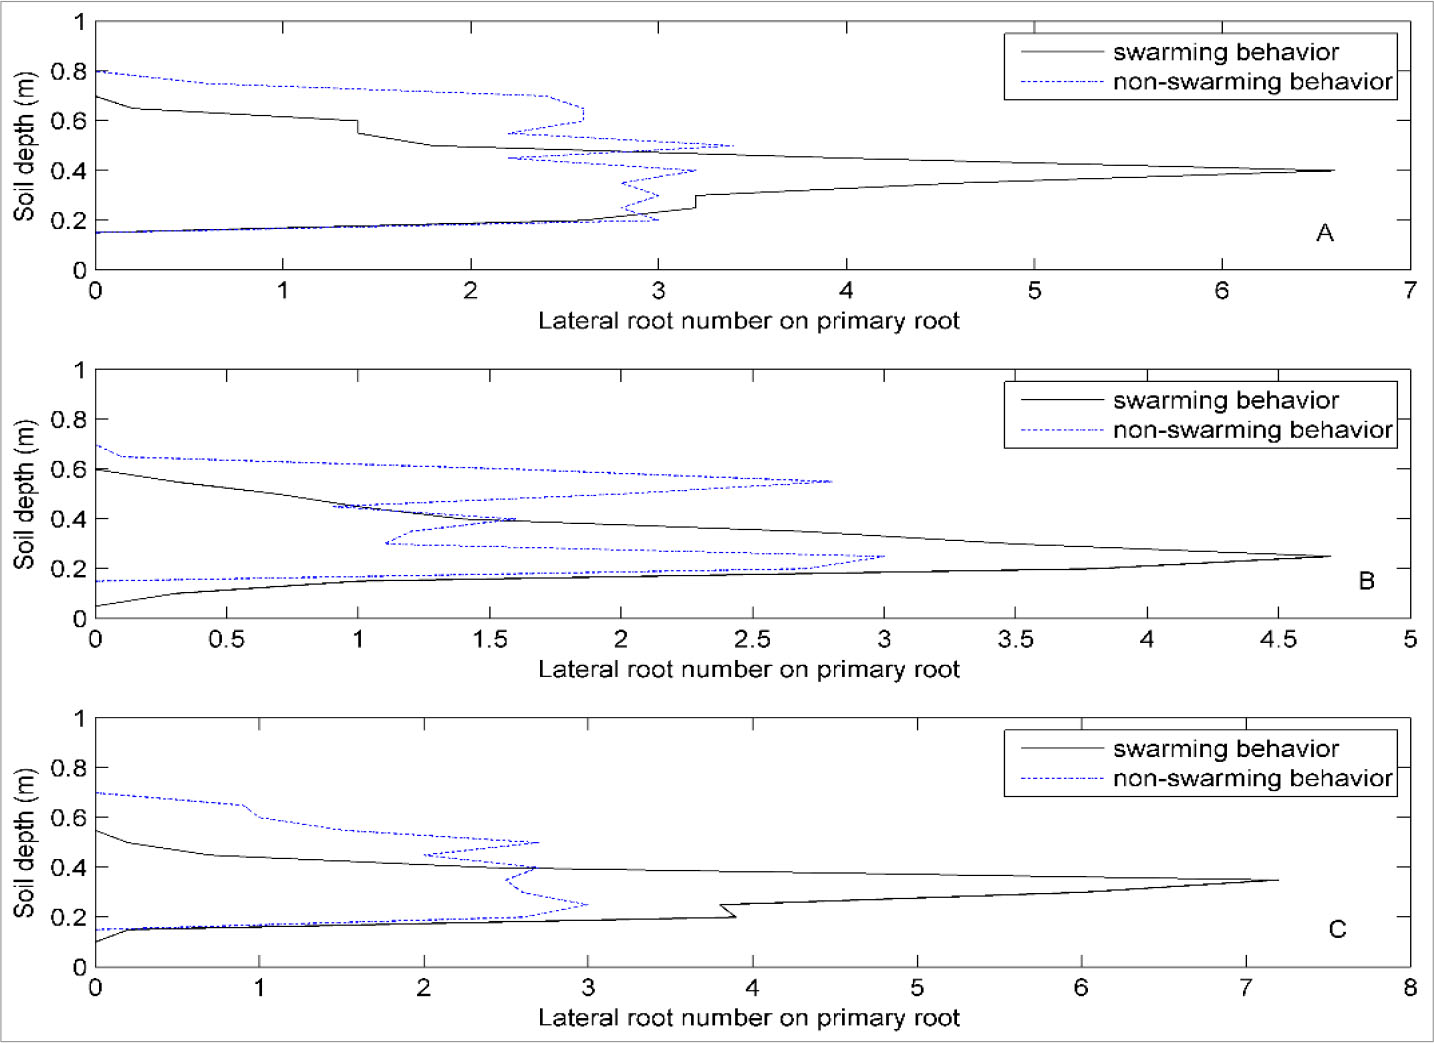
Fig. 4
Effect of swarming behavior on profiles of the lateral root number on the primary root; profiles of the lateral root number on the primary root in the (a) random, (b) layer, and (c) gradient distributions
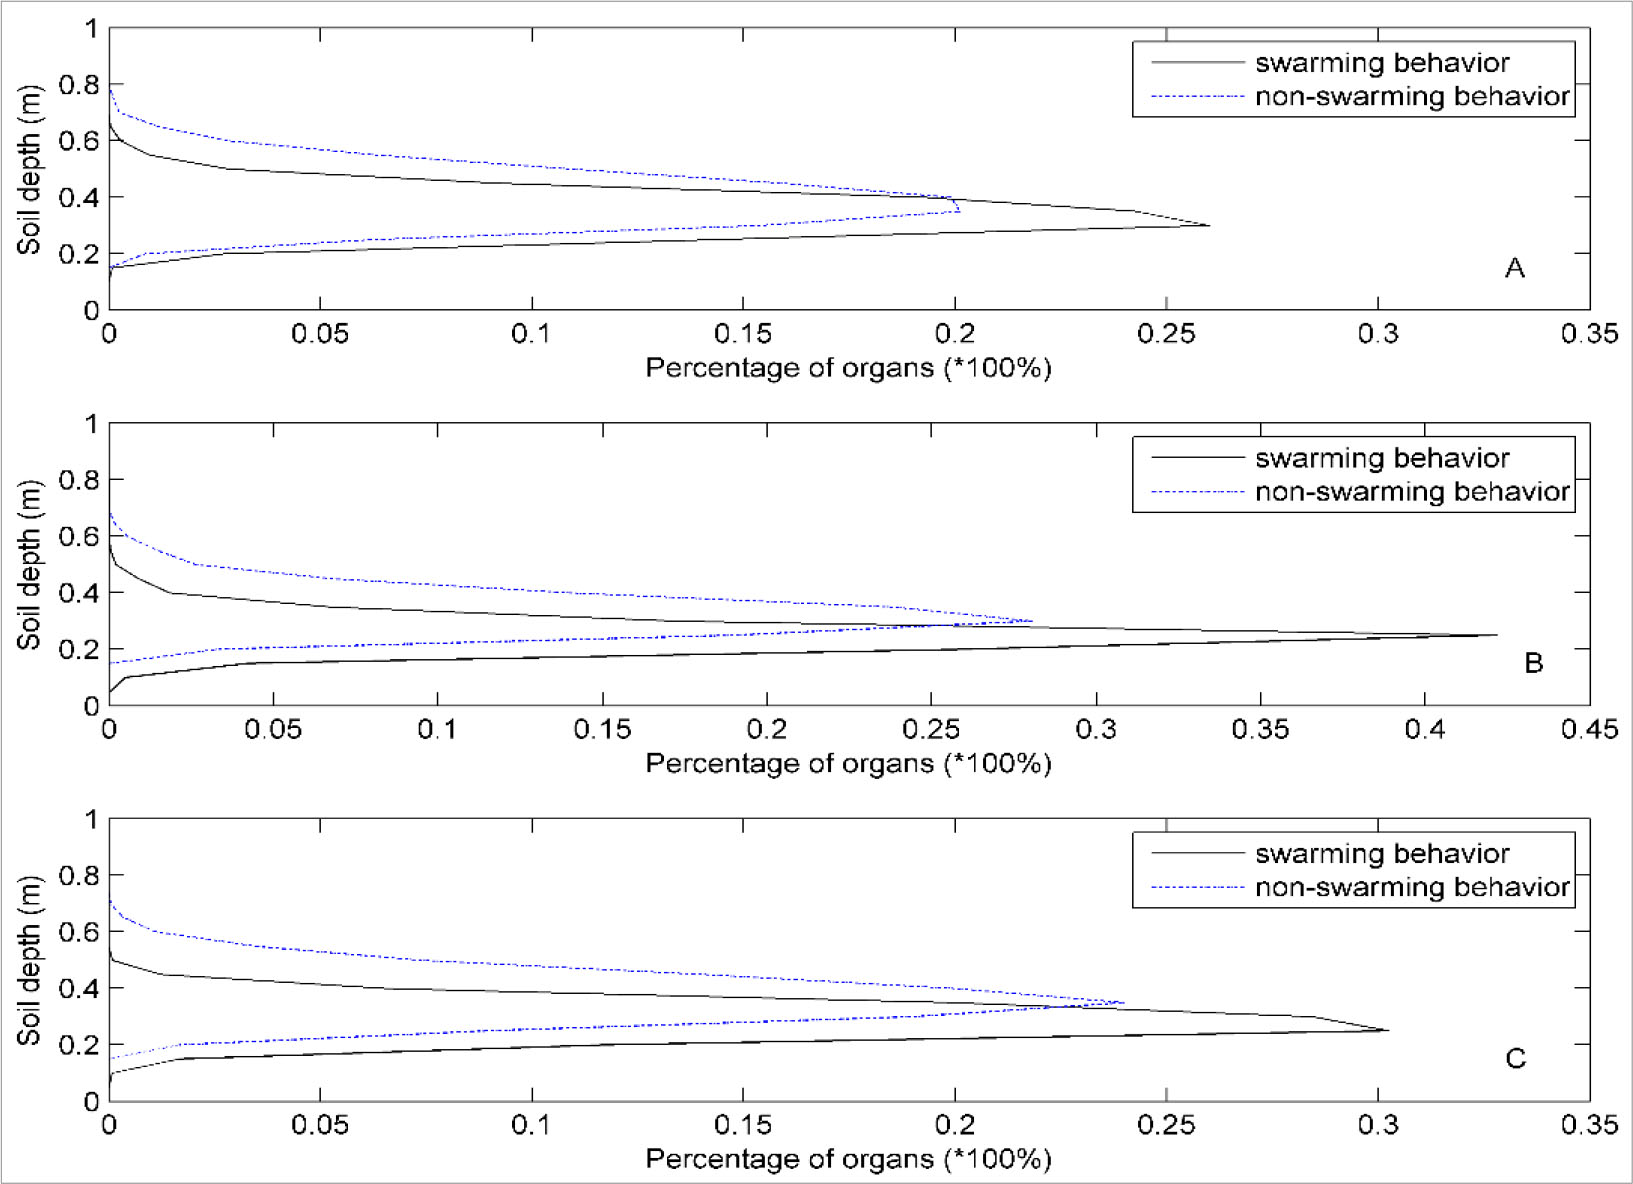
Fig. 5
Effect of swarming behavior on the root system profile; root system profiles in the (a) random, (b) layer, and (c) gradient distributions
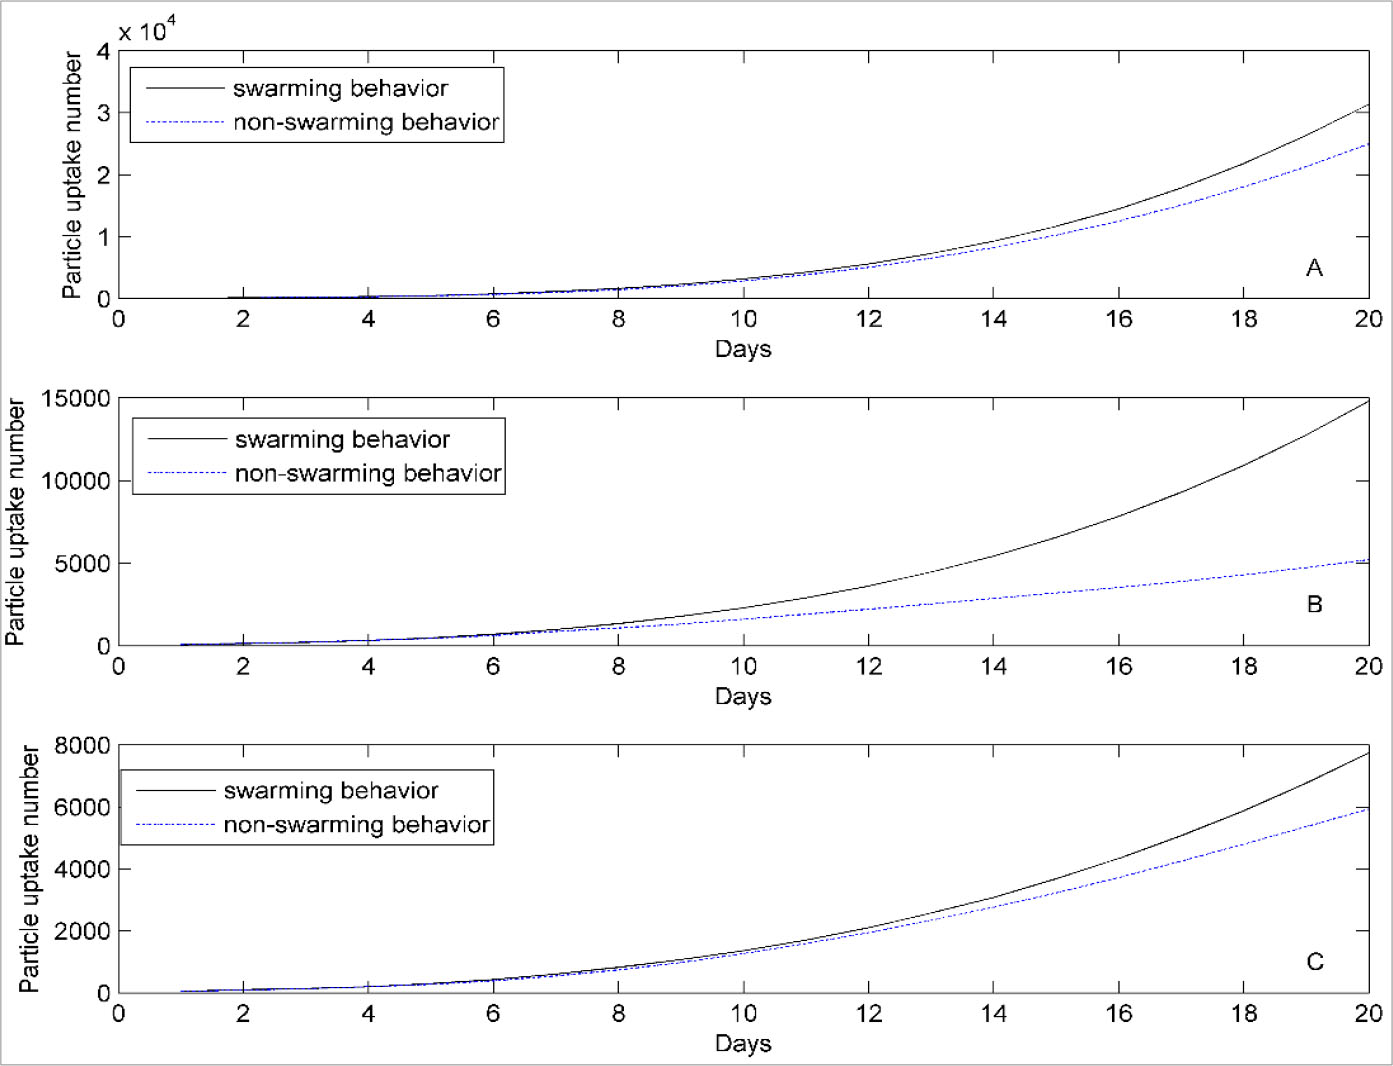
Fig. 6
Effect of swarming behavior on the resource particle uptake; resource particle uptake in the (a) random (p = 0.069), (b) layer (p = 0.00), and (c) gradient (p = 0.00) distributions
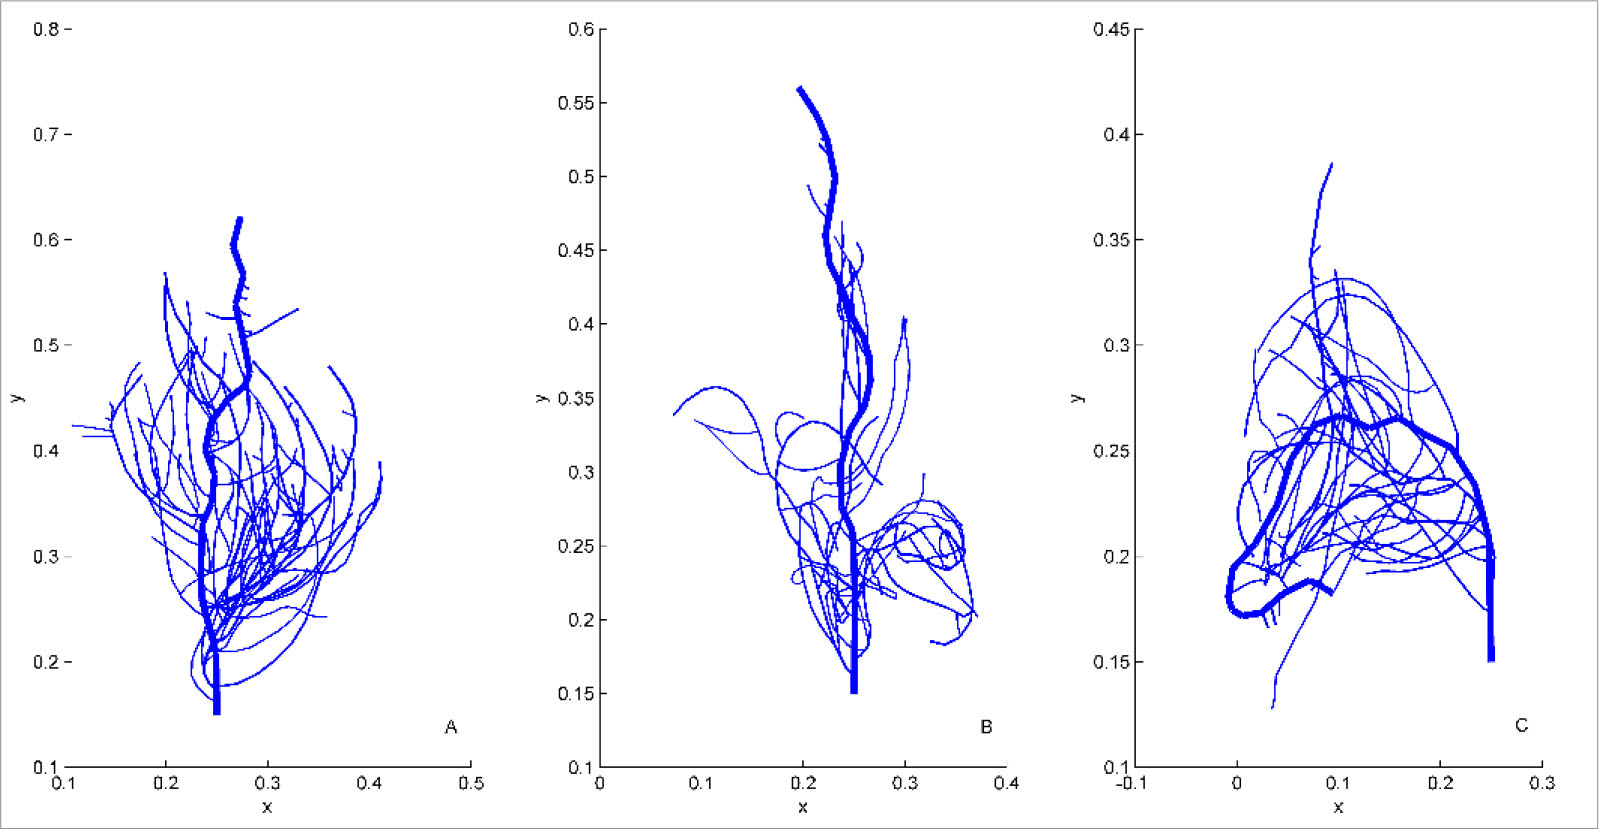
Fig. 7
Effect of swarming behavior on root growth directions; root (radius > 0.001 m) growth direction in the (a) random, (b) layer, and (c) gradient distributions