
Table 1:
Morphometrics of Xiphinema baliense sp. nov. from Bali. Except body length (mm), all measurements in μm and in format mean ± standard deviation (range).
| Trait* | Holotype | Holotype + paratype females | Females for molecular analyses** | J1 | J2 | J3 | J4 |
|---|---|---|---|---|---|---|---|
| 14 | 6 | 3 | 3 | 5 | 6 | ||
| L | 2.2 | 2.1 ± 0.09 (2.0–2.4) | 2.2 ± 0.05 (2.1–2.3) | 0.74 (0.7–0.77) | 1.0 (0.9–1.2) | 1.3 ± 0.05 (1.2–1.3) | 1.7 ± 0.09 (1.6–1.9) |
| a | 55.0 | 52.7 ± 2.1 (49–57) | 61.1 ± 3.0 (57–64) | 37.7 (35–39) | 41.4 (39–43) | 43.3 ± 2.52 (40–48) | 49.5 ± 4.8 (44–59) |
| b | 6.3 | 6 ± 0.4 (5.3–6.6) | 6.5 ± 0.41 (5.8–6.9) | 3.7 (3.3–4.3) | 3.7 (3.2–4.3) | 4.2 ± 0.24 (3.8–4.5) | 4.7 ± 0.1 (4.6–4.8) |
| c | 74.0 | 77 ± 3.7 (71–86) | 71.9 ± 3.4 (68–77) | 20.7 (19.7–21) | 25.6 (23–30) | 34.4 ± 2.48 (30–38) | 49.8 ± 3.97 (42–54) |
| c′ | 1.2 | 1.1 ± 0.08 (1–1.24) | 1.2 ± 0.11 (1.1–1.3) | 2.75 (2.57–3) | 2.33 (2.1–2.5) | 1.9 ± 0.17 (1.7–2.2) | 1.48 ± 0.12 (1.36–1.68) |
| V | 53.0 | 53 ± 1 (52–55) | 52 ± 0.9 (50–53) | - | - | - | - |
| Odontostyle length | 112 | 113 ± 3.52 (106–118) | 110 ± 4.6 (102–115) | 50 (43–54) | 69.3 (64–72) | 84.2 ± 6.6 (76–95) | 97.3 ± 4.23 (92–106) |
| Odontophore length | 60 | 58.7 (55–62) | 55.1 ± 2.8 (52–60) | - | - | - | |
| Total stylet length | 172 | 172 ± 3.7 (165–178) | 165.1 ± 6.5 (155–172) | - | - | - | |
| Replacement odontostyle | - | - | - | 61 (51–66) | 87.7 (74–98) | 99.2 ± 4.4 (95–107) | 115.7 ± 3.25 (111–119) |
| Anterior end to guide ring | 103 | 99.3 ± 2.75 (96–103) | 89.2 ± 4.8 (80–94) | - | - | - | |
| Tail length | 30.0 | 27.9 ± 1.78 (24–31) | 30.4 ± 1.59 (29–33) | 35.7 (35–36) | 39.3 (38–40) | 36.6 ± 2.65 (33–40) | 34 ± 2.89 (30–39) |
| Hyaline part of tail length | 7.0 | 6.9 ± 0.83 (6–8) | 12.3 ± 0.4 (12–13) | - | - | - | |
| Width at level of: | |||||||
| lip region | 12.0 | 12 ± 0.0 (12–12) | 11.4 ± 0.4 (11–12) | 9 (9–9) | 9.3 (9–10) | 10.2 ± 0.4 (10–11) | 10.7 ± 0.47 (10–11) |
| vulva or mid-body | 40.0 | 40.6 ± 1.8 (37–45) | 35.8 ± 1.9 (34–39) | 19.7 (18–21) | 24.3 (22–28) | 29 ± 2.45 (25–32) | 34.3 ± 3.54 (28–39) |
| Anus | 25.0 | 27.8 ± 1.76 (24–31) | 25.4 ± 2.1 (22–28) | 13 (12–14) | 17 (16–19) | 19.2 ± 0.98 (18–20) | 23 ± 2.16 (19–26) |
* Abbreviations are defined in Jairajpuri and Ahmad (1992).
** These specimens were fixed in 1M NaCl and not TAF, as the rest of the specimens from this table. As the impact of the fixative on the morphometry is well known, measurements from this column cannot be directly compared with the other ones. Additionally, differences in storing conditions (frozen vs room temperature) could have affected morphometrics.
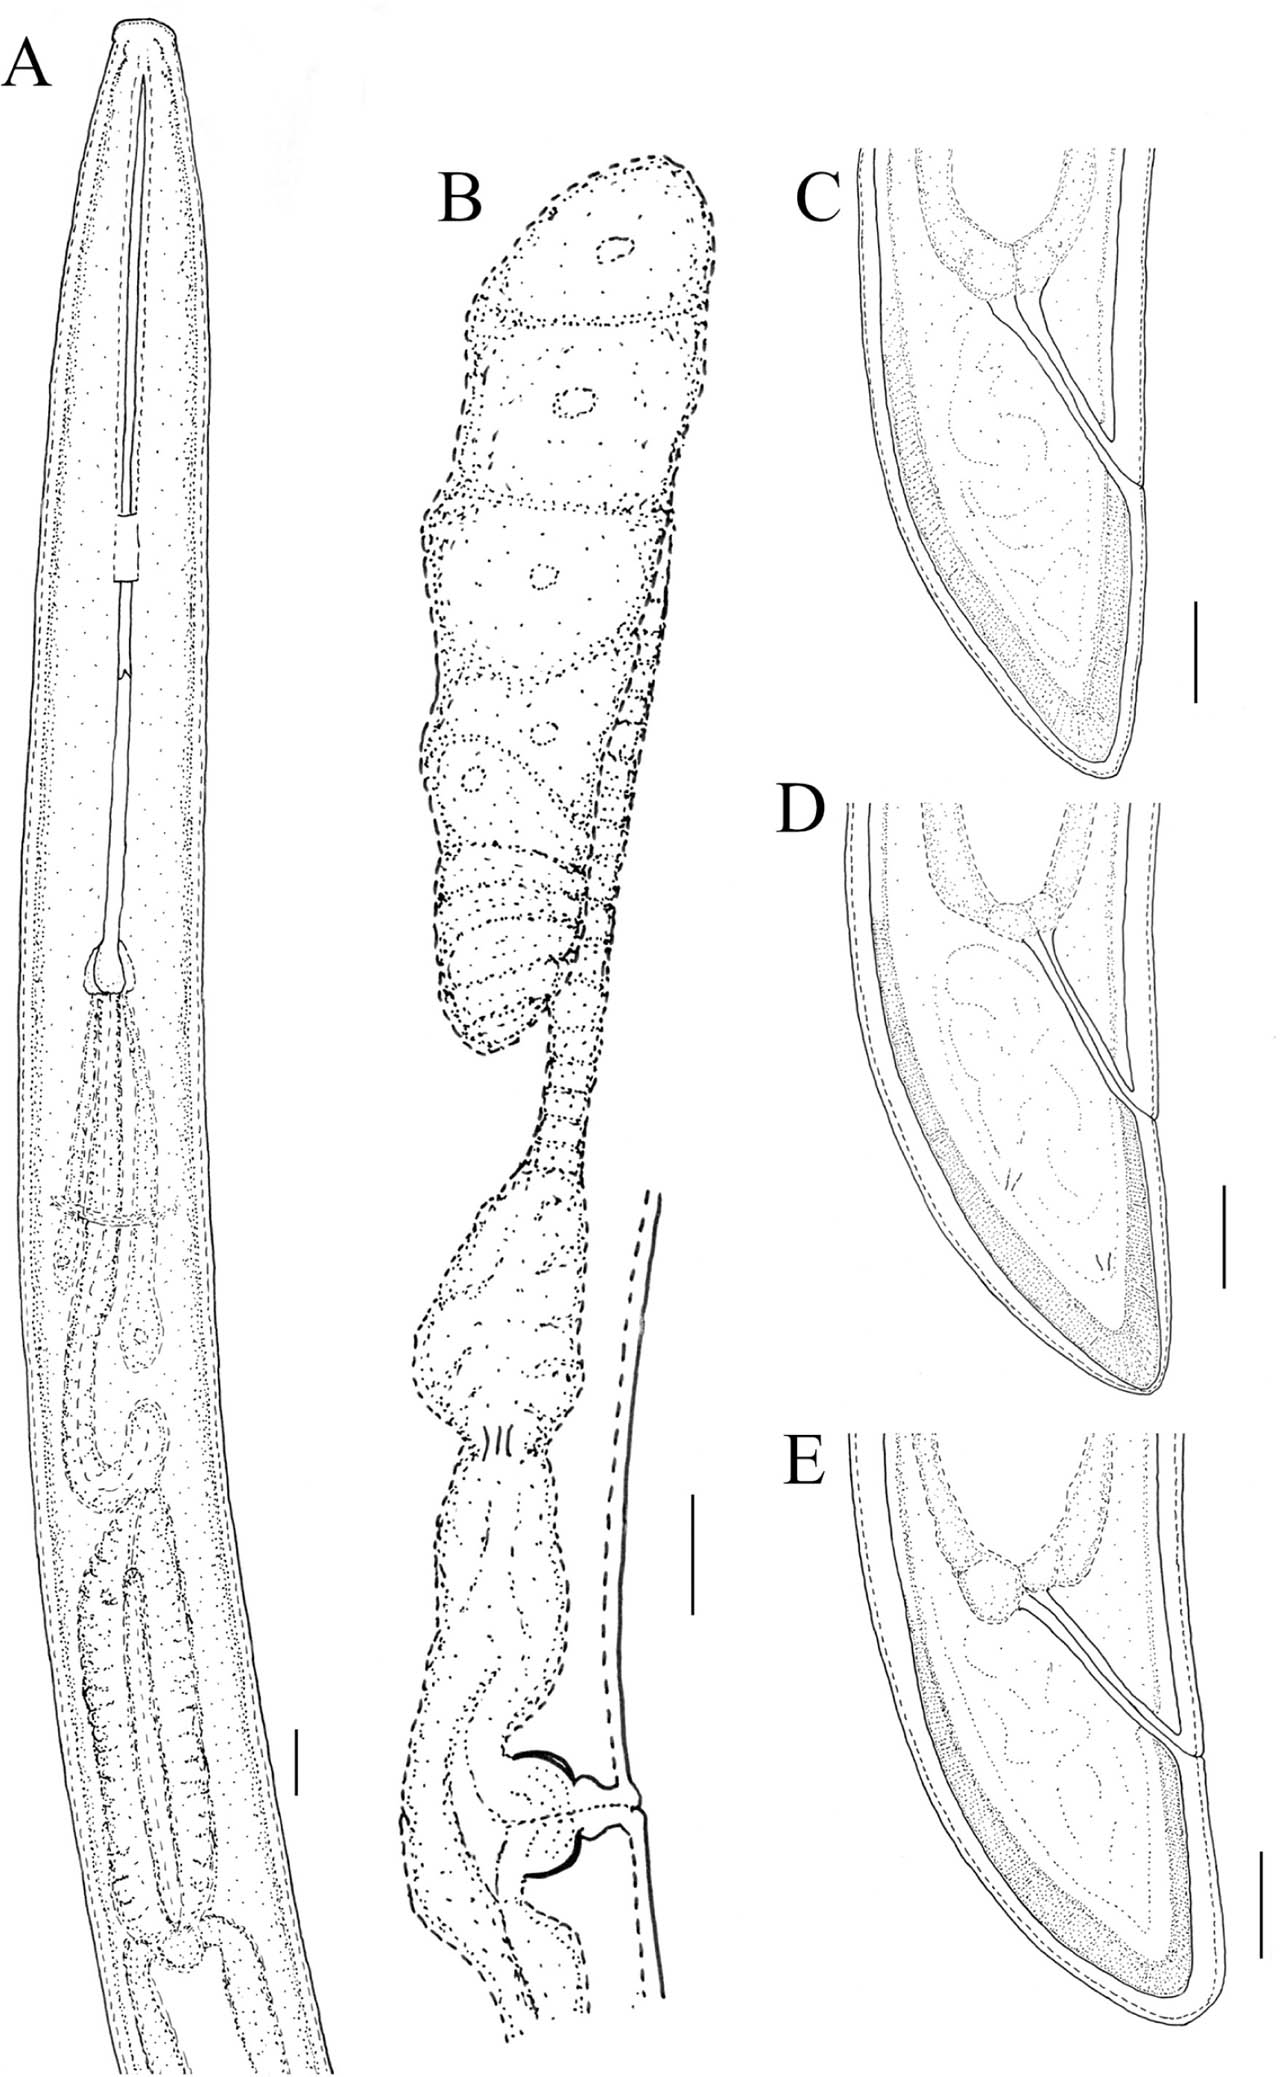
Figure 1:
Line drawings of Xiphinema baliense sp. nov. (A–E): A) anterior body part; B) anterior genital branch; C–E variation in tails shape. Pictures A–C illustrate the holotype. Scale bar: 10μm.
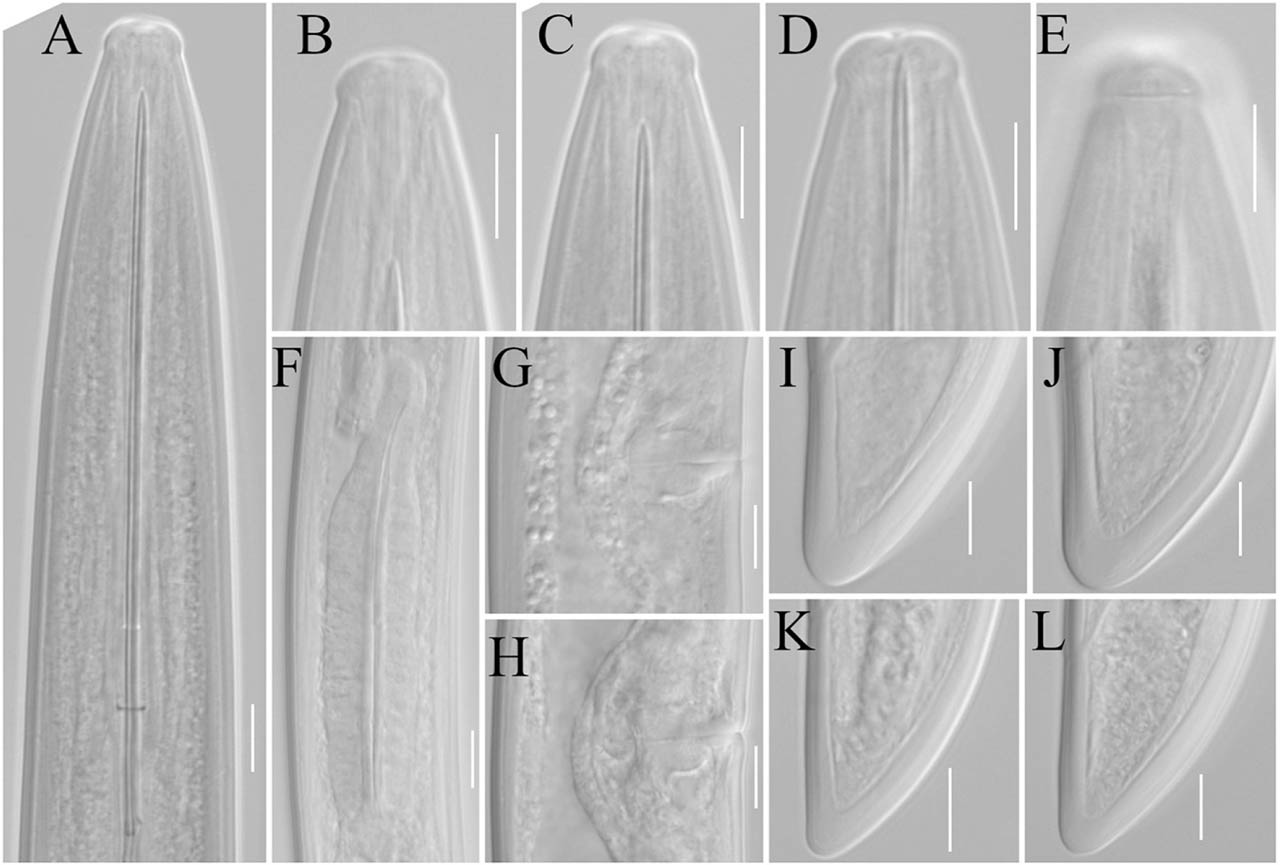
Figure 2:
Light microphotographs of Xiphinema baliense sp. nov. females (A–L): A) odontostyle region; B–D) variation in lip shape; E) amphidial aperture and fovea; F) pharyngeal bulb; G, H) vulva; I–L) variation in tail shapes. Pictures A, C, F, H, and L illustrate the holotype. Scale bar: 10μm.
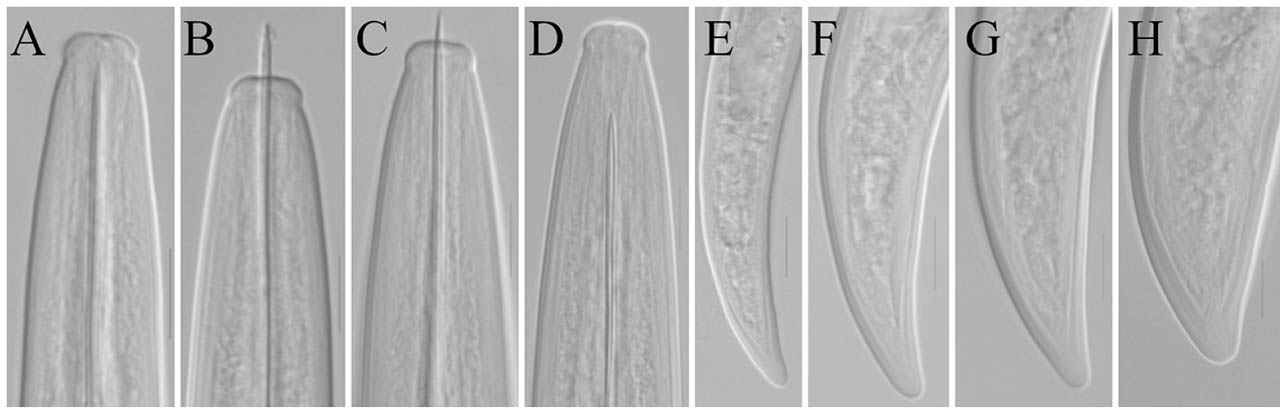
Figure 3:
Light microphotographs of Xiphinema baliense sp. nov. juveniles (A–H): A–D) anterior end and tails of J1–J4, respectively. Scale bar: 10μm.
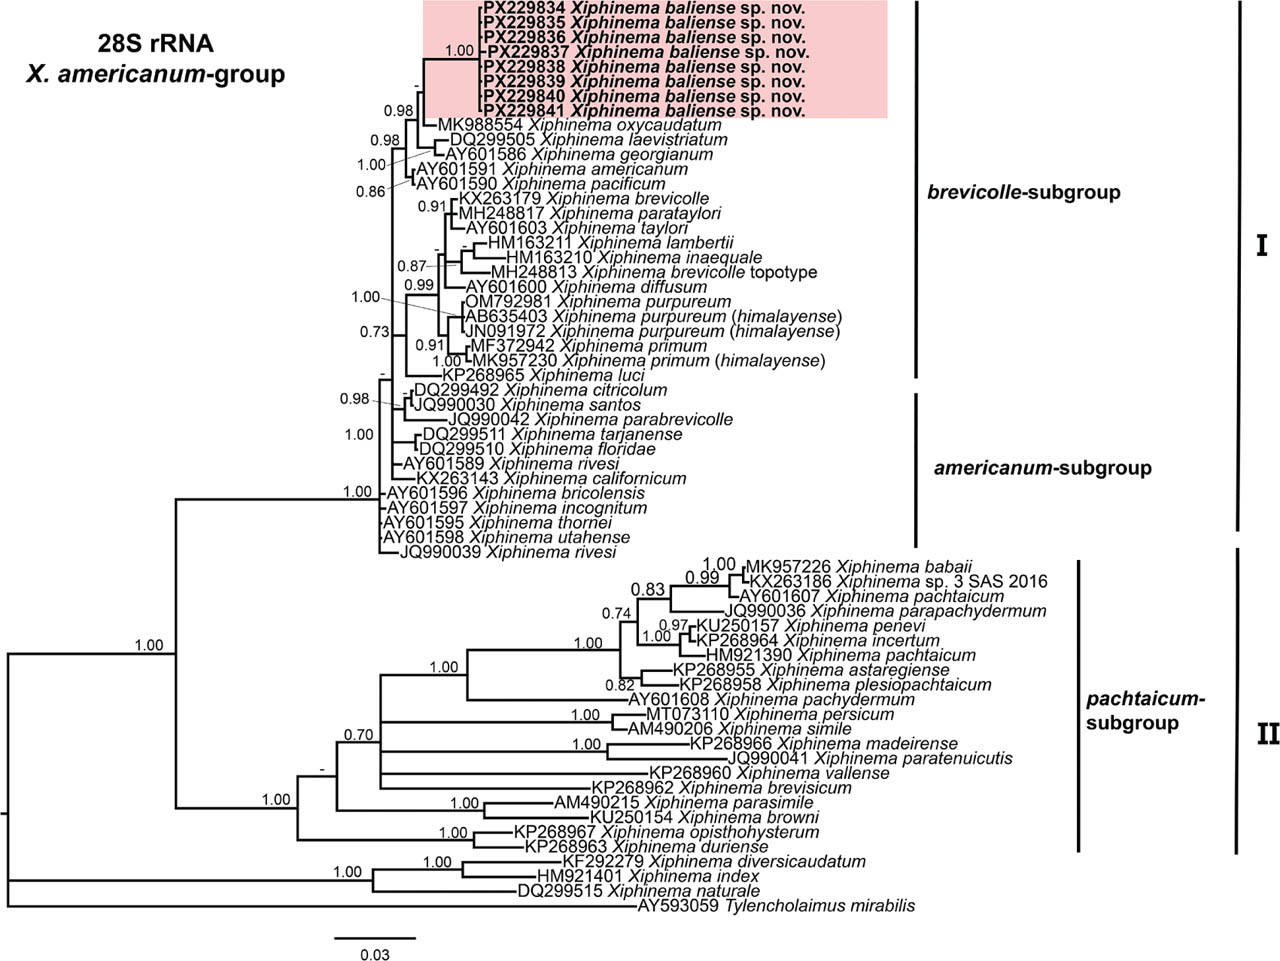
Figure 4:
Phylogenetic relationships of Xiphinema baliense sp. nov. within Xiphinema americanum-group. Bayesian 50% majority rule consensus tree as inferred from D2–D3 expansion segments of 28S rRNA gene sequence alignment under the general time-reversible model with invariable sites and gamma distribution model (GTR + I + G). Posterior probabilities greater than 0.70 are provided for appropriate clades. Newly obtained sequences in this are shown in bold. The scale bar indicates expected changes per site, and the colored boxes indicate clade associations within the Longidorus species analyzed in this study.
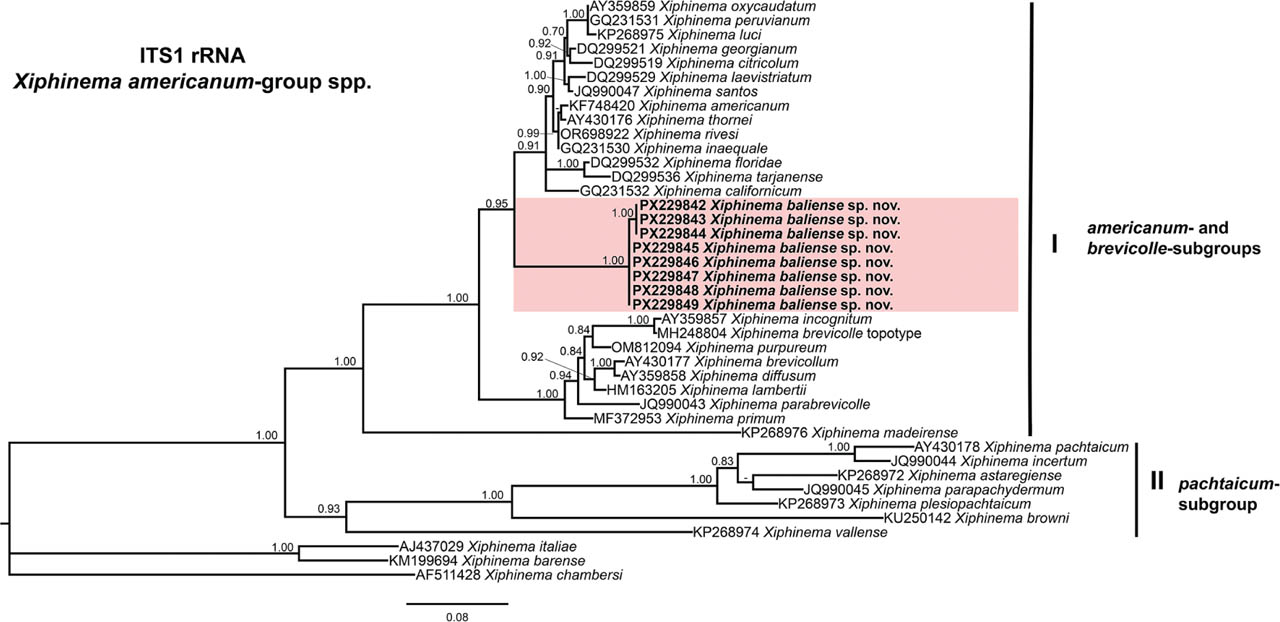
Figure 5:
Phylogenetic relationships of Xiphinema baliense sp. nov. within Xiphinema americanum-group. Bayesian 50% majority rule consensus tree as inferred from ITS1 rRNA gene sequence alignment under the transitional model with invariable sites and gamma distribution (TIM3 + I + G). Posterior probabilities greater than 0.70 are reported for appropriate clades. Newly obtained sequences in this are shown in bold. The scale bar indicates expected changes per site, and the colored boxes indicate clade associations within the Longidorus species analyzed in this study.
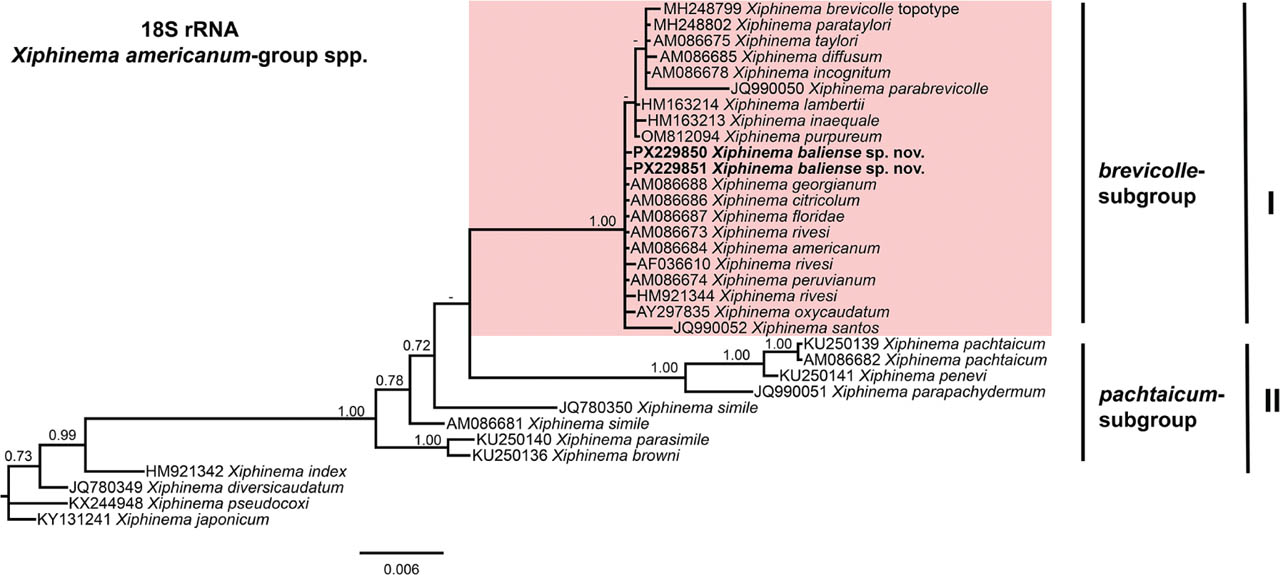
Figure 6:
Phylogenetic relationships of Xiphinema baliense sp. nov. within Xiphinema americanum-group. Bayesian 50% majority rule consensus tree as inferred from 18S rRNA gene sequence alignment under the general time-reversible model with invariable sites and gamma distribution model (GTR + I + G). Posterior probabilities greater than 0.70 are reported for appropriate clades. Newly obtained sequences in this are shown in bold. The scale bar indicates expected changes per site, and the colored boxes indicate the clade association within Xiphinema americanum-group species analyzed in this study.
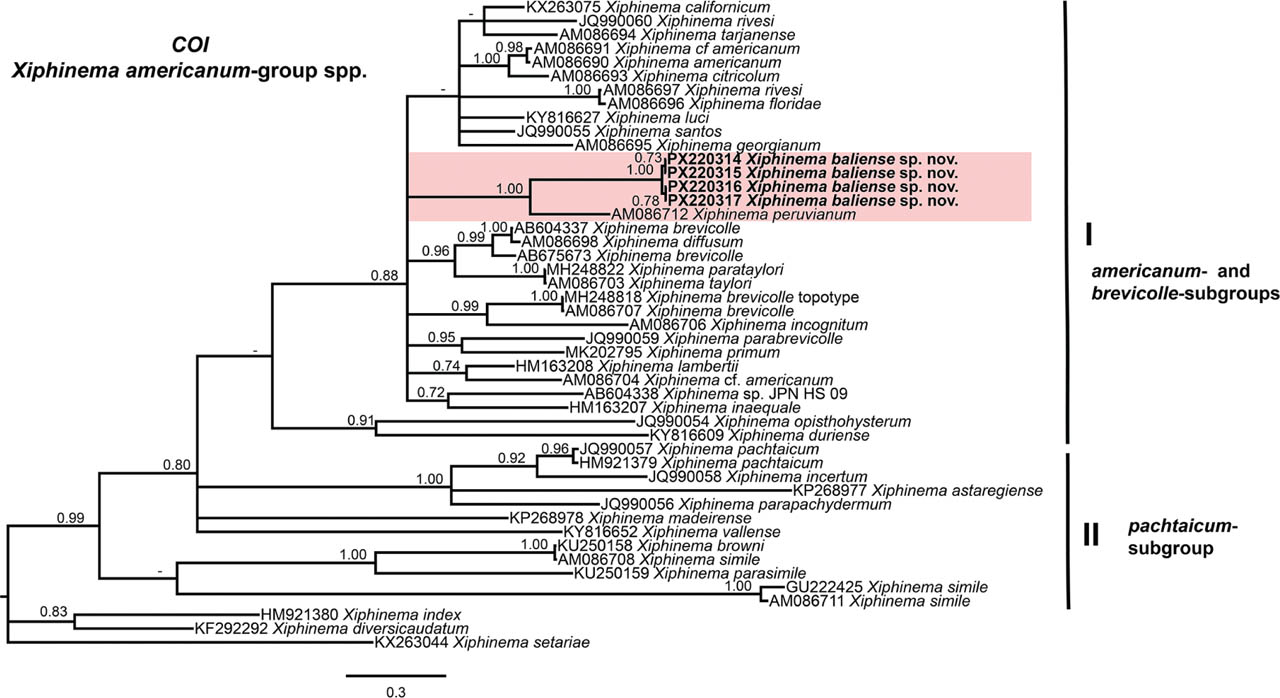
Figure 7:
Phylogenetic relationships of Xiphinema baliense sp. nov. within Xiphinema americanum-group. Bayesian 50% majority rule consensus tree as inferred from COI mtDNA gene sequence alignment under the one-parameter model with invariable sites and gamma distribution model (TPM3uf + I + G). Posterior probabilities greater than 0.70 are reported for appropriate clades. Newly obtained sequences in this are shown in bold. The scale bar indicates expected changes per site, and the colored boxes indicate the clade association within Xiphinema americanum-group species analyzed in this study.