
Figure 1:
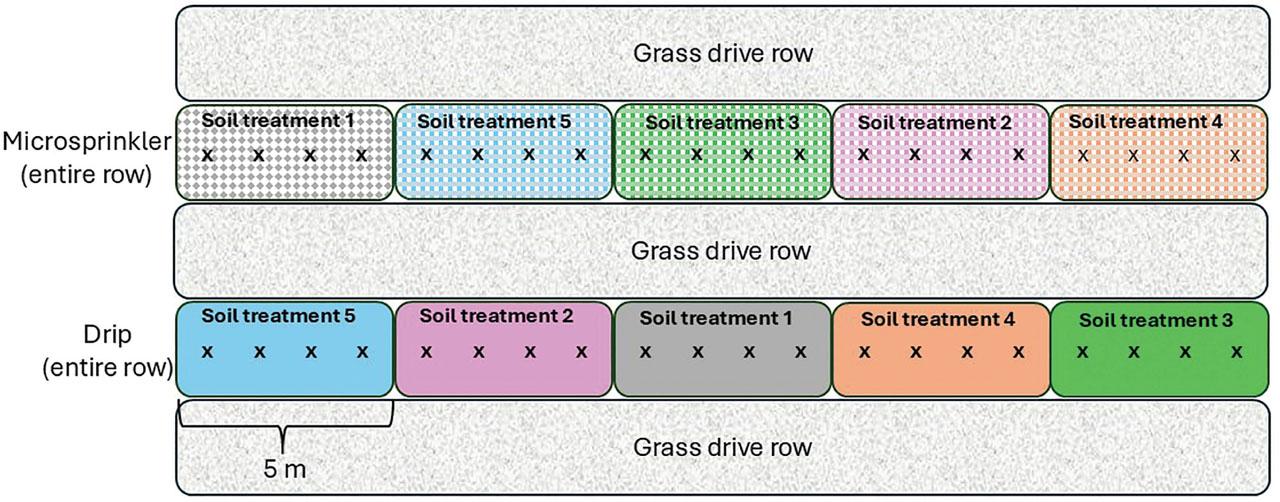
Figure 2:
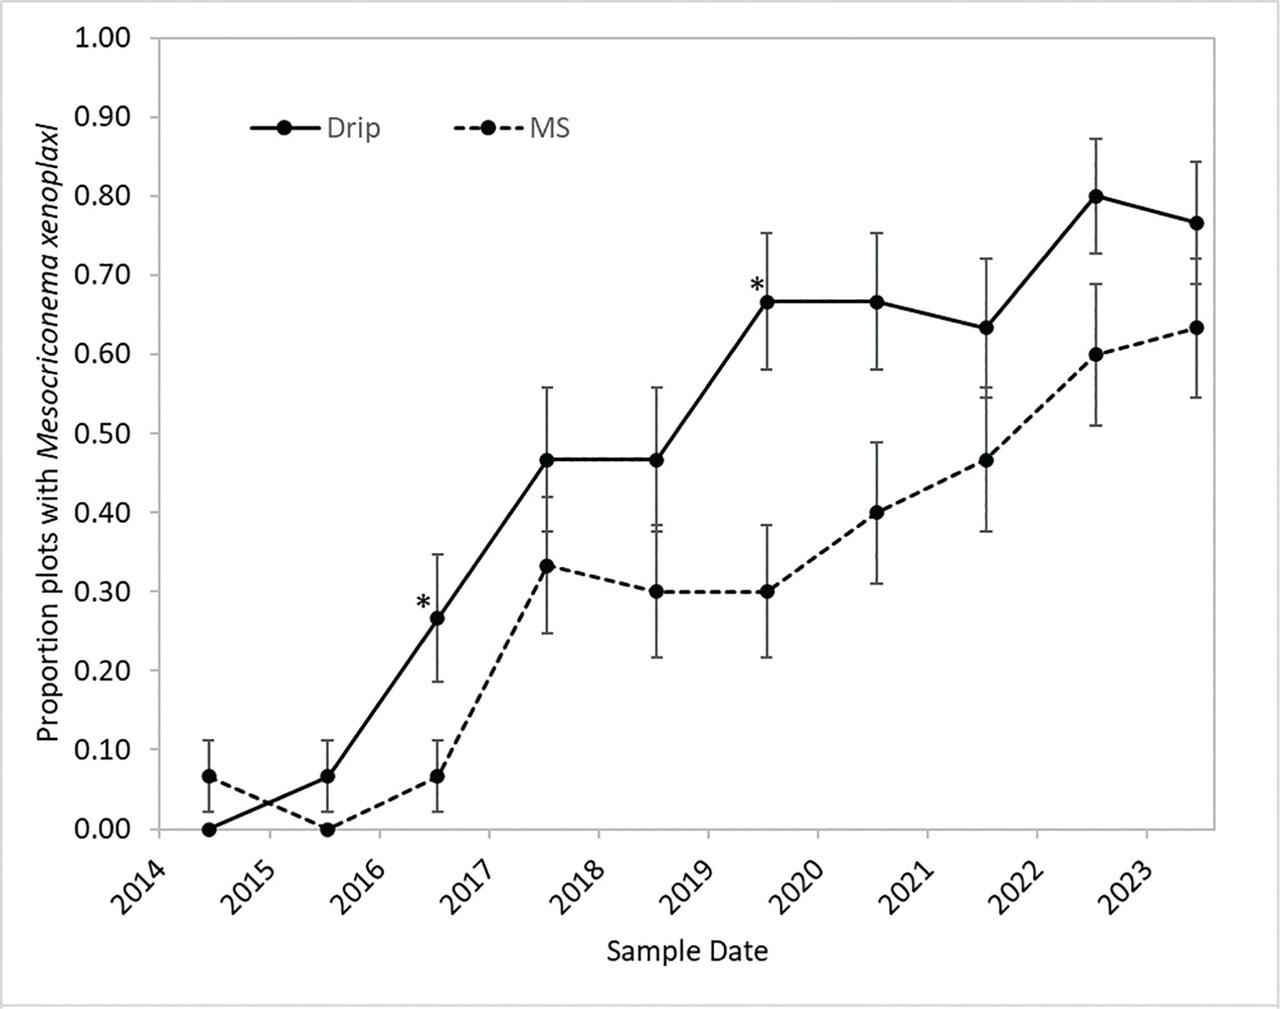
Figure 3:
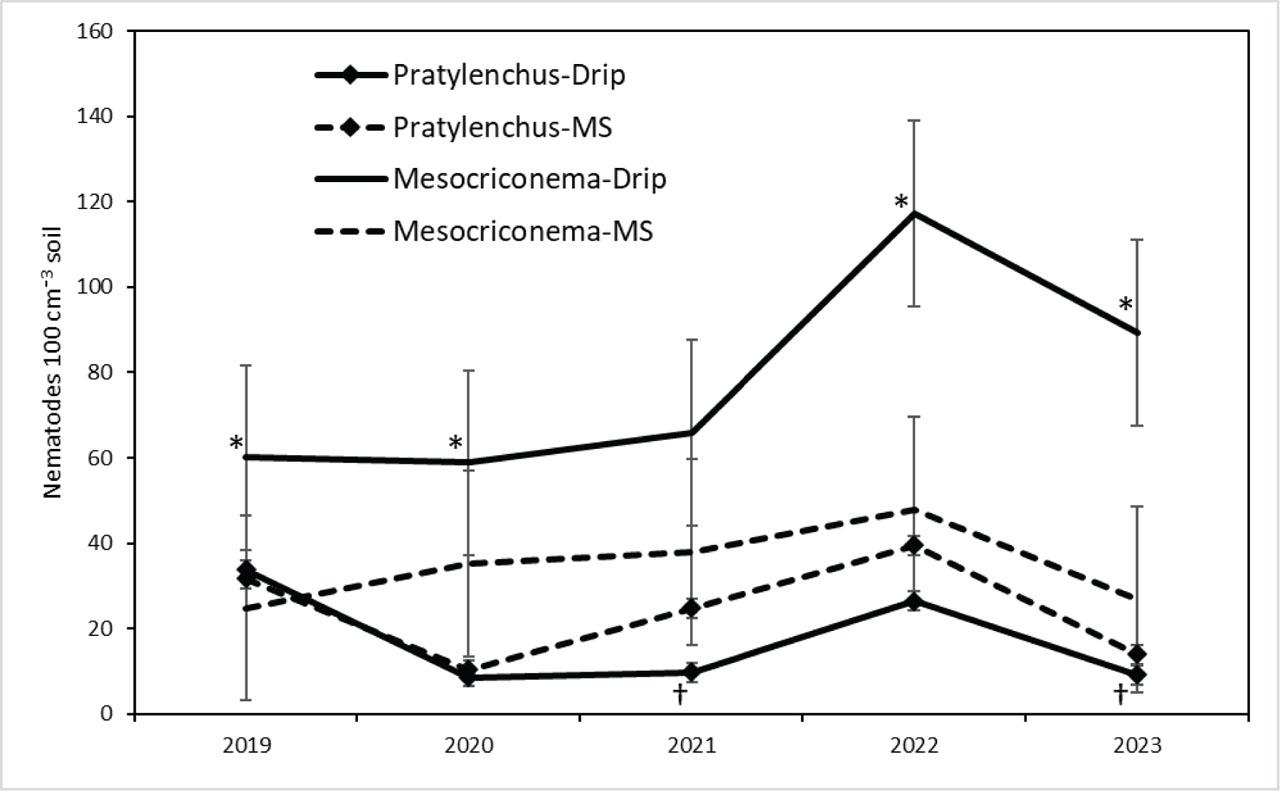
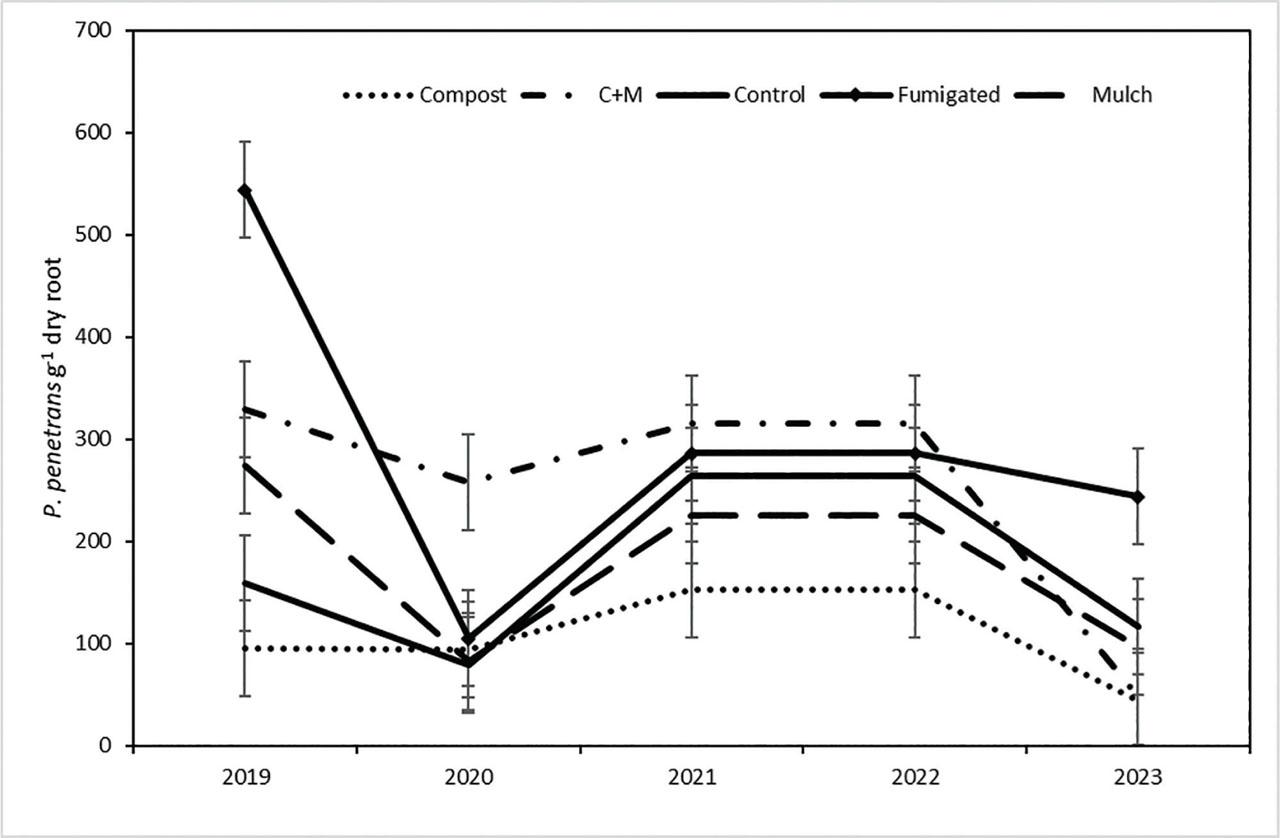
Figure 4:
Macronutrient concentrations and estimates of cumulative macro-nutrient inputs for the compost and bark chip treatments_
| C (%) | N (%) | P (%) | K (%) | Mg (%) | Ca (%) | |
|---|---|---|---|---|---|---|
| AWC | 18.9 | 1.22 | 0.30 | 0.84 | 0.55 | 2.40 |
| YWC | 22.5 | 1.25 | 0.30 | 0.98 | 0.65 | 2.40 |
| BC | 47.6 | 0.34 | n.d. | n.d. | n.d. | n.d. |
| Cumulative additions, 2014–2023 (Mg/ha−1 orchard area) | ||||||
| Compost (C) | 39.6 | 2.455 | 0.6 | 1.75 | 1.15 | 4.8 |
| BC | 59.5 | 0.421 | n.d. | n.d. | n.d. | n.d. |
| C + BC | 99.1 | 2.876 | n.d. | n.d. | n.d. | n.d. |
Volumetric water contents (cm−3 H2O · cm−3 soil) in treatment plots under MS and drip irrigation regimes_
| Year | |||||
|---|---|---|---|---|---|
| 2018 | 2020 | 2021 | 2022 | 2023 | |
| MS | |||||
|
| |||||
| Compost (C) | 0.179 | 0.241 | 0.259 | 0.280 | 0.116 |
| BC | 0.168 | 0.183 | 0.165 | 0.200 | 0.082 |
| C + BC | 0.179 | 0.224 | 0.165 | 0.208 | 0.139 |
| Fumigated | 0.179 | 0.185 | 0.174 | 0.167 | 0.096 |
| MS average | 0.176 | 0.208 | 0.191 | 0.214 | 0.108 |
| Drip | |||||
| Compost (C) | 0.181 | 0.249 | 0.190 | 0.194 | 0.149 |
| BC | 0.209 | 0.296 | 0.259 | 0.317 | 0.222 |
| C + BC | 0.165 | 0.215 | 0.195 | 0.186 | 0.127 |
| Fumigated | 0.172 | 0.279 | 0.228 | 0.257 | 0.171 |
| Drip average | 0.181 | 0.260 | 0.218 | 0.239 | 0.167 |
Main-factor means and mixed model repeated measurement ANOVA summaries for the three nematode population parameters from 2019 through 2023, and cherry tree TCA in 2023_
| M. xenoplax 100 cm−1 soil | P. penetrans 100 cm−1 soil | P. penetrans g−1 root | 2023 TCA cm2 | |
|---|---|---|---|---|
| Irrigation (whole-plot) means | ||||
| Drip | 78* | 17* | 136* | 80 |
| MS | 34 | 24 | 268 | 72 |
| ST (subplot) means | ||||
| Compost (C) | 115a | 15b | 108 | 78 |
| BC | 20b | 25a | 181 | 79 |
| C + BC | 26b | 25ab | 253 | 78 |
| Fumigated | 103a | 20ab | 293 | 76 |
| Untreated | 19b | 19b | 176 | 69 |
| ANOVA summary (P-values) | ||||
| Irrigation (I) | 0.004 | 0.004 | 0.039 | 0.071 |
| ST | 0.048 | 0.017 | 0.079 | 0.599 |
| I × ST | 0.482 | 0.267 | 0.245 | 0.515 |
| Year (Y) | 0.005 | <0.001 | <0.001 | NA |
| Y × I | 0.408 | 0.036 | 0.961 | NA |
| Y × ST | 0.068 | 0.178 | 0.024 | NA |
| Y × I × ST | 0.964 | 0.253 | 0.369 | NA |