
Table 1:
Winter-summer cropping sequence for crop rotation field trial conducted near Quincy, FL.
| Rotationa | Year 1 (2017–18) | Year 2 (2018–19) | Year 3 (2019–20) | Year 4 (2020–21) | ||||
|---|---|---|---|---|---|---|---|---|
| Summer 1 | Winter 1 | Summer 2 | Winter 2 | Summer 3 | Winter 3 | Summer 4 | Winter 4 | |
| 1 | Corn | Fallow | Soybean | Fallow | Cotton | Fallow | Peanut | Fallow |
| 2 | Soybean | Cotton | Peanut | Corn | ||||
| 3 | Peanut | Corn | Soybean | Cotton | ||||
| 4 | Cotton | Peanut | Corn | Soybean | ||||
| 5 | Corn | Fallow | Soybean | Carinata | Cotton | Fallow | Peanut | Carinata |
| 6 | Soybean | Cotton | Peanut | Corn | ||||
| 7 | Peanut | Corn | Soybean | Cotton | ||||
| 8 | Cotton | Peanut | Corn | Soybean | ||||
| 9 | Corn | Carinata | Soybean | Oat | Cotton | Carinata | Peanut | Oat |
| 10 | Soybean | Cotton | Peanut | Corn | ||||
| 11 | Peanut | Corn | Soybean | Cotton | ||||
| 12 | Cotton | Peanut | Corn | Soybean | ||||
Table 2:
Planting and harvest dates for summer and winter rotation combinations each year in a field trial near Quincy, FL.
| Season | Crop | Planting 1 | Planting 2 | Harvest 1 | Harvest 2 | Soil sampling for nematodes |
|---|---|---|---|---|---|---|
| Summer 1 (2017)a | Cotton | 28 April 17 | 14 June 17 | 27 September 17 | 29 November 17 | 4–5 December 17 |
| Peanut | 08 May 17 | 12 June 17 | 27 September 17 | 01 November 17 | ||
| Soybean | 22 May 17 | 14 June 17 | 20 November 17 | 20 November 17 | ||
| Corn | 05 April 17 | 12 June 17 | 16 August 17 | 29 October 17 | ||
| Winter 1 (2017–18) | Carinata | 13 December 17 | 04 June 18 | 5–6 June 18 | ||
| Oat | ||||||
| Summer 2 (2018)a | Corn | 05 April 18 | 12 June 18 | 16 August 18 | 29 October 18 | 19–20 November 18 |
| Cotton | 27 April 18 | 06 June 18 | 08 October 18 | 31 October 18 | ||
| Peanut | 04 May 18 | 12 June 18 | 04 October 18 | 29 October 18 | ||
| Soybean | 24 May 18 | 11 June 18 | 19 November 18 | 19 November 18 | ||
| Winter 2 (2018–19) | Carinata | 08 January 19 | 29 May 19 | 3–4 June 19 | ||
| Oat | 13 December 18 | 12 March 19 | ||||
| Summer 3 (2019)a | Corn | 18 March 19 | 10 June 19 | 05 August 19 | 27 September 19 | 14–15 November 19 |
| Cotton | 29 April 19 | 10 June 19 | 27 September 19 | 29 May 19 | ||
| Peanut | 09 May 19 | 10 June 19 | 01 October 19 | 25 October 19 | ||
| Soybean | 17 May 19 | 10 June 19 | 15 November 19 | 15 November 19 | ||
| Winter 3 (2019–20) | Carinata | 16 December 19 | 19 May 20 | 27–28 May 20 | ||
| Oat | ||||||
| Summer 4 (2020)a | Corn | 13 March 20 | 22 May 20 | 15 July 20 | 9 September 20 | 13 November 20 |
| Cotton | 22 March 20 | 22 May 20 | 08 October 20 | 5 November 20 | ||
| Peanut | 05 May 20 | 22 May 20 | 06 October 20 | 26 October 20 | ||
| Soybean | 11 May 20 | 22 May 20 | 9 November 20 | 9 November 20 | ||
| Winter 4 (2020–21) | Carinata | 17 November 20 | 17 May 21 | 20 May 21 | ||
| Oat | 24 November 20 | 12 March 21 |
Table 3:
Monthly environmental conditions at the field trial site during the study.a
| Month | Janb | Feb | Mar | Apr | May | Jun | Jul | Aug | Sep | Oct | Nov | Dec | |
|---|---|---|---|---|---|---|---|---|---|---|---|---|---|
| 2017 | Rainfall + irrigation (cm) | 0.3 | 0.5 | 0.8 | 3.3 | 3.3 | 0.3 | 1.7 | 0.0 | 0.3 | |||
| Air T (°C) | 20.4 | 22.8 | 24.6 | 26.3 | 26.3 | 24.2 | 20.8 | 15.5 | 12.2 | ||||
| Soil T (°C) | 21.6 | 24.3 | 25.3 | 26.8 | 26.7 | 24.7 | 22.4 | 17.1 | 12.9 | ||||
| 2018 | Rainfall + irrigation (cm) | 0.2 | 0.5 | 0.4 | 0.2 | 3.2 | 3.7 | 3.7 | 2.2 | 2.2 | 0.4 | 0.7 | 0.9 |
| Air T (°C) | 8.2 | 17.6 | 14.7 | 18.1 | 23.7 | 26.1 | 26.2 | 25.7 | 26.1 | 22.1 | 14.2 | 12.8 | |
| Soil T (°C) | 8.9 | 15.9 | 15.4 | 18.9 | 24.6 | 26.4 | 26.7 | 26.1 | 26.4 | 22.3 | 14.7 | 12.2 | |
| 2019 | Rainfall + irrigation (cm) | 1.0 | 0.1 | 1.7 | 0.5 | 4.6 | 0.4 | 2.0 | 2.2 | 6.8 | 0.4 | 0.1 | 0.4 |
| Air T (°C) | 11.2 | 16.5 | 15.3 | 19.0 | 24.6 | 26.2 | 26.1 | 26.4 | 26.4 | 22.5 | 13.4 | 13.4 | |
| Soil T (°C) | 10.9 | 14.9 | 16.0 | 19.4 | 26.1 | 27.2 | 27.2 | 27.1 | 27.2 | 23.1 | 14.2 | 12.8 | |
| 2020 | Rainfall + irrigation (cm) | 0.2 | 0.5 | 1.7 | 0.4 | 4.9 | 1.8 | 4.5 | 1.9 | 1.3 | 0.2 | 0.3 | 0.3 |
| Air T (°C) | 13.0 | 14.2 | 20.3 | 20.0 | 22.7 | 25.8 | 26.7 | 26.7 | 24.6 | 22.1 | 18.1 | 10.3 | |
| Soil T (°C) | 12.5 | 13.1 | 18.8 | 20.7 | 23.7 | 25.6 | 27.0 | 27.4 | 23.8 | 21.2 | 17.2 | 9.7 | |
| 2021 | Rainfall + irrigation (cm) | 0.6 | 0.6 | 0.3 | |||||||||
| Air T (°C) | 11.4 | 13.1 | 14.0 | ||||||||||
| Soil T (°C) | 10.4 | 12.2 | 14.2 |
Table 4:
Influence of winter rotation, summer crop, and depth in soil profile on Rotylenchulus reniformis soil abundances based on P-values from ANOVA.
| Main factors | Summer 1 | Winter 1 | Summer 2 | Winter 2 | Summer 3 | Winter 3 | Summer 4 | Winter 4 |
|---|---|---|---|---|---|---|---|---|
| Winter rotation (W) | 0.42 | 0.09* | 0.33 | 0.11 | 0.52 | 0.93 | 1.96E−03*** | 0.63 |
| Summer crop (S) | 0.04** | 2.73E−03*** | 4.19E−06*** | 6.3E−05*** | 0.01** | 4.36E−03*** | 0.06* | 0.03** |
| Depth (D) | 0.10* | 1.96E−03*** | 5.73E−11*** | 3.32−05*** | 0.73 | 0.02** | 1.88E−08*** | 0.06* |
| Interactions | ||||||||
| W × S | 0.96 | 0.88 | 0.02** | 0.08* | 0.7 | 0.58 | 0.83 | 0.42 |
| W × D | 0.66 | 0.86 | 0.17 | 0.25 | 0.08* | 0.25 | 2.47E−04*** | 0.71 |
| S × D | 0.19 | 0.78 | 0.74 | 0.2 | 2.08E−03*** | 0.05** | 0.01*** | 0.06* |
| W × S × D | 0.55 | 0.84 | 0.3 | 0.67 | 1 | 0.7 | 0.11 | 0.42 |
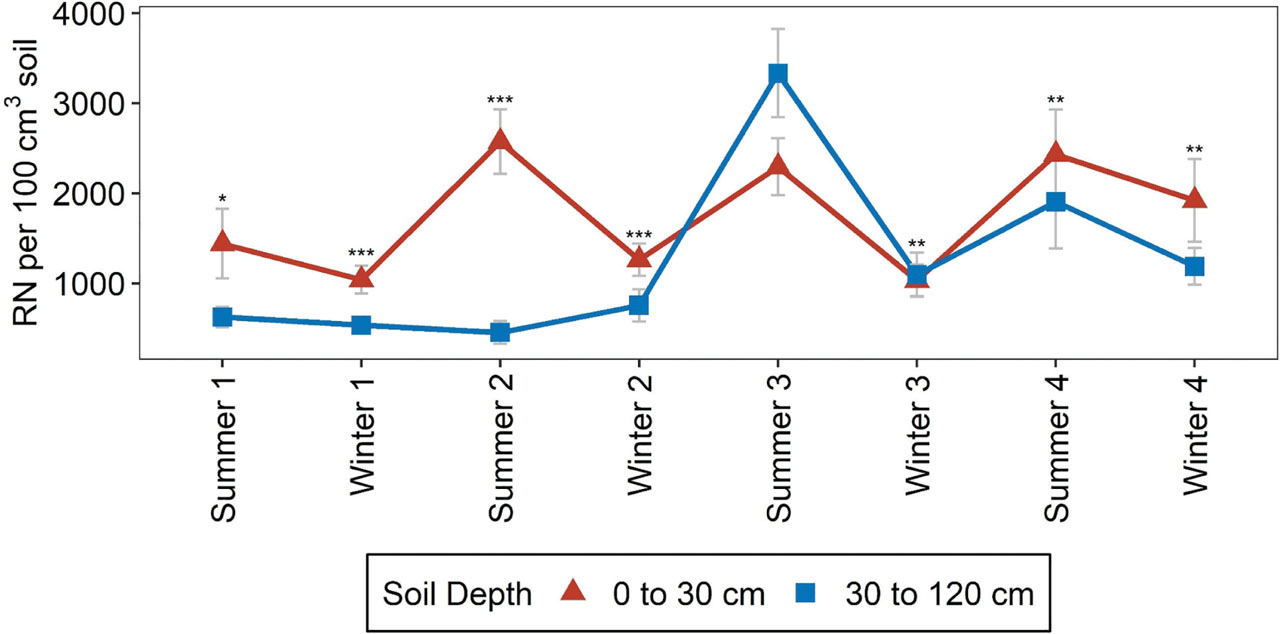
Figure 1:
Rotylenchulus reniformis (RN) soil abundance by season at 0–30 cm and 30–120 cm, as affected by depth. Mean values and standard errors are presented. Asterisks above the mean denote significant differences between soil depths, within each season, based on ANOVA, P-value ≤0.01 (***), P-value ≤0.05 (**), P-value ≤0.1 (*). “Summer” and “Winter” indicate soil samples collected at harvest of summer and winter crops, respectively. The number following a season indicates the year during study when sampling took place. Error bars represent standard errors.
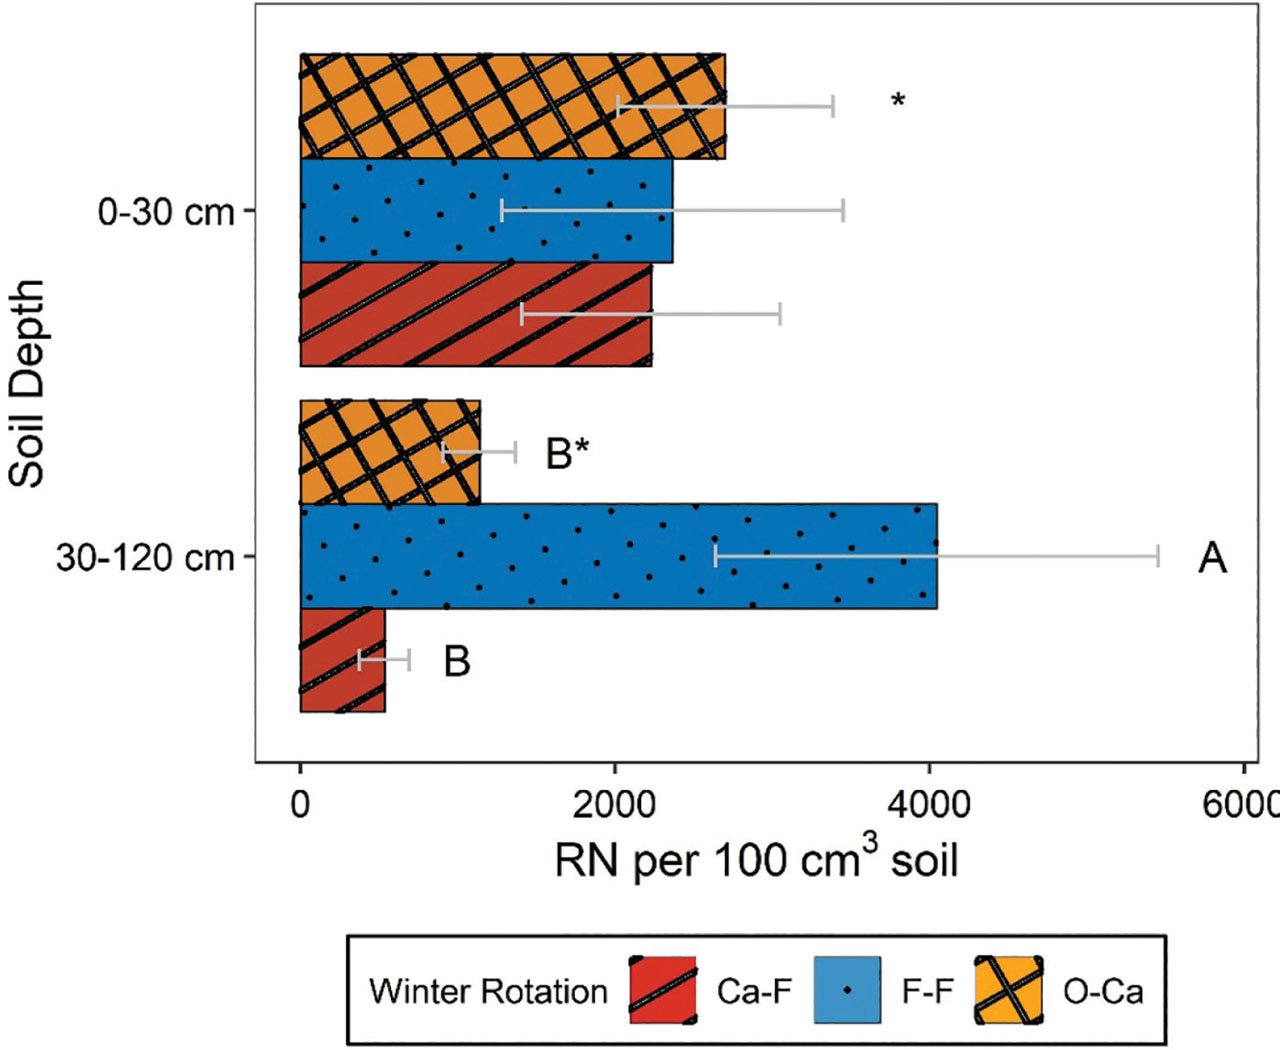
Figure 2:
Interactive effects of soil depth and winter crop rotation on Rotylenchulus reniformis (RN) soil abundances from sampling around harvest of summer crops in Year 4 of field study. “Ca-F,” “F-F,” and “O-Ca” are 2-yr winter rotations of carinata-fallow, fallow-fallow, and oats-carinata, respectively. Letters next to means denote significant differences among treatments, within a depth in the soil profile, based on Fisher's protected LSD, P-value ≤0.05. *Indicates significant depth effects (ANOVA, P < 0.05) within the given winter rotation. Error bars represent standard errors.
Table 5:
Effect of summer crop on Rotylenchulus reniformis (RN) soil abundances (nematodes/100 cm3 soil) at different depths in the soil profile across seasons.
| Summer crop | Depth (cm) | RN/100 cm3 soila | Summer crop | Depth (cm) | RN/100 cm3 soil |
|---|---|---|---|---|---|
| Summer 3 | |||||
| Corn | 0–30 | 1,771 b | Corn | 30–120 | 2,045 B |
| Cotton | 0–30 | 3,944 a | Cotton | 30–120 | 4,033 A |
| Peanut | 0–30 | 1,277 b* | Peanut | 30–120 | 4,963 A* |
| Soybean | 0–30 | 2,180 ab | Soybean | 30–120 | 2,283 B |
| Winter 3 | |||||
| Corn | 0–30 | 672 b | Corn | 30–120 | 506 B |
| Cotton | 0–30 | 2,152 a | Cotton | 30–120 | 2,153 A |
| Peanut | 0–30 | 638 b* | Peanut | 30–120 | 1,256 A* |
| Soybean | 0–30 | 669 ab | Soybean | 30–120 | 461 B |
| Summer 4 | |||||
| Corn | 0–30 | 776 c* | Corn | 30–120 | 643 B* |
| Cotton | 0–30 | 6,005 a | Cotton | 30–120 | 4,624 A |
| Peanut | 0–30 | 783 c | Peanut | 30–120 | 1,315 AB |
| Soybean | 0–30 | 2,159 b* | Soybean | 30–120 | 1,038 AB* |
| Winter 4 | |||||
| Corn | 0–30 | 956 b | Corn | 30–120 | 617 B |
| Cotton | 0–30 | 4,233 a | Cotton | 30–120 | 1,345 A |
| Peanut | 0–30 | 1,003 b | Peanut | 30–120 | 1,543 A |
| Soybean | 0–30 | 1,485 ab | Soybean | 30–120 | 1,238 A |
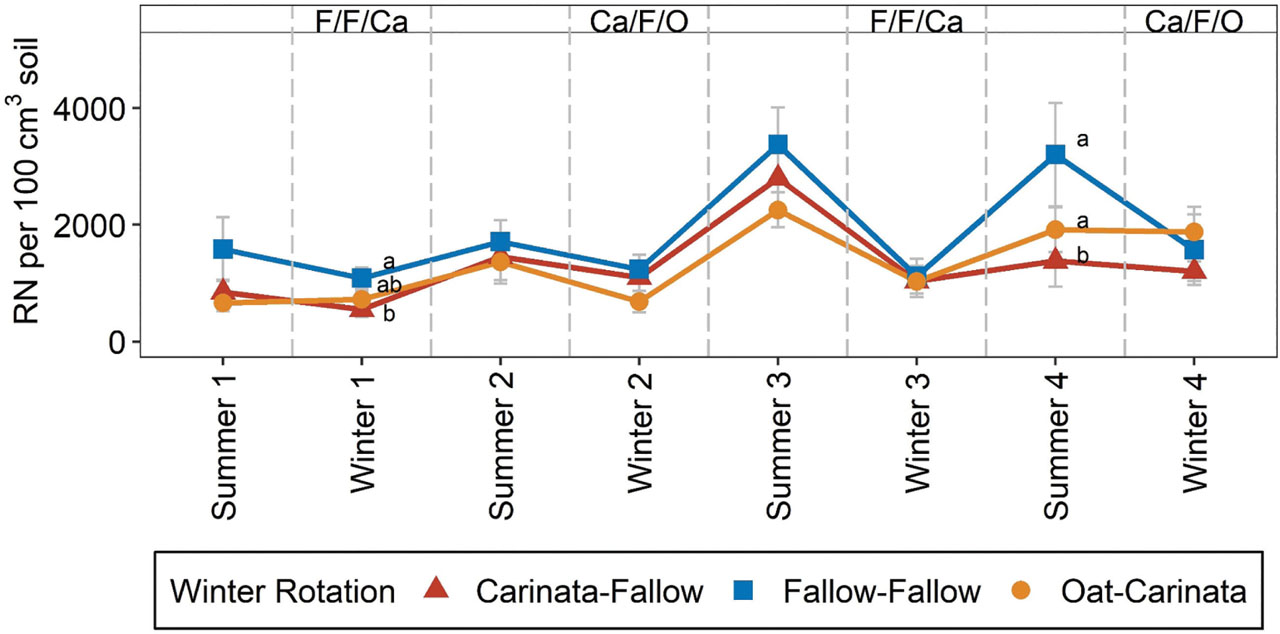
Figure 3:
Rotylenchulus reniformis (RN) soil abundances by season, as affected by winter rotation. Mean values and standard errors are presented. Letters next to means denote significant differences among treatments, within each season, based on Fisher's protected LSD, P-value ≤0.05. Letters at the top of the graph (Ca: carinata, F: fallow, O: oat) represent the winter crop present for the corresponding winter season, for Ca-F, F-F, and O-Ca rotations, respectively. “Summer” and “Winter” indicate soil samples collected at harvest of summer and winter crops, respectively. The number following a season indicates the year during study when sampling took place. Error bars represent standard errors.
Table 6:
Effects of winter rotation and summer crop on Rotylenchulus reniformis (RN) soil abundances across seasons.
| Summer crop | Winter rotationa | RN/100 cm3 soilb | Winter rotation | RN/100 cm3 soil | Winter rotation | RN/100 cm3 soil |
|---|---|---|---|---|---|---|
| Corn | Ca-F | 1,181 b Y | F-F | 1,956 Y | O-Ca | 43 c Z |
| Cotton | Ca-F | 3,292 a | F-F | 2,153 | O-Ca | 3,841 a |
| Peanut | Ca-F | 900 b | F-F | 1,294 | O-Ca | 791 b |
| Soybean | Ca-F | 450 b | F-F | 1,456 | O-Ca | 793 b |
| Winter 2 | ||||||
| Corn | Ca-F | 550 b Y | F-F | 1,277 Y | O-Ca | 155 b Z |
| Cotton | Ca-F | 2,791 a | F-F | 2,250 | O-Ca | 1,561 a |
| Peanut | Ca-F | 487 b | F-F | 610 | O-Ca | 600 a |
| Soybean | Ca-F | 563 b | F-F | 819 | O-Ca | 420 a |
a “Ca-F”, “F-F”, and “O-Ca” are 2-yr winter rotations of carinata-fallow, fallow-fallow, and oats-carinata, respectively.
b Lowercase letters indicate significant differences among summer crops (Fisher's protected LSD, α = 0.05) within a given season and winter rotation. Uppercase letters indicate significant differences among winter rotations within a given summer crop and season. Means were separated by Fisher's protected LSD (α = 0.05).
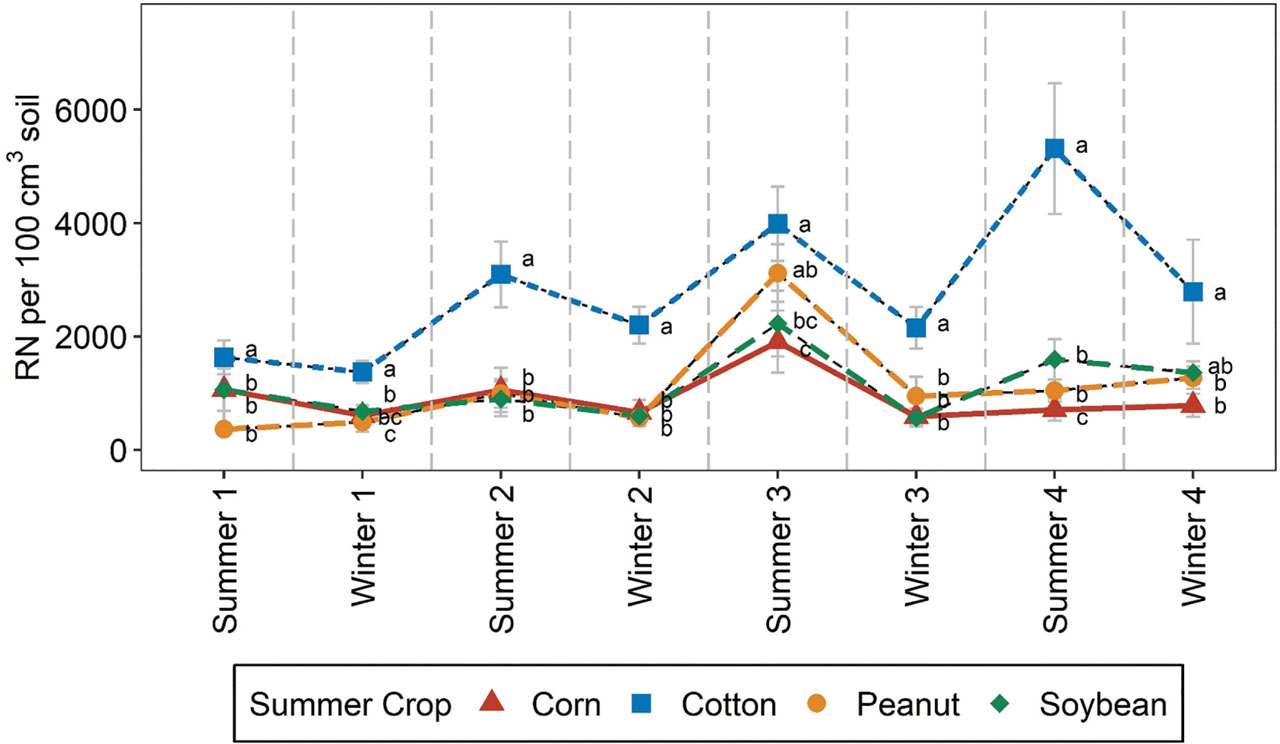
Figure 4:
Rotylenchulus reniformis (RN) soil abundances by season, as affected by summer crop. Mean values and standard errors are presented. Letters next to means denote significant differences among treatments, within each season, based on Fisher's protected LSD, P-value ≤0.05. “Summer” and “Winter” indicate soil samples collected at harvest of summer and winter crops, respectively. The number following a season indicates the year during study when sampling took place. Error bars represent standard errors.