
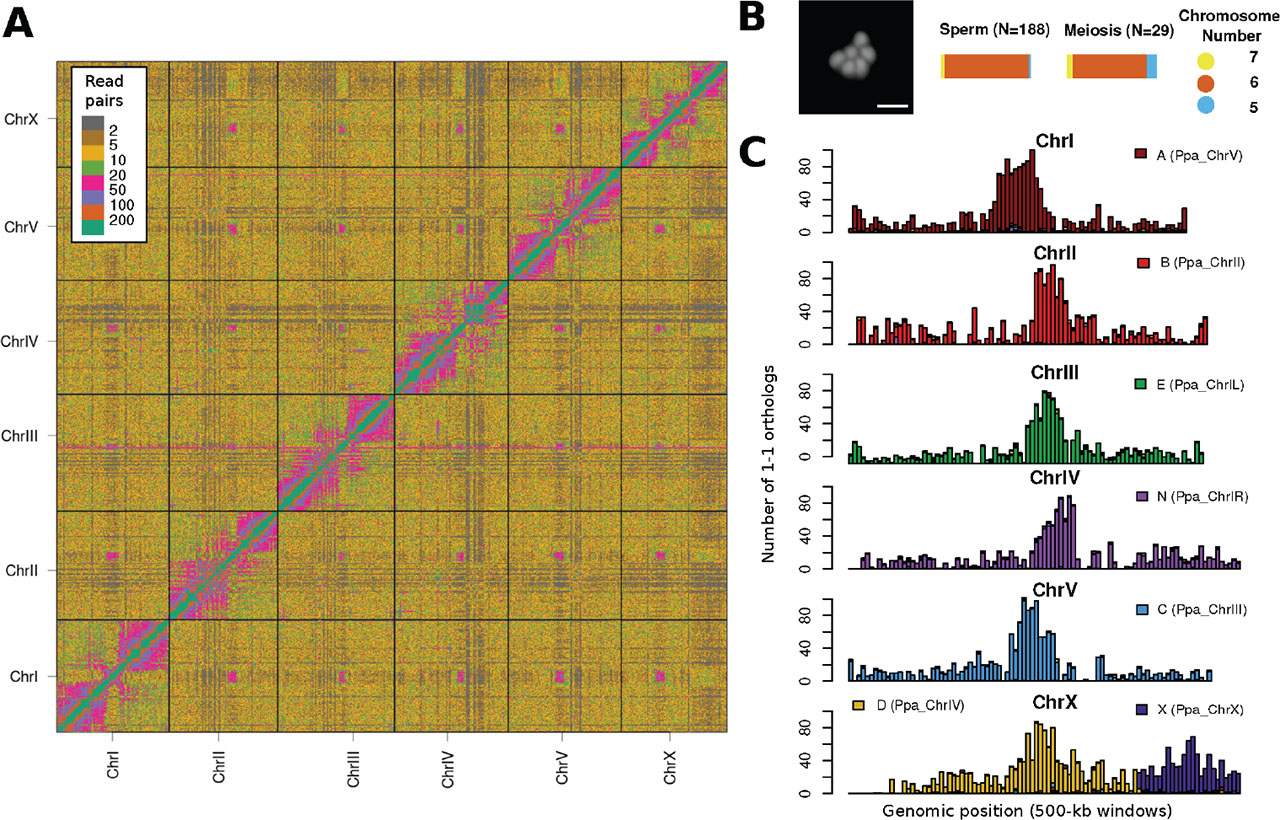
Figure 1:
(A) The heatmap shows the Hi-C contact map for the P. giblindavisi genome. The color code for each cell indicates the number of Hi-C read pairs identified for a specific pair of 250-kb windows. (B) The picture shows a sperm cell of P. giblindavisi whereby the chromosomes were stained by Hoechst 33342. The scale bar indicates 2 μm. The bar plots show the proportion of male meiotic cells and sperms with each chromosome number. (C) We defined 1-1 orthologs between P. giblindavisi and P. pacificus proteins using best reciprocal BLAST hits and assigned Nigon elements based on the location of the 1-1 ortholog in the P. pacificus genome. Each bar shows the number of orthologs from different Nigon elements across 500-kb windows of the P. giblindavisi chromosomes.
Table 1:
Characteristics of different P. giblindavisi genome assemblies.
| P. giblindavisi (Röseler et al., 2022) | P. giblindavisi (This study) | |
|---|---|---|
| Number of contigs/scaffolds | 735 | 404 |
| Total genome size (Mb) | 251.6 | 303.1 |
| N50 (Mb) | 0.8 | 43.6 |
| Number of genes | 22,488 | 22,594 |
| BUSCO (proteins) (%) | 87.6 | 88.4 |
| Median protein length (amino acids) | 224 [127–389] | 222 [127–387] |
| Median exon number | 7 [4–11] | 6 [4–11] |
| Median exon length (nucleotides) | 93 [71–120] | 93 [71–120] |
| Median intron length (nucleotides) | 132 [54–297] | 132 [54–297] |