Figure 1:
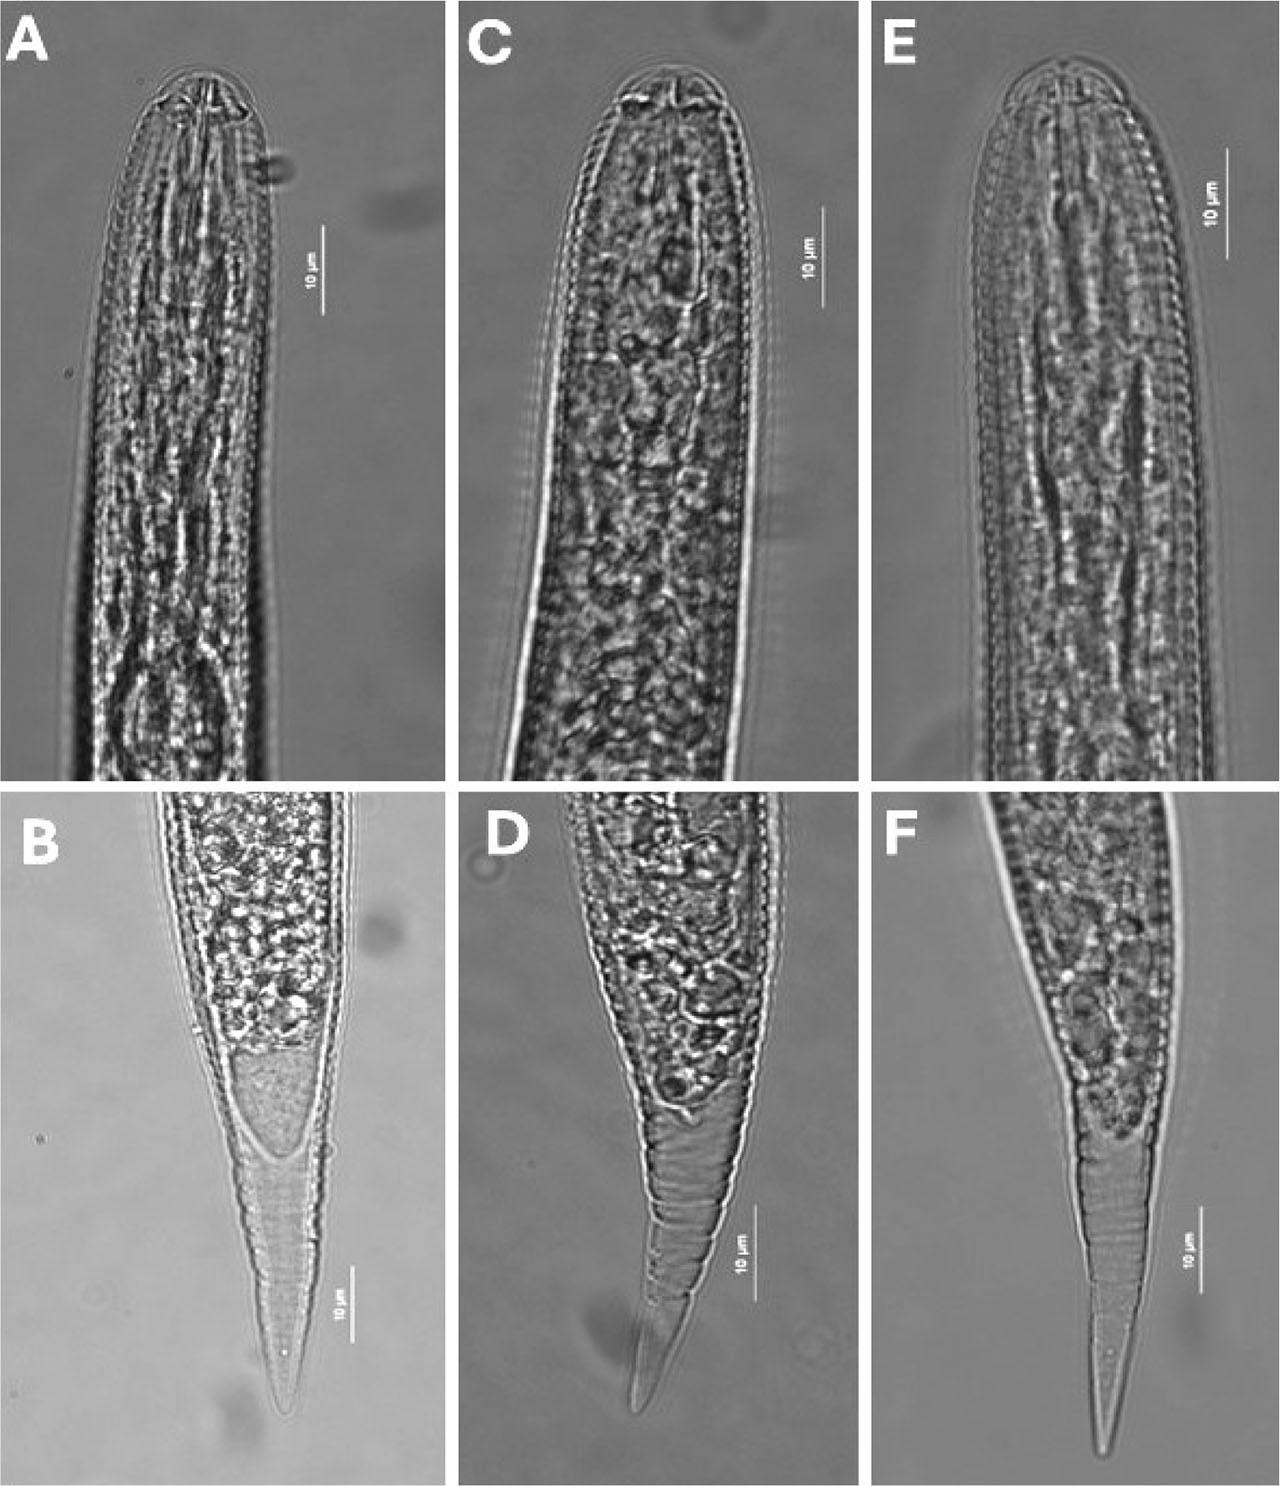
Figure 2:
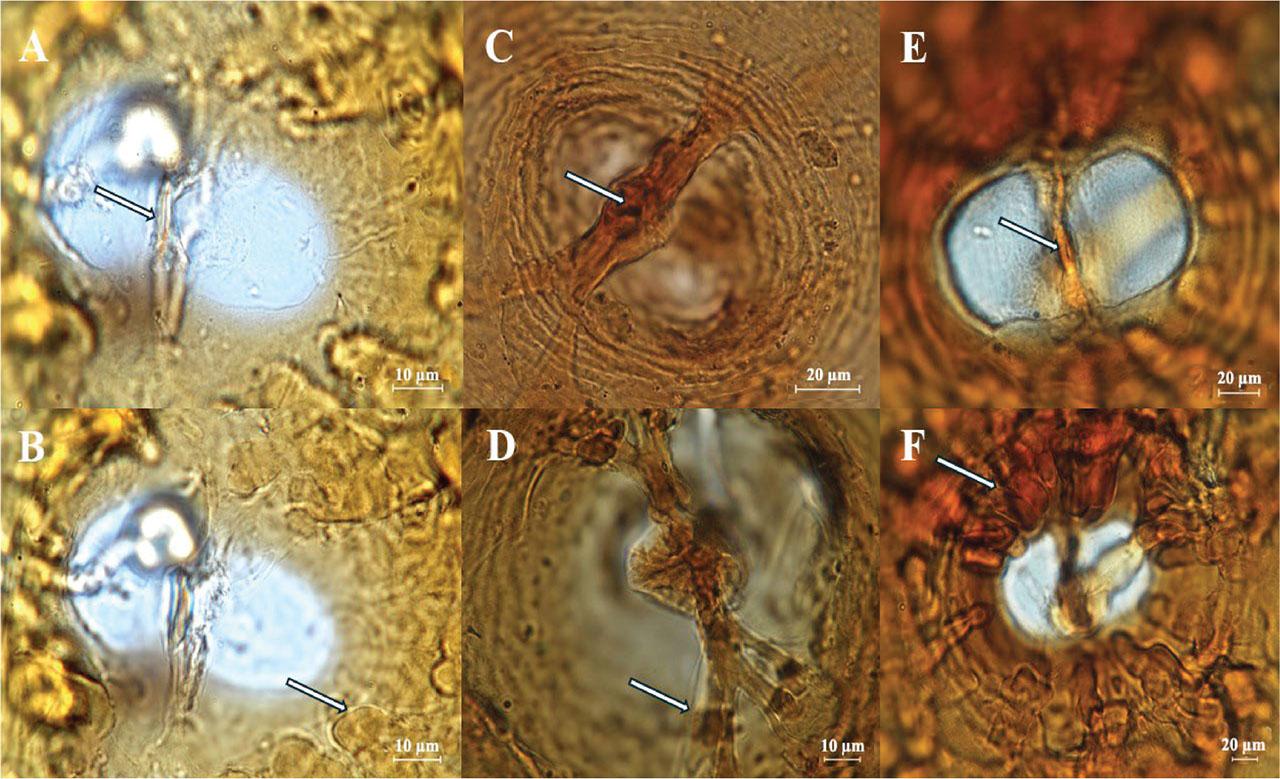
Figure 3:
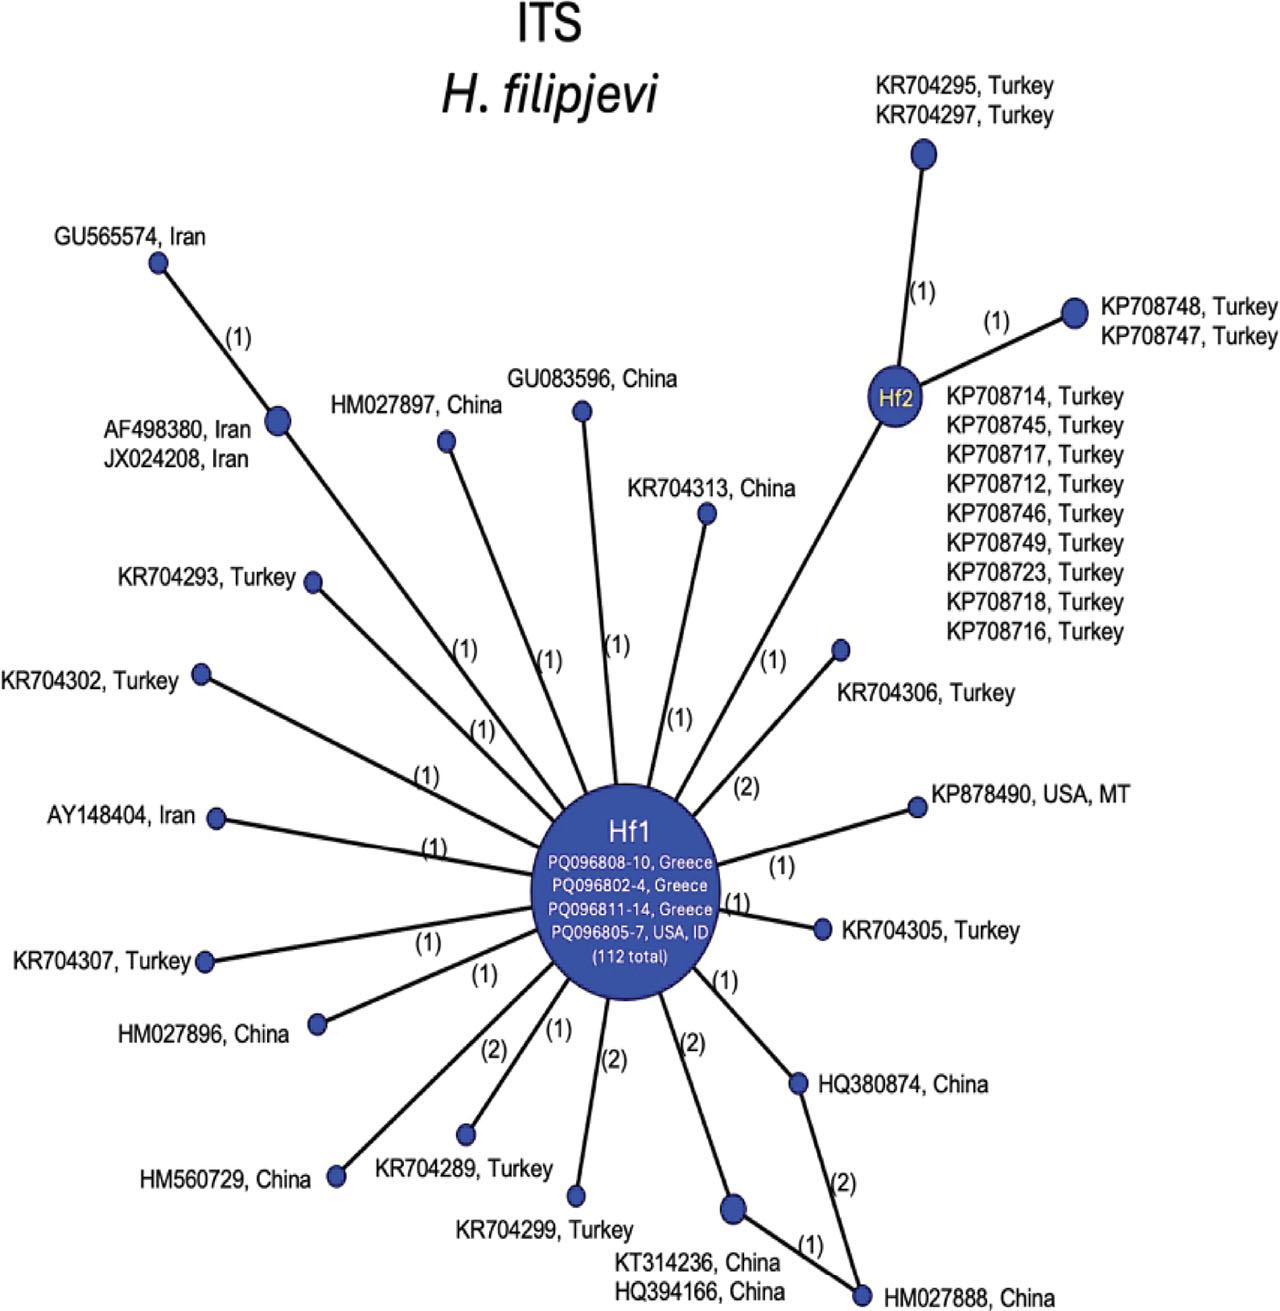
Figure 4:
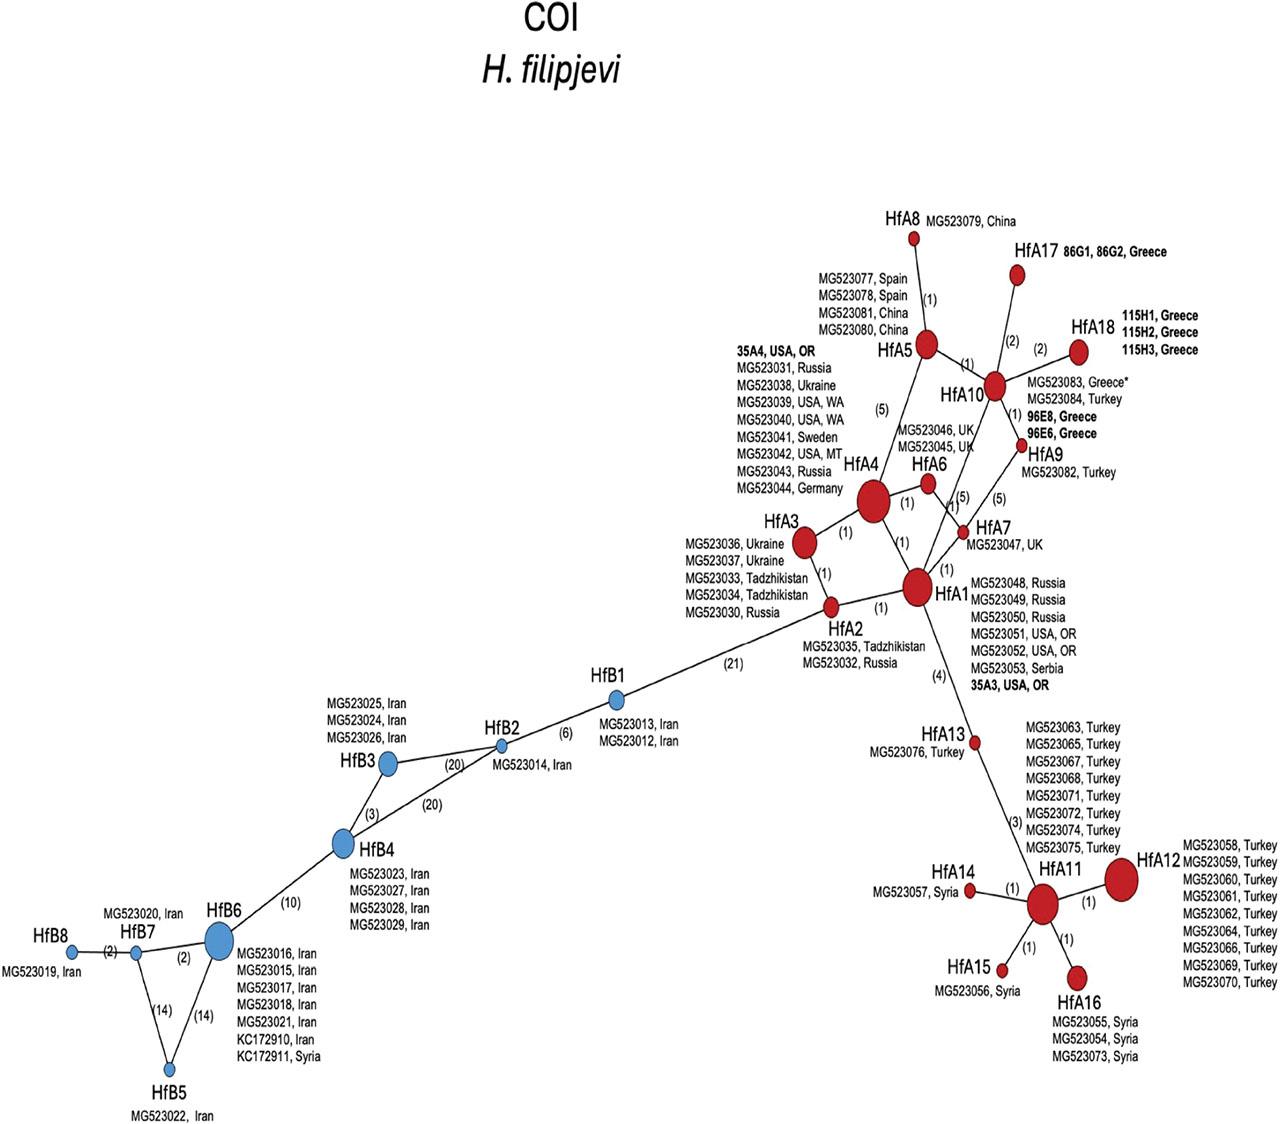
Figure 5:
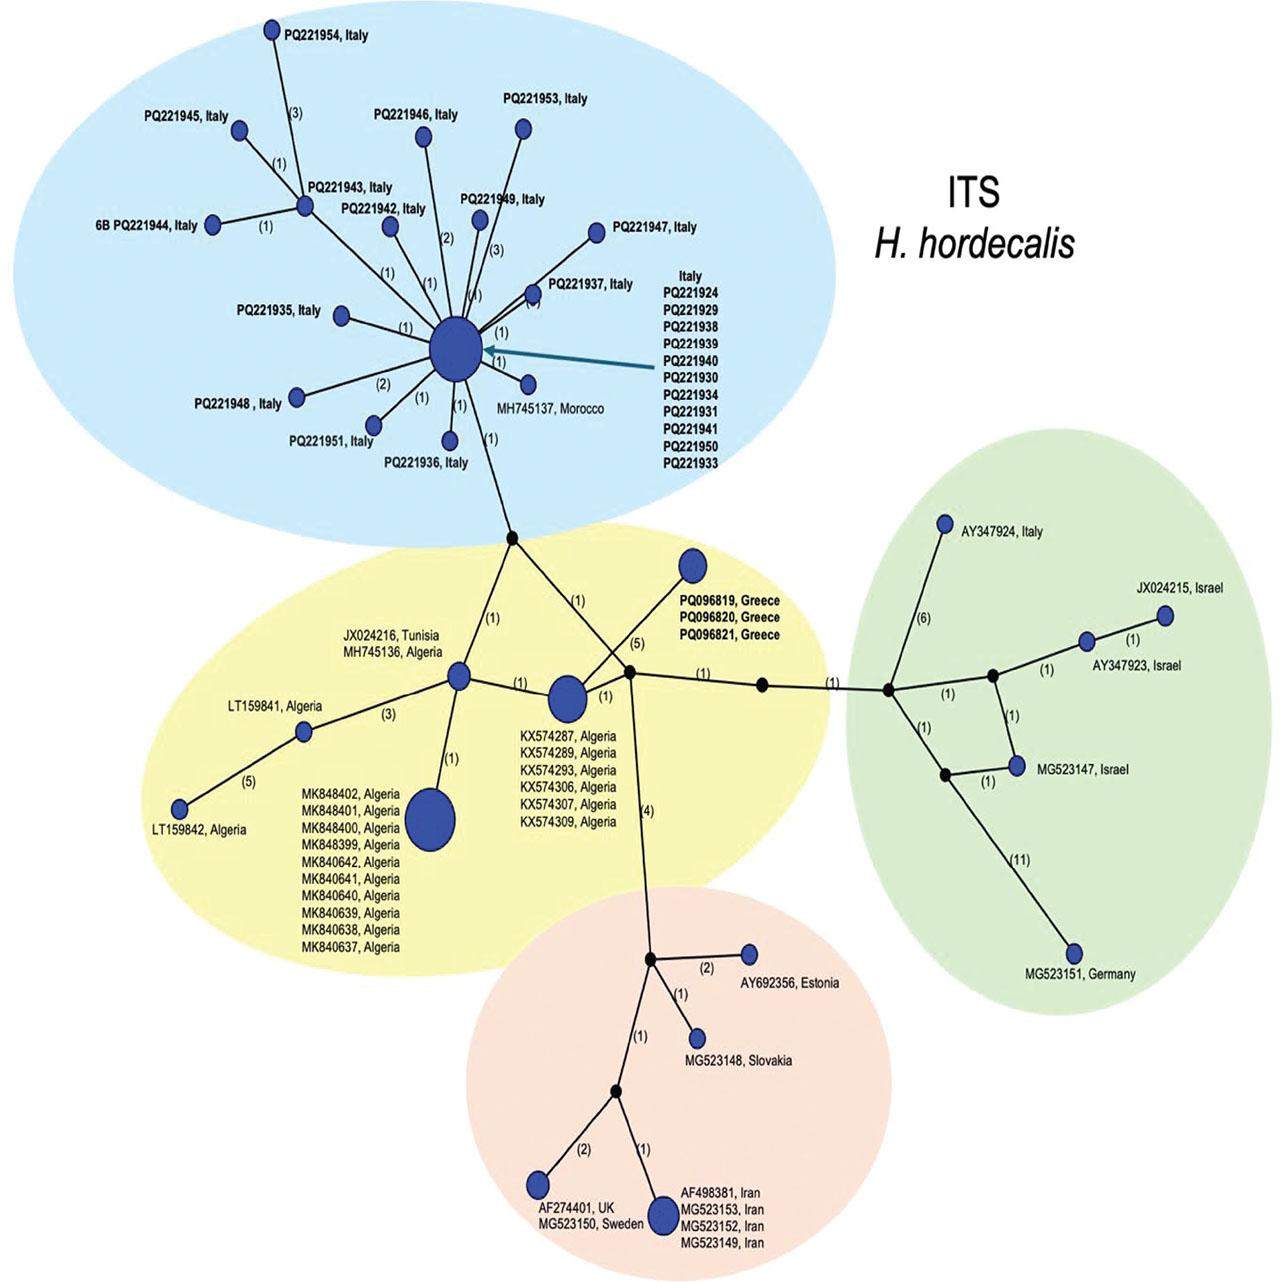
Figure 6:
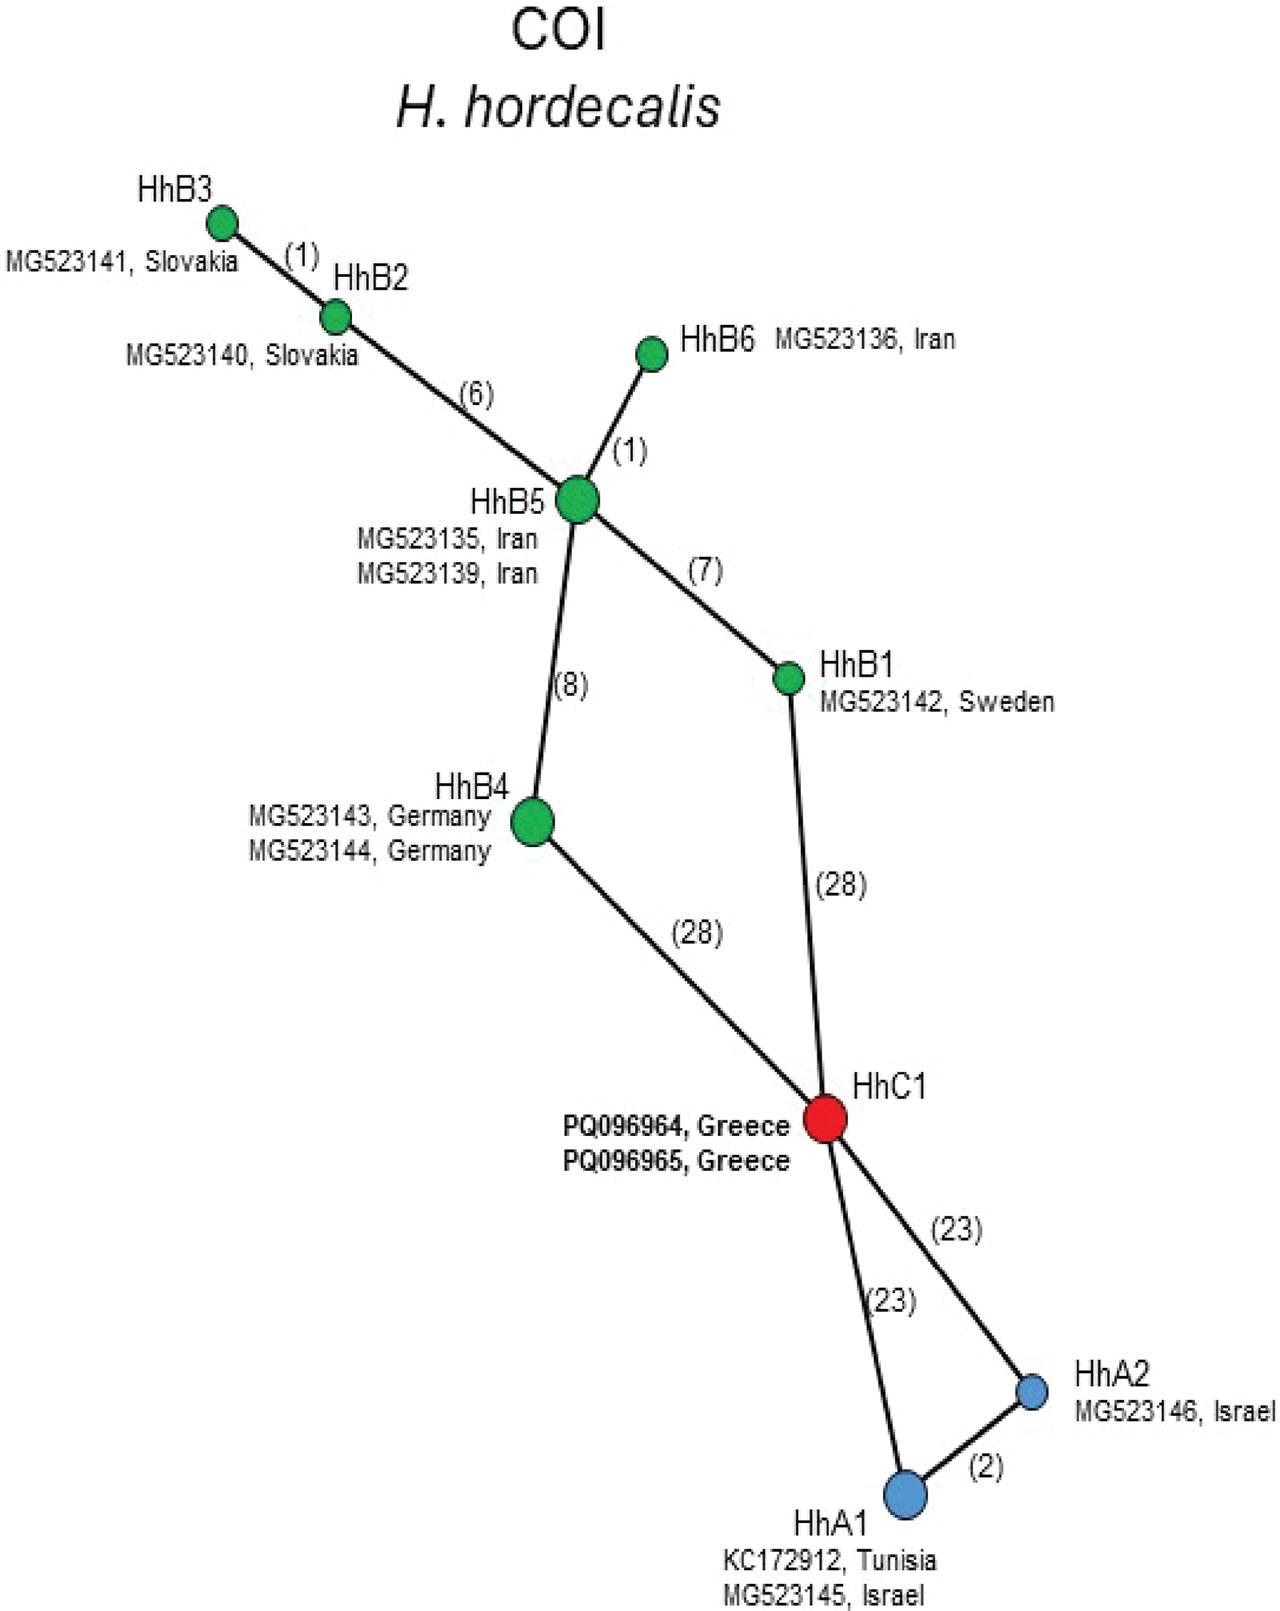
Figure 7:
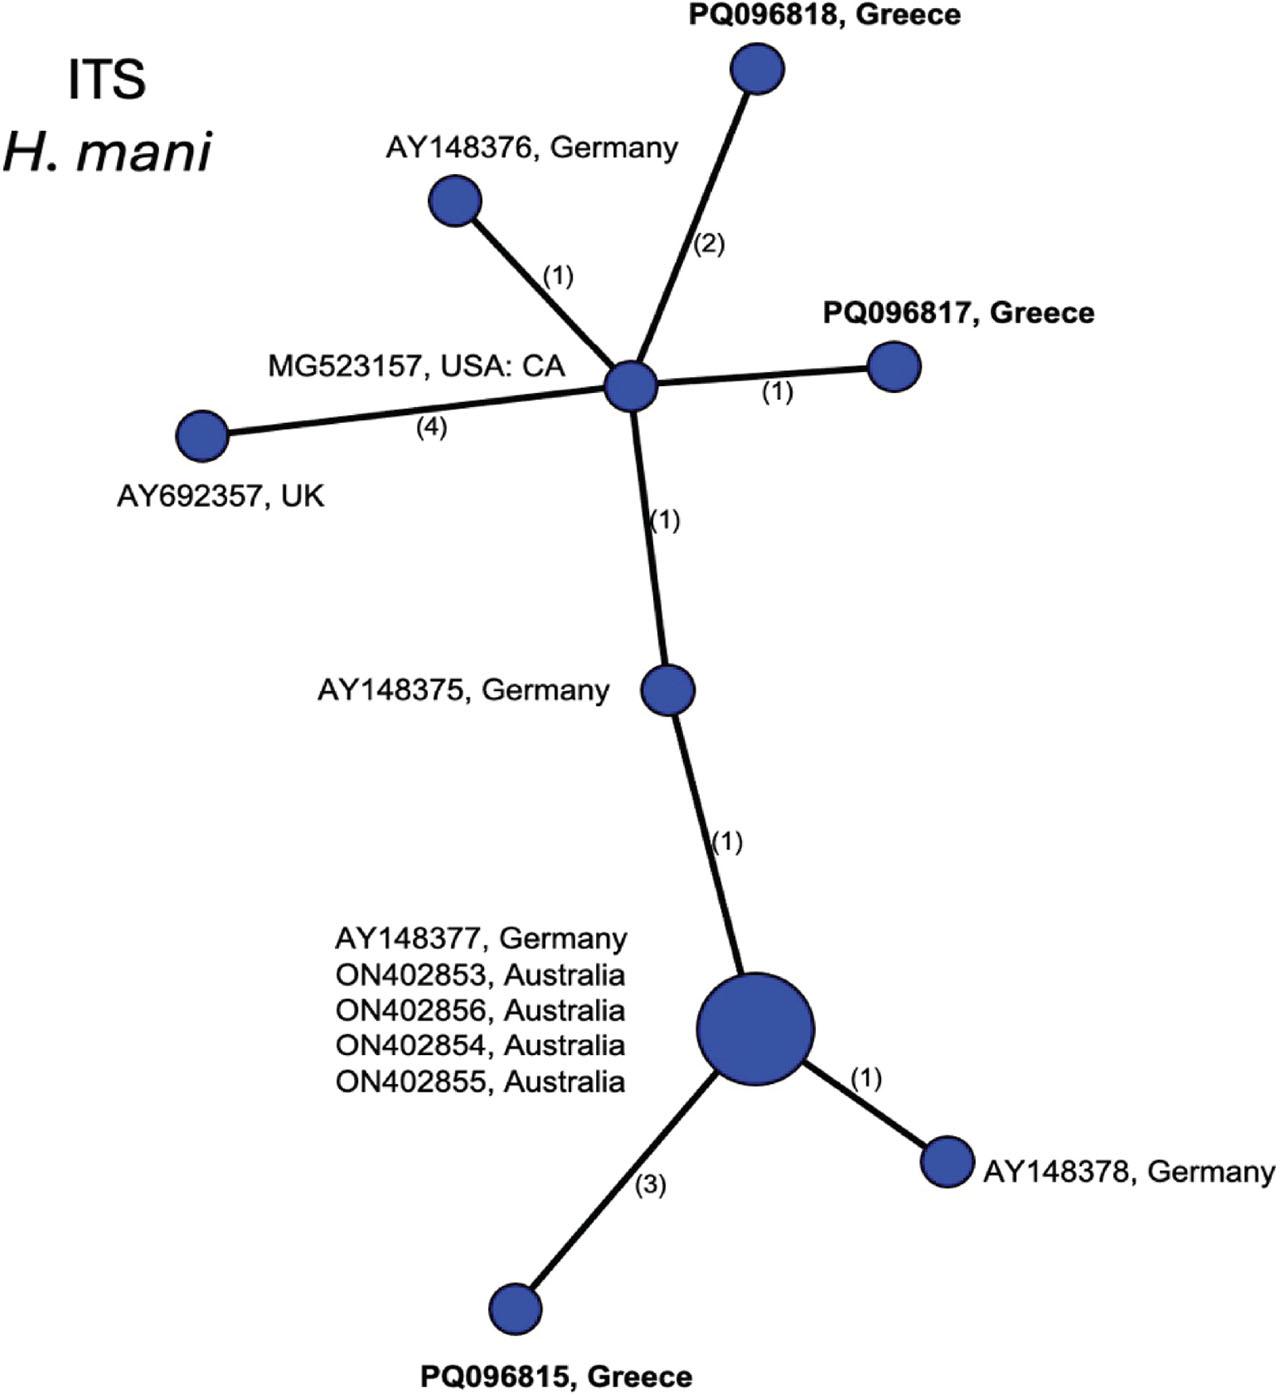
Figure 8:
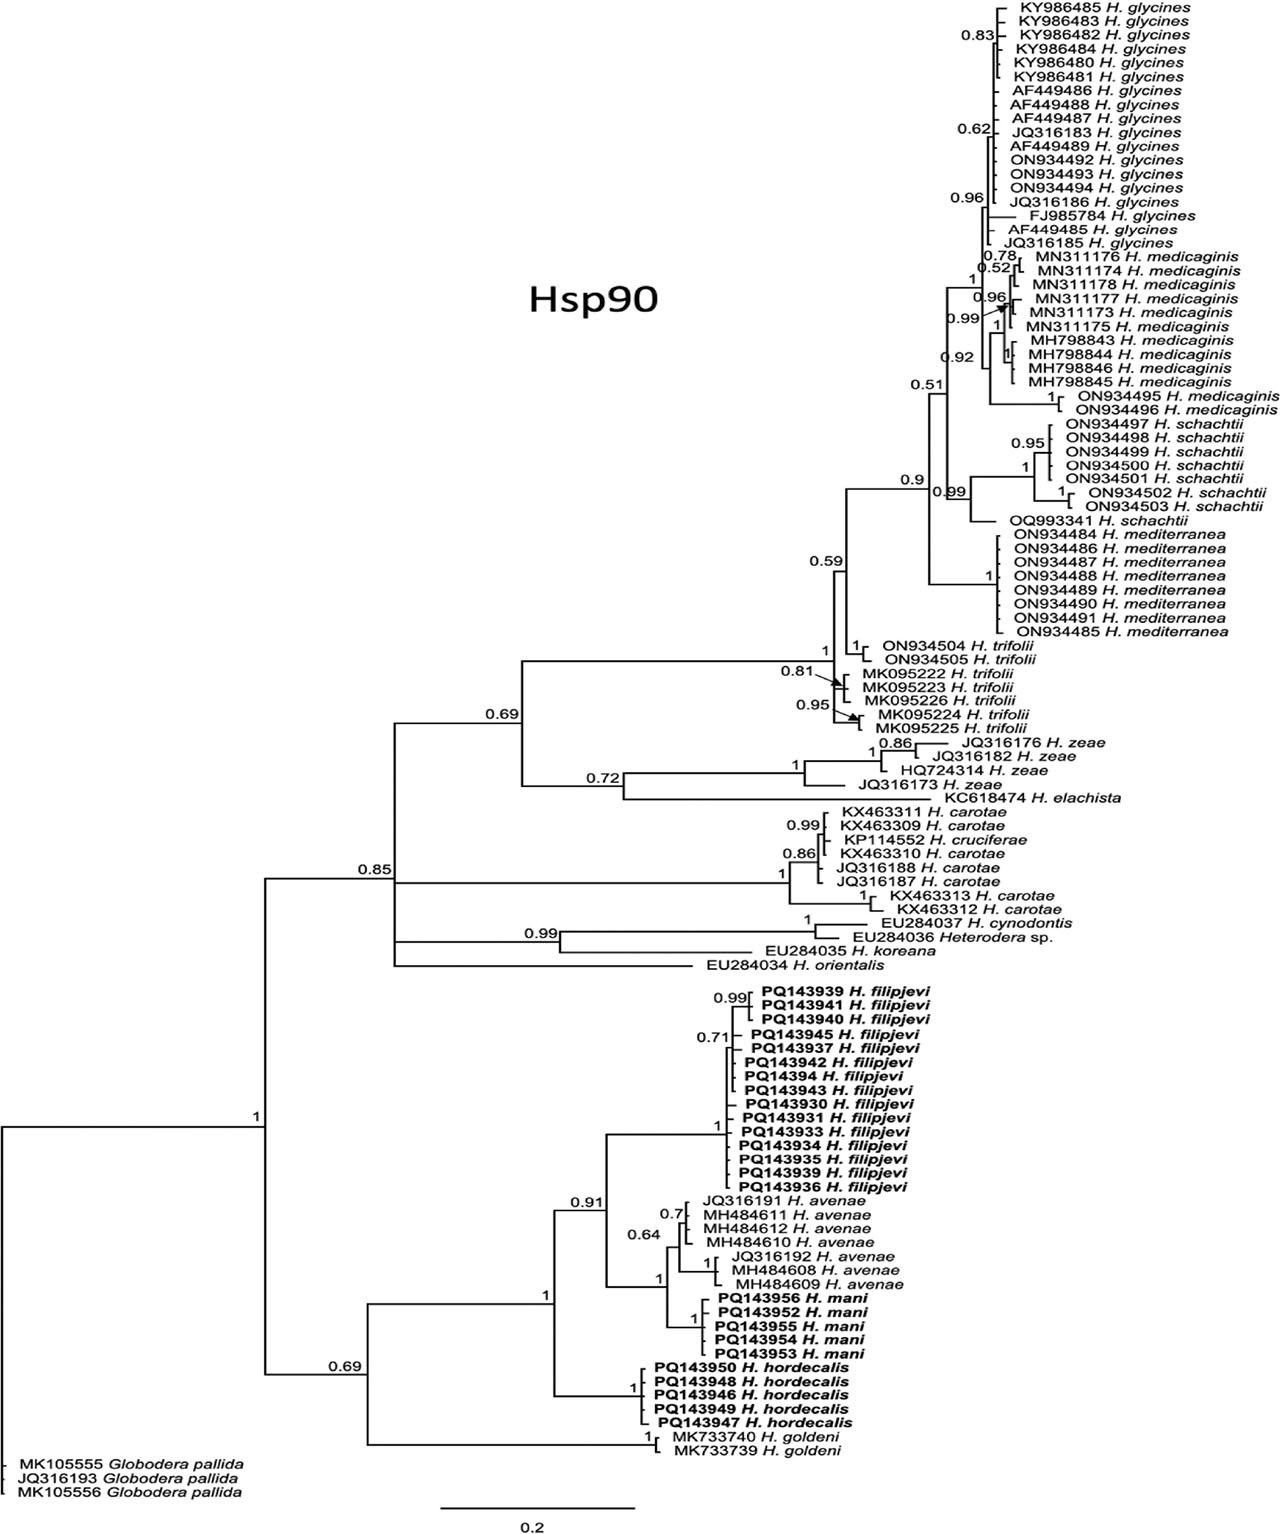
Molecular similarity of 28S, ITS, mtCOI, and Hsp90 sequences obtained from Greek isolates of Avenae group species relative to existing sequences in GenBank_ Intraspecific variation refers to differences among sequences recovered from each new population_
| Marker | Species name | Heterodera filipjevi | Heterodera filipjevi | Heterodera filipjevi | Heterodera filipjevi | Heterodera hordecalis | Heterodera mani |
|---|---|---|---|---|---|---|---|
| Source | Potato field | Potato field | Turfgrass | Wheat | Potato field | Garlic field | |
| Location, year | Viotia Greece, M1 2013 | Livadia Greece, B12 2015 | Athens, Greece 2021 | Oregon, USA 2008 | Laconia, Greece M2, 2013 | Thiva, Greece 2021 | |
| 28S | Population Code | 86G | 96E | 115H | 35A | 86H | 116A |
| intraspecific variation* | 0 bp | 0 bp | 0 bp | 0 bp | 0 bp | 0 bp | |
| closest GenBank hit | GU083592 | MG859980 | MG859980 | GU083592 | LT159829 | OQ918098 | |
| H. filipjevi | H. filipjevi | H. filipjevi | H. filipjevi | H. hordecalis | H. mani | ||
| ITS | coverage | 100% | 100% | 100% | 99% | 100% | 98% |
| % identity | 100% | 100% | 100% | 99.7% | 100% | 100% | |
| intraspecific variation* | 0 bp | 0–4 bp | 1–6 bp | 0 bp | 0–1 bp | 7–10 bp | |
| closest GenBank hit | MT254744 | MT254744 | MT254744 | MT254744 | MK840642 | MG523157 | |
| H. filipjevi | H. filipjevi | H. filipjevi | H. filipjevi | H. hordecalis | H. mani | ||
| COI | coverage | 100% | 100% | 98% | 100% | 100% | 100% |
| % identity | 100% | 99.8% | 99.9% | 100% | 99.0% | 99.8% | |
| intraspecific variation* | 0 bp | 0 bp | 0 bp | 1 bp | 2 bp | 0 bp | |
| closest GenBank hit | MG523083 | MK093059 | MK093059 | MK093059 | MG5232140 | MG523097 | |
| H. filipjevi | H. filipjevi | H. filipjevi | H. filipjevi | H. hordecalis | H. mani | ||
| Hsp90 | coverage | 90% | 96% | 84% | 97% | 88% | 99% |
| % identity | 99.5% | 98.3% | 99.0% | 99.8% | 91.48% | 100% | |
| intraspecific variation* | 3–64 bp | 0–16 | n/d | 12–24 bp | 4–9 bp | 0–11 bp | |
| closest GenBank hit | MH848608 | MH848608 | MH848608 | JQ316192 | MH484608 | ||
| H. avenae | H. avenae | H. avenae | H. avenae | H. avenae | |||
| coverage | 93% | 93% | 92% | 99% | 99% | ||
| % identity | 87.4% | 87.8% | 86.9% | 82.9% | 92.6% | ||
Main morphometric characters of J2 from Avenae-group of Heterodera species recovered during present study from Greece including H_ filipjevi, H_ hordecalis, and H_ mani_ All measurements except lateral lines are in micrometers (µm) and in the form of mean (range)_
| Morphometric characters | H. filipjevi | H. hordecalis | H. mani |
|---|---|---|---|
| Body length | 552 (462–662) | 464 (417–525) | 552 (526–578) |
| Stylet | 25 (23–26) | 24 (23–26) | 25 (24–26) |
| Tail | 61 (53–68) | 57 (48–63) | 65 (61–67) |
| Hyaline tail | 41 (33–50) | 36 (31–41) | 41 (39–42) |
| Lateral lines | 4 | 4 | 4 |
GenBank accession numbers of DNA markers from Avenae-group species including H_ filipjevi H_ hordecalis and H_ mani generated for this study_
| Species name | Code | Host | Location, year | GenBank accession numbers | |||
|---|---|---|---|---|---|---|---|
| 28S | ITS | mtCOI | Hsp90 | ||||
| Heterodera filipjevi | 86G | Potato field | Viotia Greece, M1, 2013 | PQ098459-PQ098461 | PQ096808-PQ096810 | PQ096970, PQ096971 | PQ143935-PQ143941 |
| 96E | Potato field | Livadia Greece, B12, 2015 | PQ098464-PQ098467 | PQ096802-PQ096804 | PQ096975, PQ096976 | PQ143942-PQ143945 | |
| 115H | Turfgrass | Athens, 2021 | PQ098468-PQ098470 | PQ096811-PQ096814 | PQ096972-PQ096974 | ||
| 35A | Wheat | Oregon, USA, 2008 | PQ098456-PQ098458 | PQ096805-PQ096807 | PQ096969, PQ096977 | PQ143930-PQ143934 | |
| Heterodera hordecalis | 86H1 | Potato field | Laconia, Greece, M2, 2013 | PQ098462-PQ098463 | PQ096819-PQ096821 | PQ096964-PQ096965 | PQ143946-PQ143950 |
| Heterodera mani | 116A | Garlic field | Thiva, Greece, 2021 | PQ098471-PQ098472 | PQ096815-PQ096818 | PQ096966-PQ096968 | PQ143951-PQ143956 |
Primers used for PCR amplification of DNA markers from Heterodera spp_
| Marker | Primers | Sequence 5′→3′ | Primer and PCR References |
|---|---|---|---|
| 28S | D2Ab | ACAAGTACCGTGAGGGAAAGTTG | De Ley et al., 2005 |
| D3B | TCGGAAGGAACCAGCTACTA | Ye et al., 2007 | |
| ITS | TW81 | GTTTCCGTAGGTGAACCTGC | Joyce et al., 1994 |
| AB28 | ATATGCTTAAGTTCAGCGGGT | Skantar et al., 2012 | |
| mtCOI | Het-cox-1F | TAGTTGATCGTAATTTTAATGG | Subbotin, 2015 |
| Het-cox-1R | CCTAAAACATAATGAAAATGWGC | ||
| Hsp90 | U288 | GAYACVGGVATYGGNATGACYAA | Skantar and Carta, 2005 |
| L1110 | TCRCARTTVTCCATGATRAAVAC |