
Table 1:
Pepper genotypes and their corresponding gene(s) for resistance employed in the current study.
| Pepper genotype | Known RKN resistance gene(s) | Reference |
|---|---|---|
| ‘Charleston Belle’ | N | Fery et al., 1998 |
| HDA 149 | Me3 | Djian-Caporalino et al., 2007 |
| HDA 330 | Me1 | Djian-Caporalino et al, 2007 |
| PM 217 | Me1, Me2 | Djian-Caporalino et al., 2007; Berthou et al., 2003 |
| PM 687 | Me3, Me4 | Djian-Caporalino et al., 2007 |
| PA 136 | None | Dukes et al., 1992 |
| ‘Carolina Wonder’ (CW) | N | Fery et al., 1998 |
| CW X PA136, F1 Hybrid | N | This study |
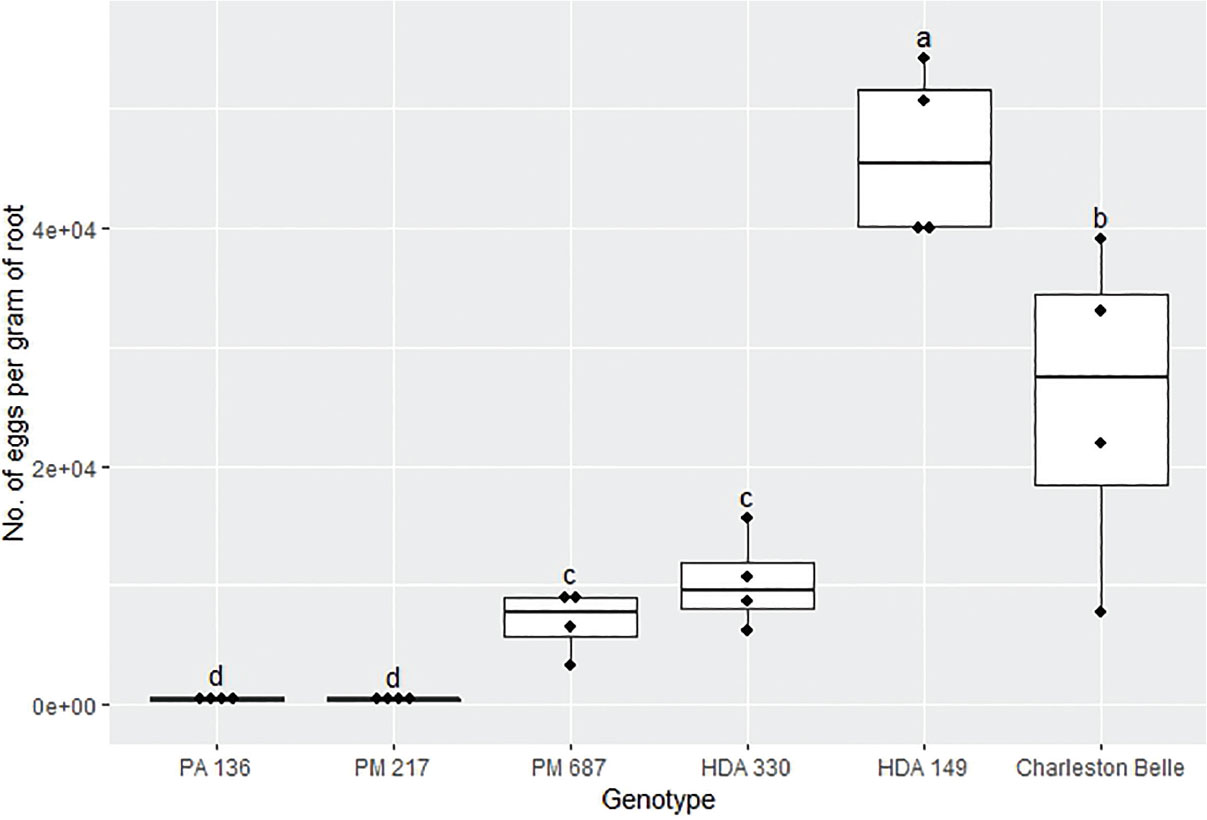
Figure 1:
Reproduction of Meloidogyne floridensis on pepper genotypes in the growth chamber experiment conducted at Clemson University. Data represent the distribution of four replications. Tukey style box and whisker plots are presented with individual dot points representing scores from individual plants. Treatments sharing a common letter are not significantly different according to Student's t-test (P ≤ 0.05). The middle crossbar represents the median, the outer crossbars represent the 25th and 75th quartiles and the whiskers represent 3/2 times the interquartile range of the data.
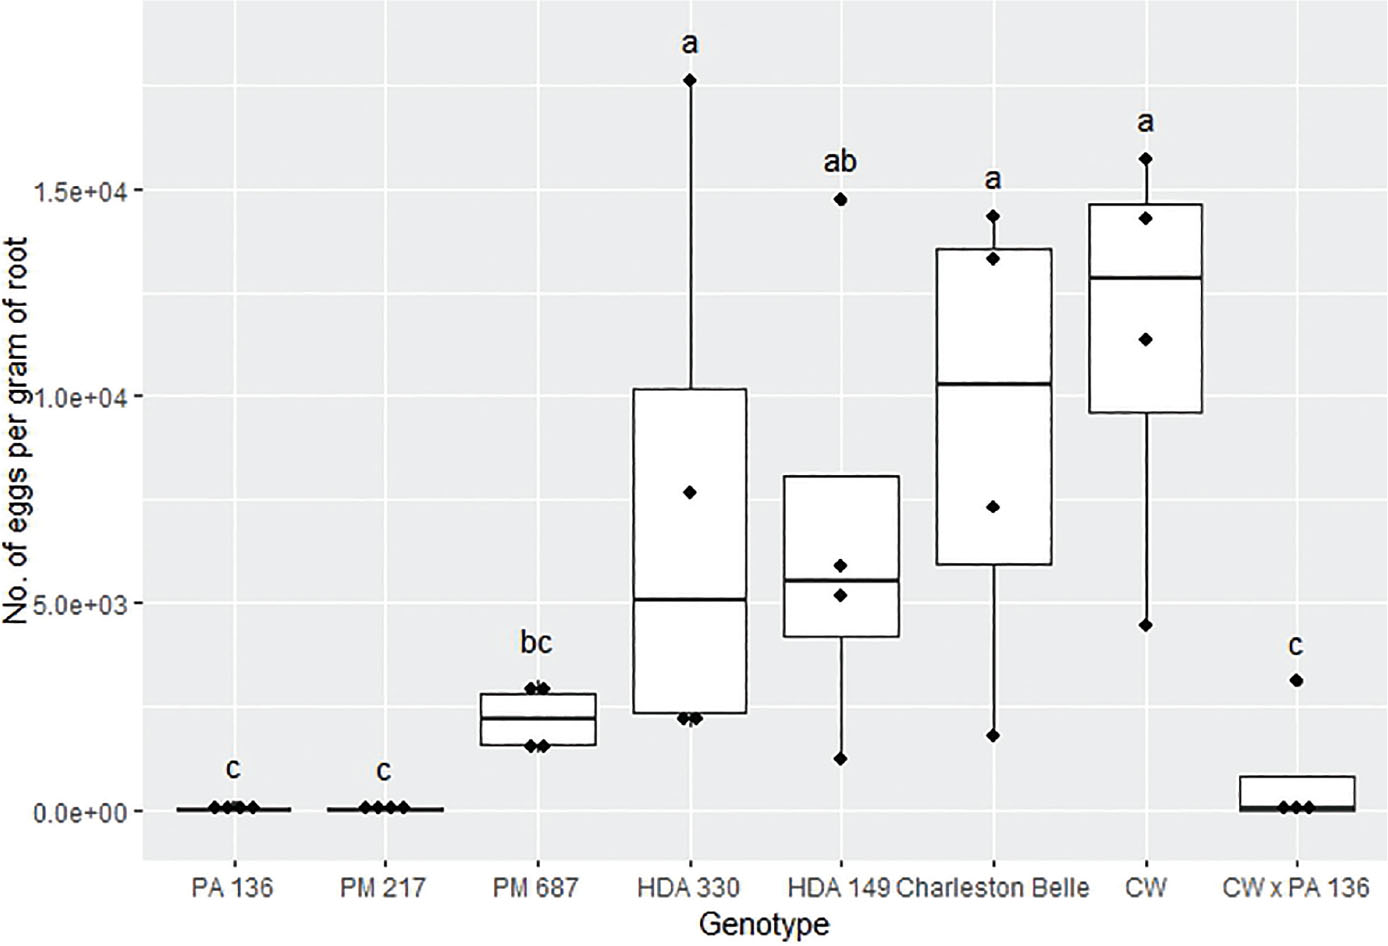
Figure 2:
Reproduction of Meloidogyne floridensis on pepper genotypes in the first greenhouse experiment conducted at Clemson University. Data represent the distribution of four replications. Tukey style box and whisker plots are presented with individual dot points representing scores from individual plants. Treatments sharing a common letter are not significantly different according to Student's t-test (P ≤ 0.05). The middle crossbar represents the median, the outer crossbars represent the 25th and 75th quartiles and the whiskers represent 3/2 times the interquartile range of the data. CW refers to cultivar ‘Carolina Wonder’.
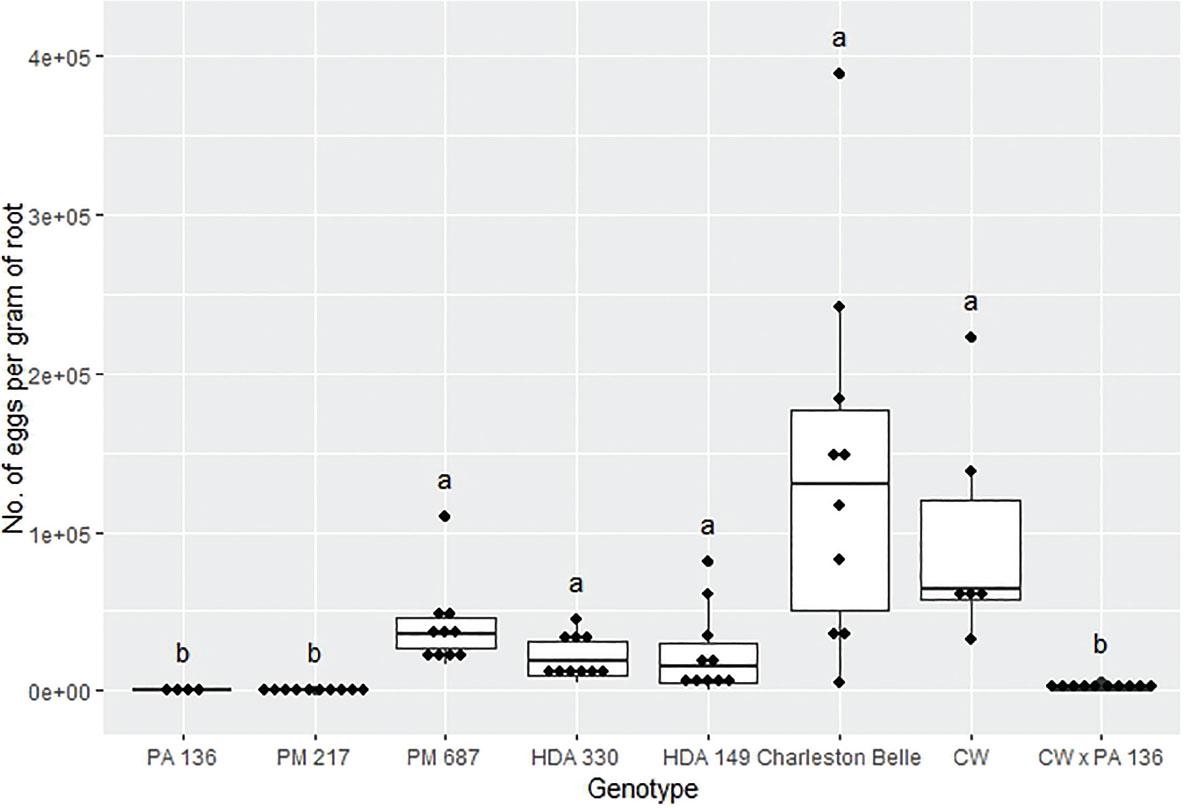
Figure 3:
Reproduction of Meloidogyne floridensis on pepper genotypes in the first greenhouse experiment conducted at the USDA. Data represent the distribution of ten replications unless otherwise noted*. Tukey style box and whisker plots are presented with individual dot points representing scores from individual plants. Treatments sharing a common letter are not significantly different according to Student's t-test (P ≤ 0.05). The middle crossbar represents the median, the outer crossbars represent the 25th and 75th quartiles and the whiskers represent 3/2 times the interquartile range of the data. CW refers to cultivar ‘Carolina Wonder’. *Due to low seed germination two lines had less than ten replicates PA 136 had four replicates and CW had six replicates.
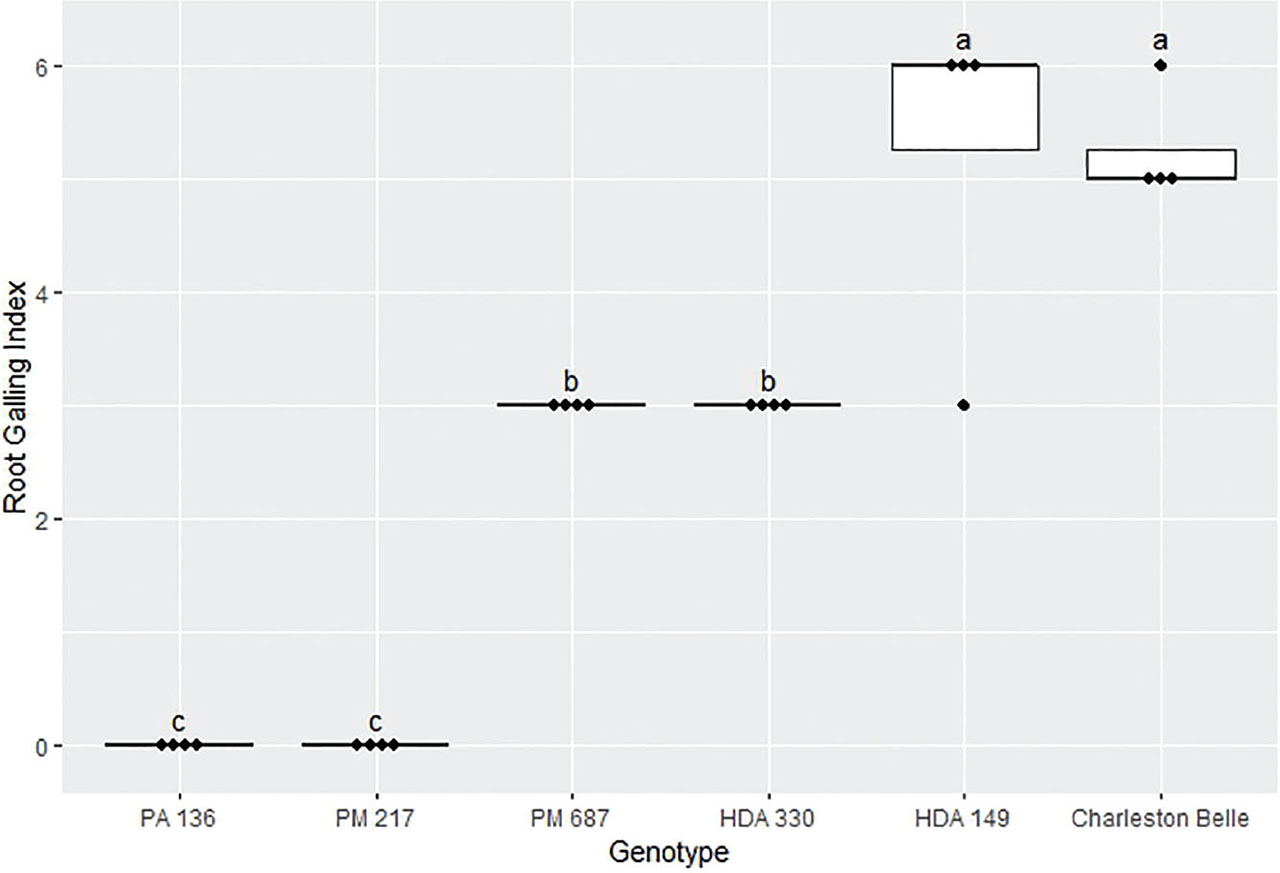
Figure 4:
Root galling caused by Meloidogyne floridensis on pepper genotypes in the growth chamber experiment. Data represent the distribution of four replications. Tukey style box and whisker plots are presented with individual dot points representing scores from individual plants. Treatments sharing a common letter are not significantly different according to Student's t-test (P ≤ 0.05). The middle crossbar represents the median, the outer crossbars represent the 25th and 75th quartiles and the whiskers represent 3/2 times the interquartile range of the data. CW refers to cultivar ‘Carolina Wonder’.
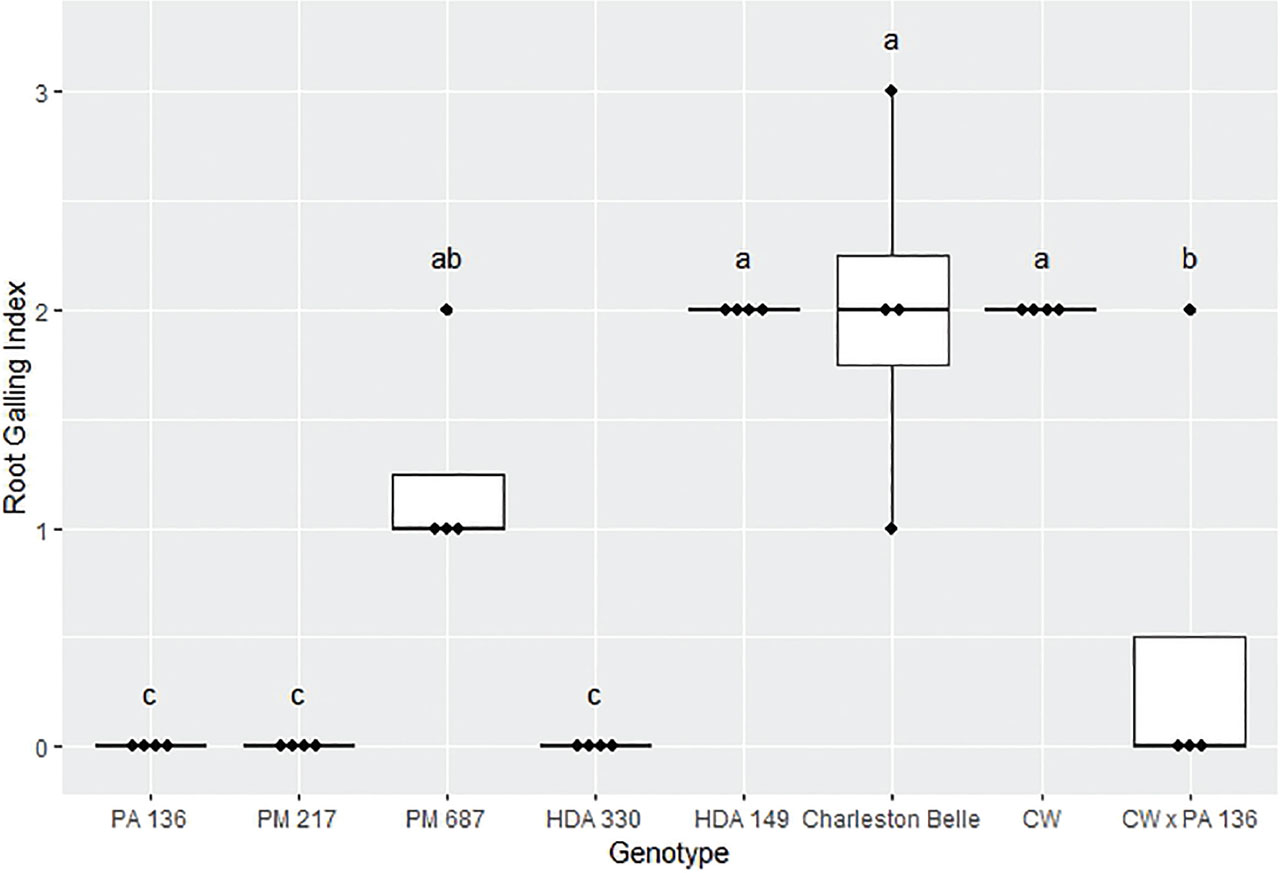
Figure 5:
Root galling caused by Meloidogyne floridensis on pepper genotypes in the first greenhouse experiment conducted at Clemson University. Data represent the distribution of four replications. Tukey style box and whisker plots are presented with individual dot points representing scores from individual plants. Treatments sharing a common letter are not significantly different according to Student's t-test (P ≤ 0.05). The middle crossbar represents the median, the outer crossbars represent the 25th and 75th quartiles and the whiskers represent 3/2 times the interquartile range of the data. CW refers to cultivar ‘Carolina Wonder’.
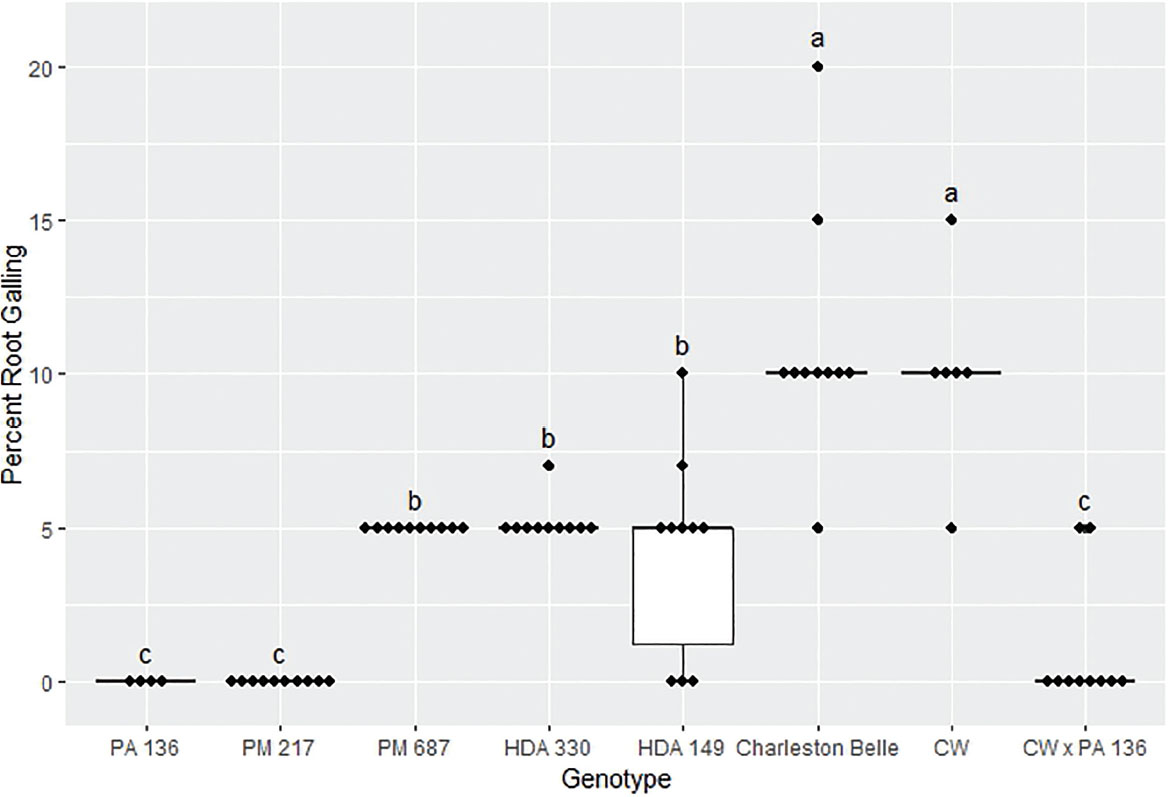
Figure 6:
Root galling caused by Meloidogyne floridensis on pepper genotypes in the first greenhouse experiment conducted at the USDA. Data represent the distribution of ten replications unless otherwise noted*. Tukey style box and whisker plots are presented with individual dot points representing scores from individual plants. Treatments sharing a common letter are not significantly different according to Student's t-test (P ≤ 0.05). The middle crossbar represents the median, the outer crossbars represent the 25th and 75th quartiles and the whiskers represent 3/2 times the interquartile range of the data. CW refers to cultivar ‘Carolina Wonder’. *Due to low seed germination two lines had less than ten replicates PA 136 had four replicates and CW had six replicates.