
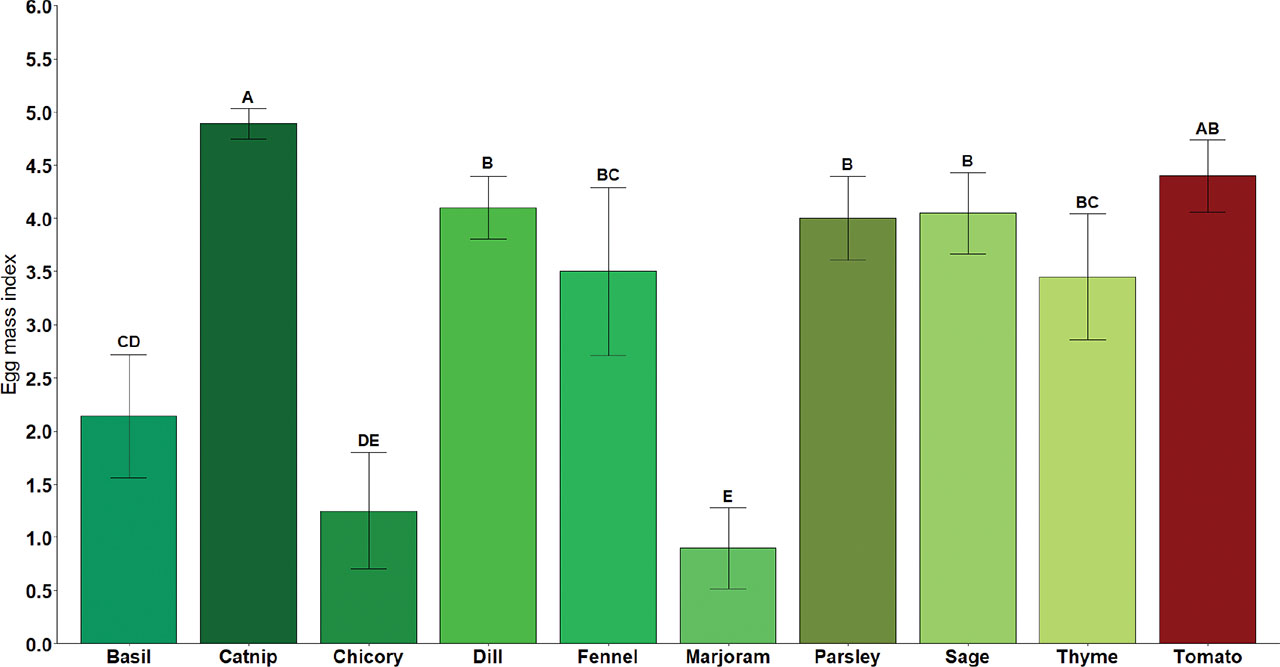
Figure 1:
Egg mass index (0 to 5 scale) of different culinary herbs and tomato (susceptible reference) after inoculation with two isolates of Meloidogyne floridensis. Bars represent the average of pooled data across isolates and experimental repeats (n = 20), and error bars indicate 95% confidence intervals. Significant differences among culinary herbs are shown by different letters (P < 0.05, Tukey’s HSD test). The egg mass index scale is based on the number of egg masses present in the root system (Taylor and Sasser, 1978): 0 = no egg masses, 1 = 1 to 2 egg masses, 2 = 3 to 10 egg masses, 3 = 11 to 30 egg masses, 4 = 31 to 100 egg masses, and 5 = more than 100 egg masses.
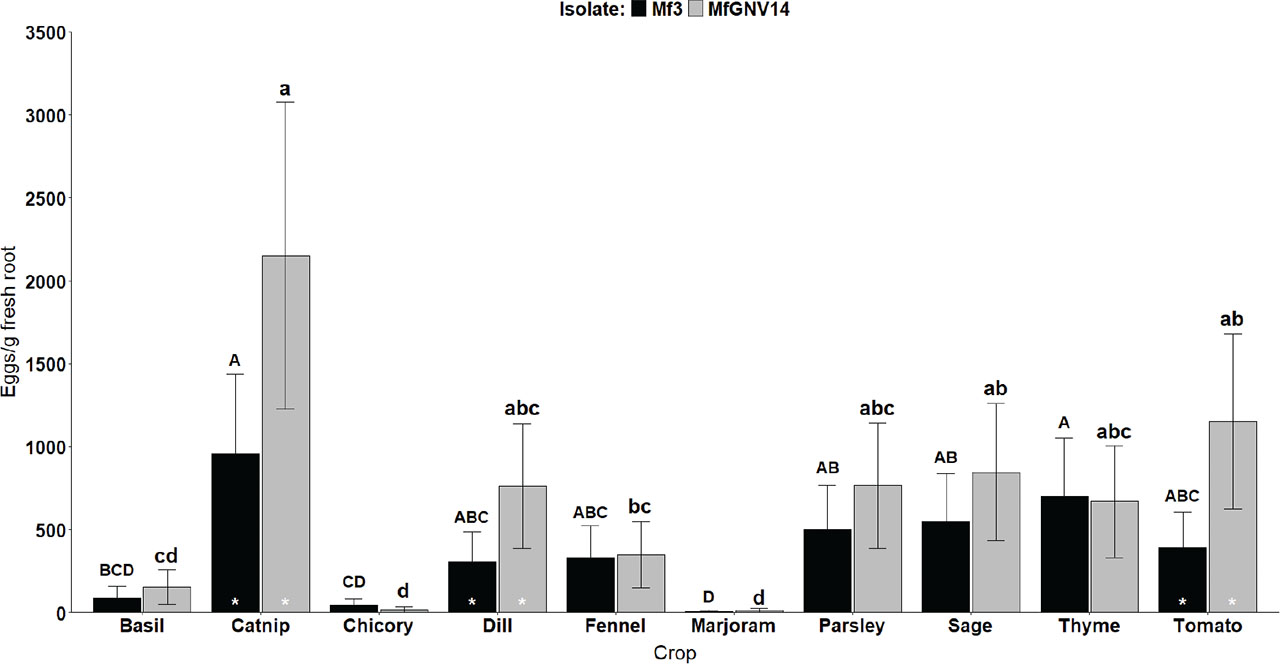
Figure 2:
Number of eggs/g fresh root (Eggs/g fresh root) at 60 days from nine culinary herbs and tomato (susceptible reference) after inoculation with two isolates of Meloidogyne floridensis, Mf3 and MfGNV14. Bars represent the average of pooled data across experimental repeats (n = 10), and error bars indicate 95% confidence intervals. Different uppercase and lowercase letters determine significant differences among culinary herbs for Mf3 and MfGNV14, respectively (P < 0.05, Tukey’s HSD test). The white asterisks at the bottom of the bars indicate differences between M. floridensis isolates (Mf3 and MfGNV14) within the same crop (P < 0.05, Tukey’s HSD test).
Table 1:
Gall index (GI) means (± standard deviation) and the reaction of different culinary herbs and tomato (susceptible reference) 60 days after inoculation with two Meloidogyne floridensis isolates, Mf3 and MfGNV14.
| Crop | Botanical name | GIa | Reaction | ||
|---|---|---|---|---|---|
| Mf3b | MfGNV14b | Average | |||
| Basil | Ocimum basilicum | 2.67 ± 1.22 | 2.80 ± 1.40 | 2.74C | S |
| Catnip | Nepeta cataria | 5.00 ± 0.00 | 5.00 ± 0.00 | 5.00A | S |
| Chicory | Cichorium intybus | 1.90 ± 1.37 | 1.80 ± 1.55 | 1.85CD | R |
| Dill | Anethum graveolens | 5.00 ± 0.00 | 5.00 ± 0.00 | 5.00A | S |
| Fennel | Foeniculum vulgare | 4.40 ± 0.97 | 3.80 ± 2.10 | 4.10AB | S |
| Marjoram | Origanum majorana | 1.20 ± 0.79 | 0.80 ± 0.92 | 1.00D | R |
| Parsley | Petroselinum crispum | 4.70 ± 0.48 | 4.80 ± 0.42 | 4.75AB | S |
| Sage | Salvia officinalis | 4.20 ± 1.03 | 4.60 ± 0.52 | 4.40AB | S |
| Thyme | Thymus vulgaris | 3.80 ± 0.63 | 4.10 ± 1.20 | 3.95B | S |
| Tomato | Solanum lycopersicum | 4.80 ± 0.42 | 4.90 ± 0.32 | 4.85AB | S |
a GI means from duplicate tests were based on a 0–5 scale where 0 = no galls or egg masses, 1 = 1–2, 2 = 3–10, 3 = 11–30, 4 = 31–100, 5 = >100 galls or egg masses per plant (Taylor and Sasser, 1978). The average values (pooled from both isolates and experiments) followed by different uppercase letters are significantly different based on Tukey’s HSD test (P ≤ 0.05) and values are to be compared vertically across crops in the same column.
Table 2:
Reproduction factor (RF) means (± standard deviation) and host status of different culinary herbs and tomato (susceptible reference) 60 days after inoculation with two Meloidogyne floridensis isolates, Mf3 and MfGNV14.
| Crop | Botanical name | RFa | Host statusc | ||
|---|---|---|---|---|---|
| Mf3b | MfGNV14b | Mf3 | MfGNV14 | ||
| Basil | Ocimum basilicum | 0.72 ± 0.96 BCa | 1.09 ± 1.27 BCDa | PH | GH |
| Catnip | Nepeta cataria | 5.65 ± 4.02 Aa | 10.20 ± 5.41 Aa | GH | GH |
| Chicory | Cichorium intybus | 0.22 ± 0.24 BCa | 0.11 ± 0.17 CDa | PH | PH |
| Dill | Anethum graveolens | 0.70 ± 0.56 BCb | 2.36 ± 1.16 ABa | PH | GH |
| Fennel | Foeniculum vulgare | 0.85 ± 0.56 BCa | 0.97 ± 0.82 BCDa | PH | PH |
| Marjoram | Origanum majorana | 0.01 ± 0.02 Ca | 0.02 ± 0.04 Da | NH | NH |
| Parsley | Petroselinum crispum | 1.36 ± 1.00 ABa | 2.17 ± 2.07 Ba | GH | GH |
| Sage | Salvia officinalis | 0.83 ± 1.21 BCa | 1.64 ± 1.17 BCa | PH | GH |
| Thyme | Thymus vulgaris | 0.32 ± 0.14 BCa | 0.72 ± 0.74 BCDa | PH | PH |
| Tomato | Solanum lycopersicum | 1.87 ± 2.81 ABa | 3.81 ± 3.61 ABa | GH | GH |
a RF means from duplicate tests in the same column followed by different uppercase letters are significantly different based on Tukey’s HSD test (P ≤ 0.05), and values are to be compared vertically across crops within the same M. floridensis isolate. In contrast, RF means in the same row followed by different lowercase letters are significantly different (P ≤ 0.05). Values are to be compared horizontally between M. floridensis isolates for each corresponding crop.
c Host status classification was based on the RF values: good host (GH) when RF ≥ 1, poor host (PH) when 0.1 < RF < 1, and non-host (NH) when RF ≤ 0.1 (Sasser et al., 1984).