
Figure 1:
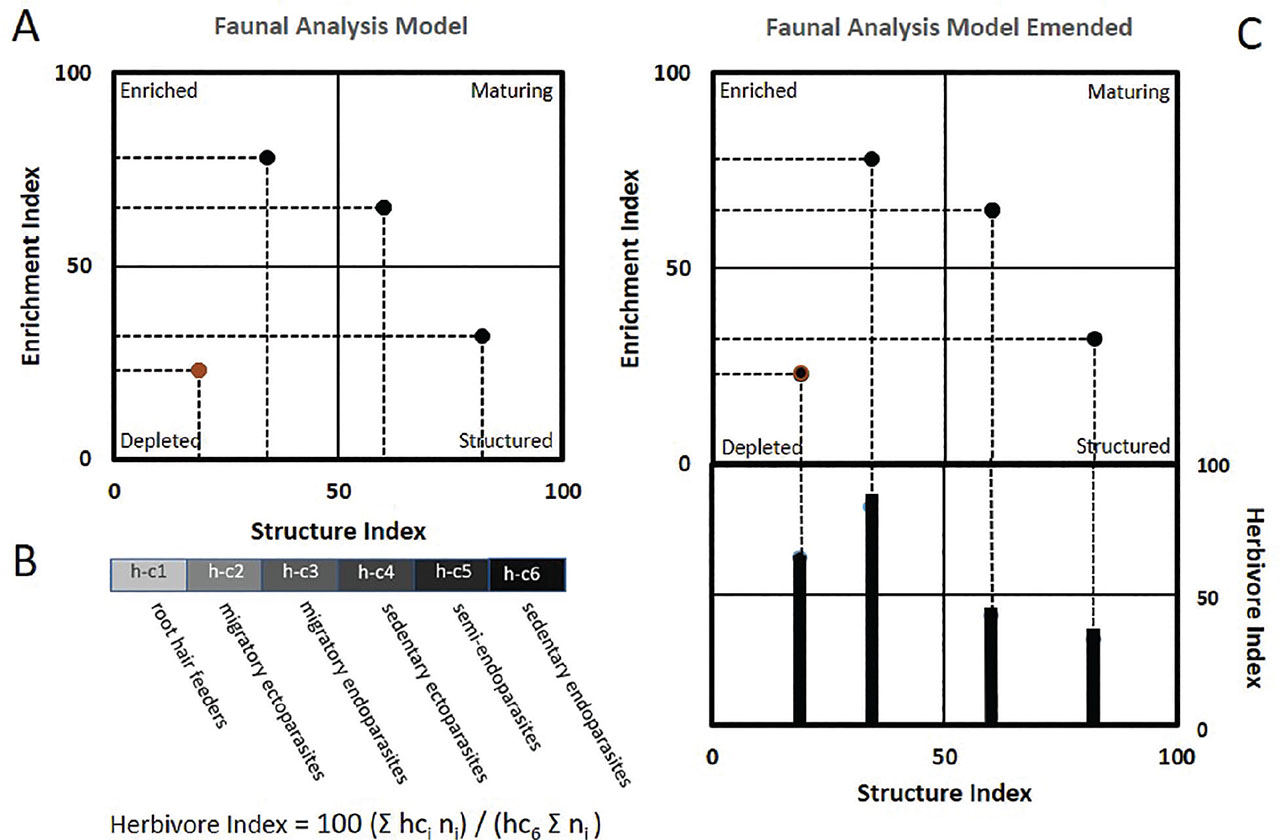
A: Nematode Faunal Analysis Model per Ferris et al., 2001) with sample data for four locations; B: Components of an Herbivore Index; C: Emended Faunal Analysis Model with Herbivore Index incorporated with sample data for four locations.
Table 1A.
Herbivore impact channel in Nematode Faunal Analysis with damage potential based on the average body mass of adult females in each h-c category (Fig. 1B) (Body mass data from Nemaplex accessed June 2024).
| h-c category | Female Body Mass μg hci | Number of observations |
|---|---|---|
| 1. Root hair feeders | 0.031 | 483 |
| 2. Migratory ectoparasites | 0.008 | 274 |
| 3. Migratory endoparasites | 0.581 | 350 |
| 4. Sedentary ectoparasites | 0.656 | 1012 |
| 5. Semi-endoparasites | 0.128 | 412 |
| 6. Sedentary endoparasites | 34.942 | 606 |
Table 1B.
Sample calculation of Herbivore Index, HI = (100 (Σ hci ni) / (hc6 Σ ni) for integration with Emended Nematode Faunal Analysis Model – Figs. 1 B,C)
| Genus | Functional Class | Sample Abundance ni | Weight hci | Weighted. Abundance hci*ni |
|---|---|---|---|---|
| Tylenchorhynchus | hc2 Migratory ectoparasites | 54 | 0.008 | 0.432 |
| Pratylenchus | hc3 Migratory endoparasites | 13 | 0.581 | 42.423 |
| Belonolaimus | hc4 Sedentary ectoparasites | 73 | 0.656 | 7.872 |
| Rotylenchulus | hc5 Semi-endoparasites | 12 | 0.128 | 1.664 |
| Meloidogyne | hc6 Sedentary endoparasites | 45 | 34.942 | 1572.39 |
| Total Abundance (Σ ni) | 197 | |||
| Total Weighted Abundance (Σ hci ni) | 1624.77 | |||
| Herbivore Index (100 (Σ hci ni) / (hc6 Σ ni)) | 23.60 |
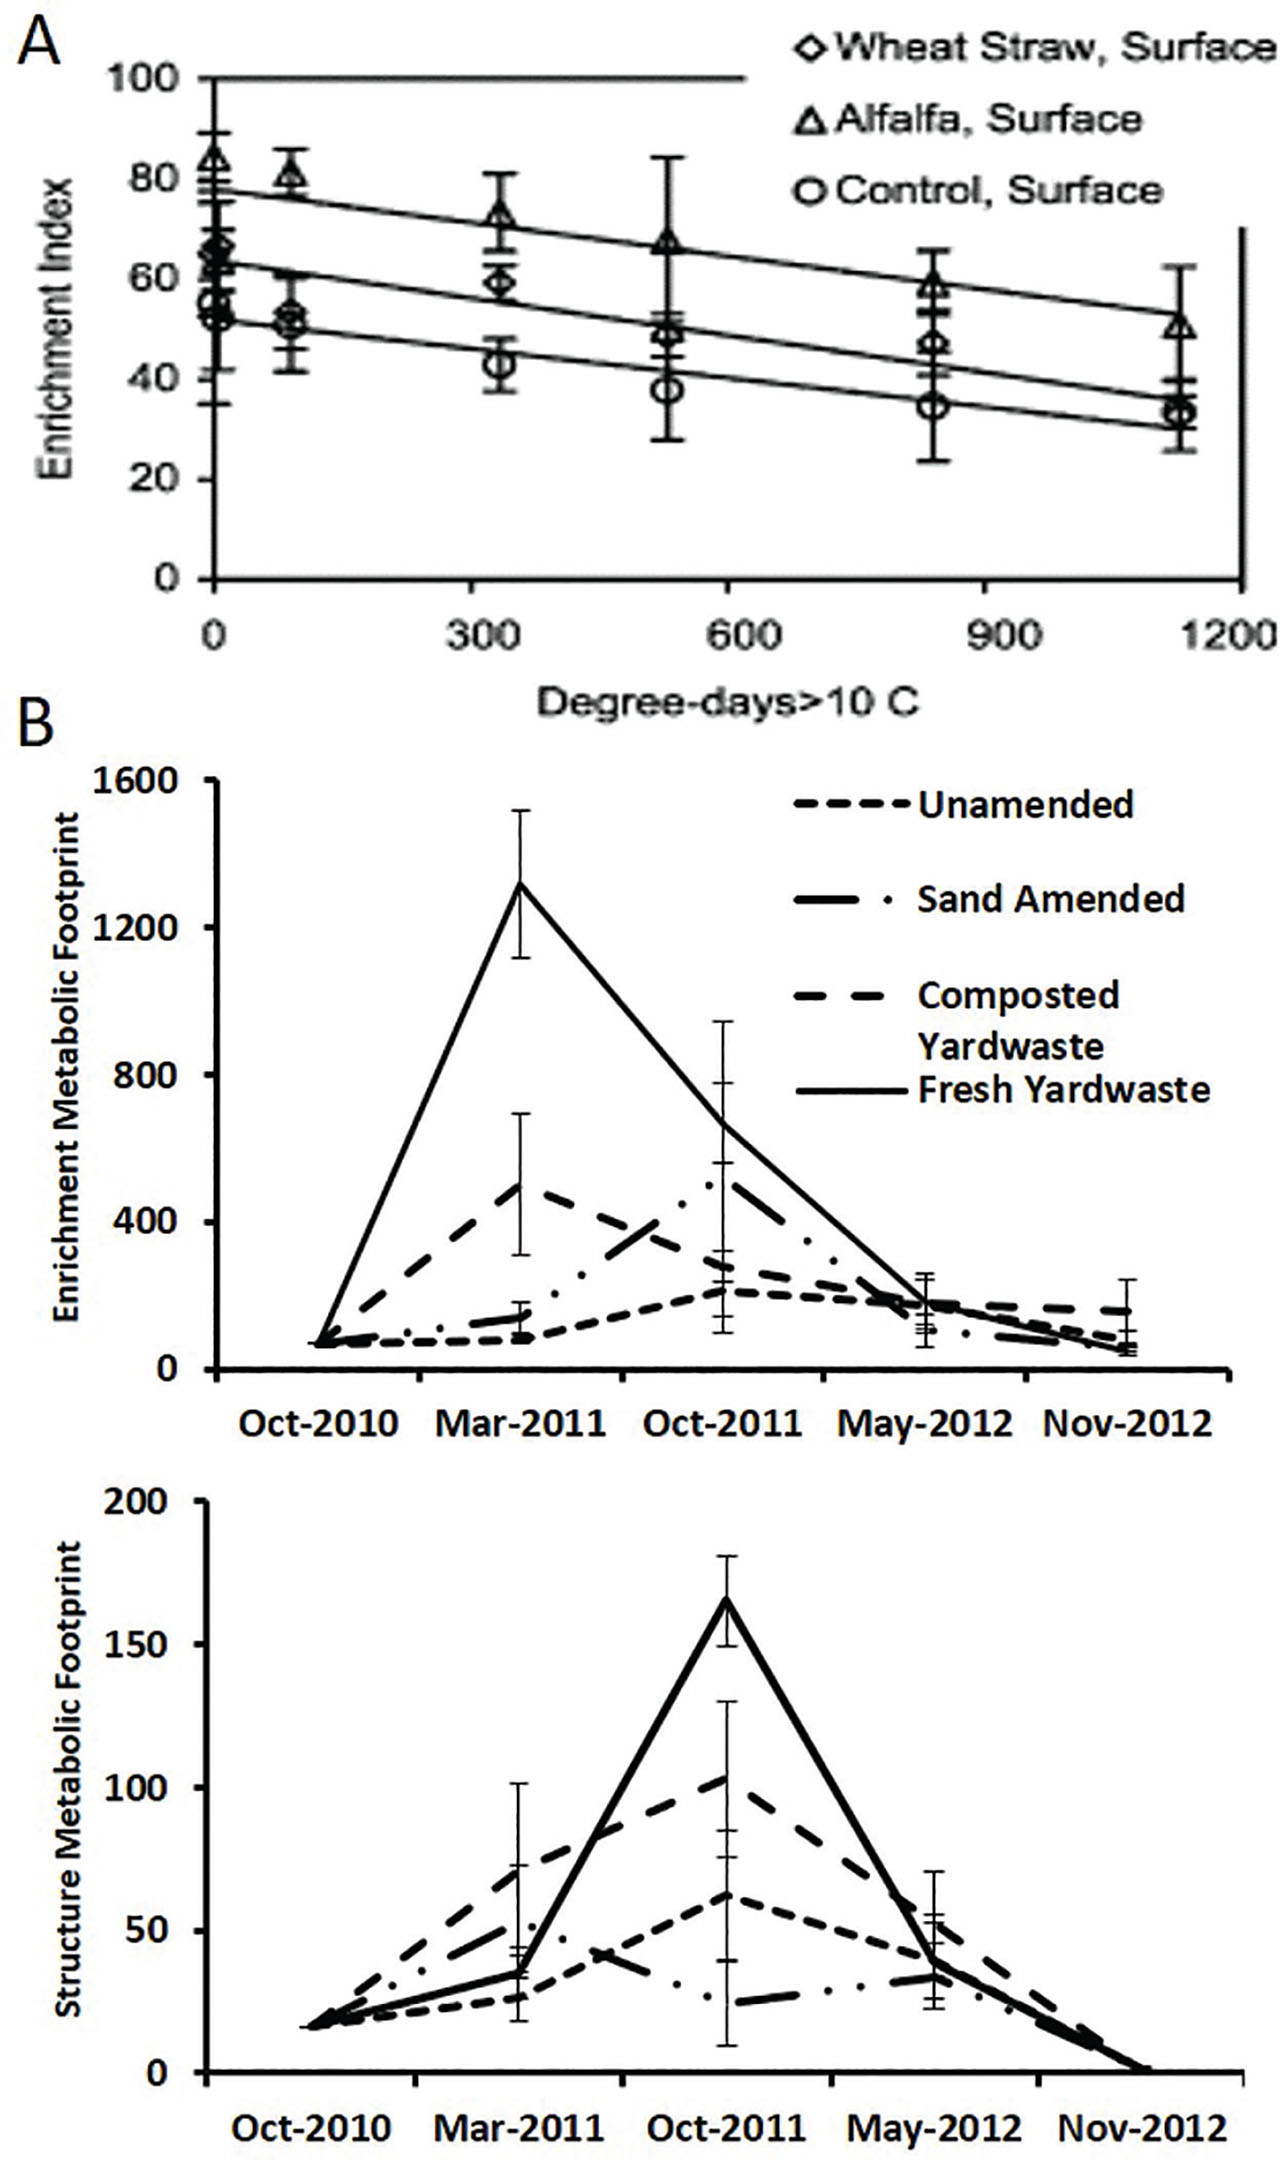
Figure 2:
A: Effect on Enrichment Index of resource diminution over 9 months (data from Ferris and Matute, 2003); B: Succession in the Enrichment and Structure Footprint for 2 years following resource amendment. Based on a field trial by Dr. James Downer, Hansen Research and Extension Center, Ventura County, California.
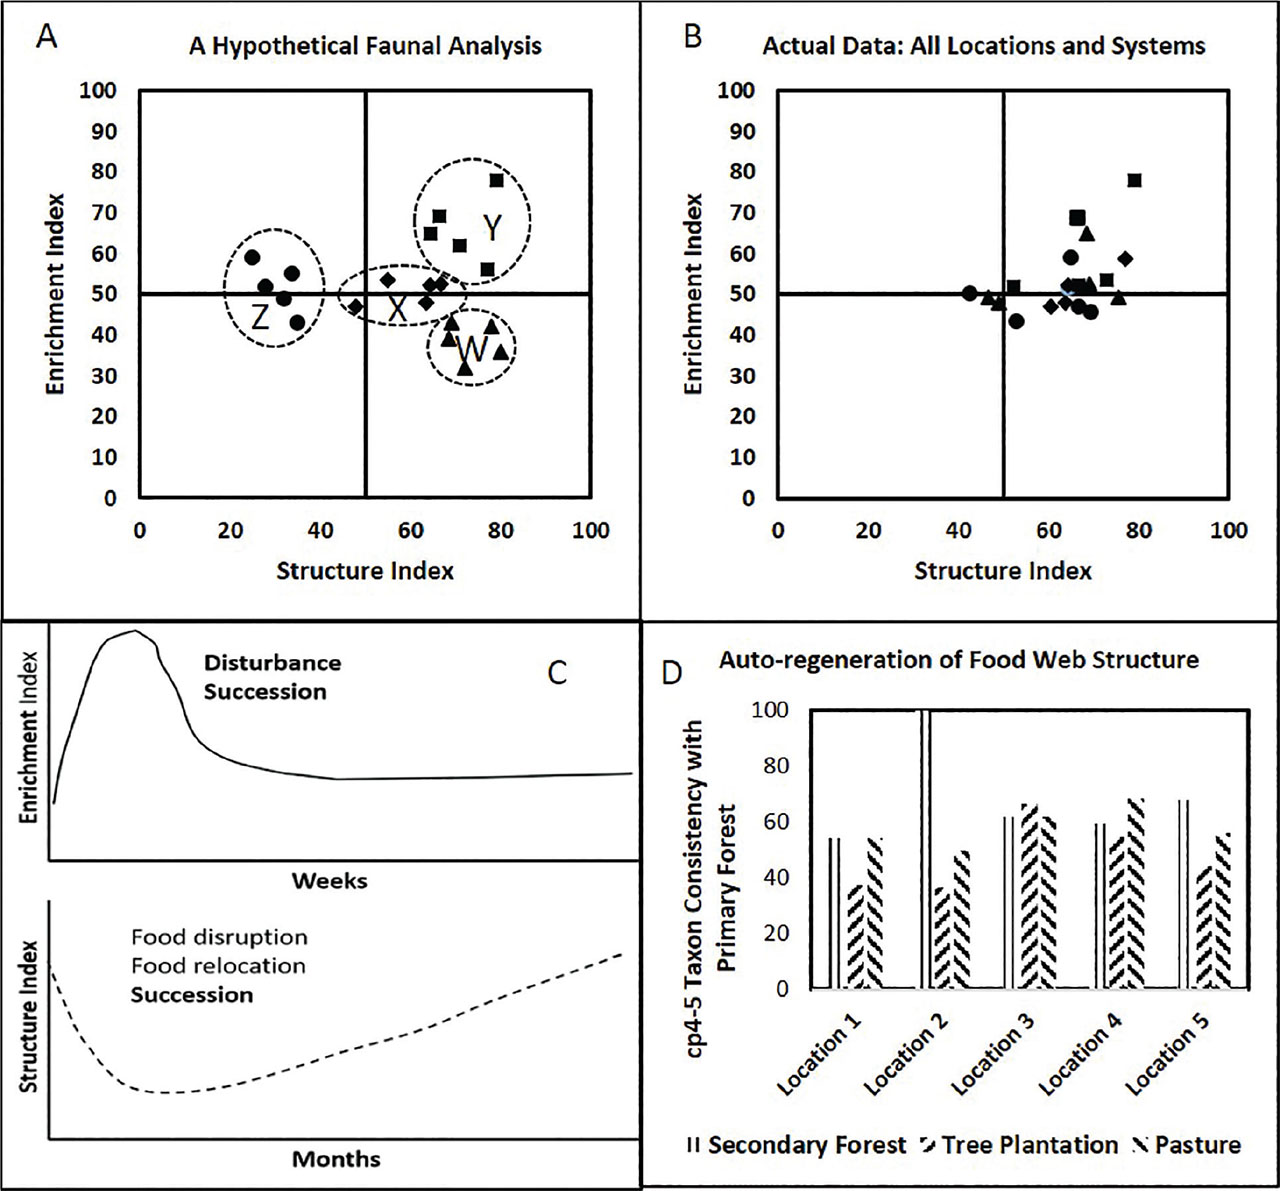
Figure 3:
A: Hypothetical effects of primary forest clearing; letters indicate expected locations of the intersection of enrichment and structure trajectories after the disturbances, W: residual primary forest, X: secondary forest, Y: tree plantation, Z: pasture; B: Actual Faunal Analysis of residual primary forest, secondary forest, tree plantation and pasture.; C: Hypothetical auto-regeneration of enrichment and structure indicator components of the soil food web after a major disturbance, note time scale differences; D: Consistency of c-p 4 and 5 taxa 3 to 30 years after a disturbance as a percentage of those in primary forest. Data from Varela-Benavides et al. (2022).