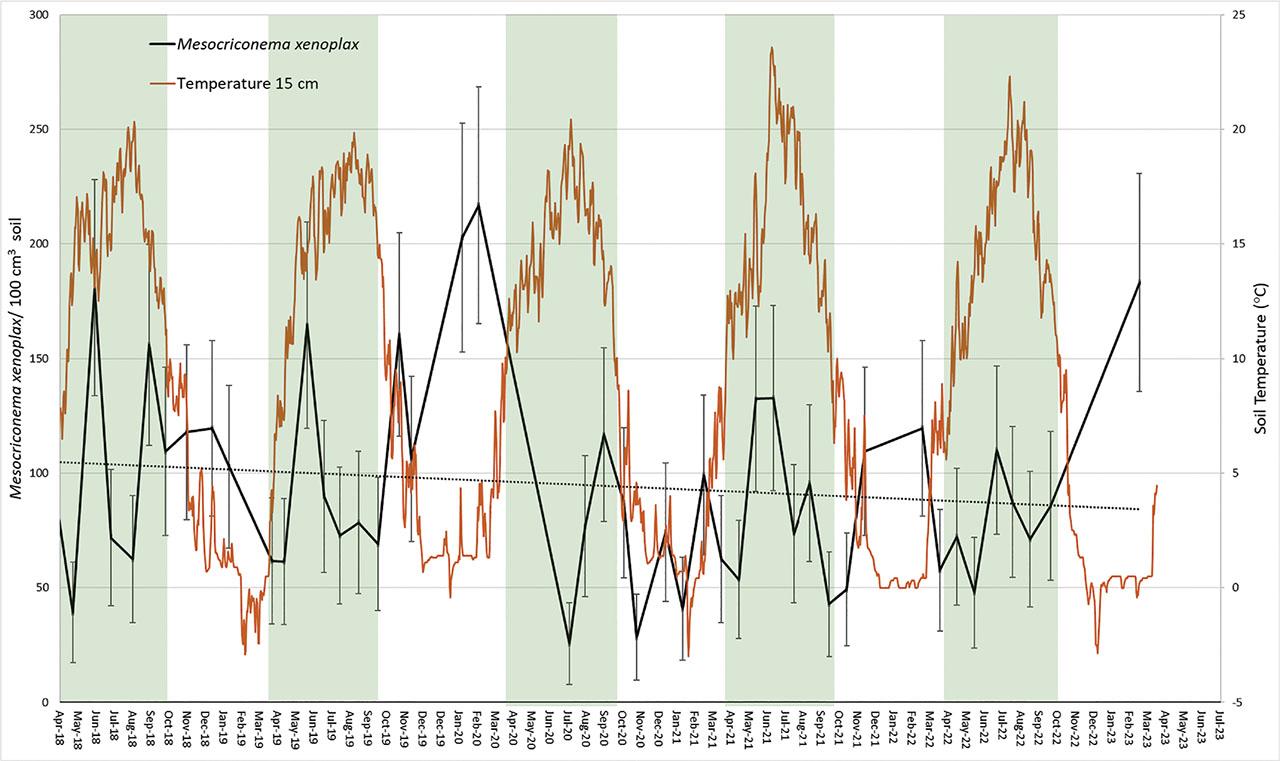
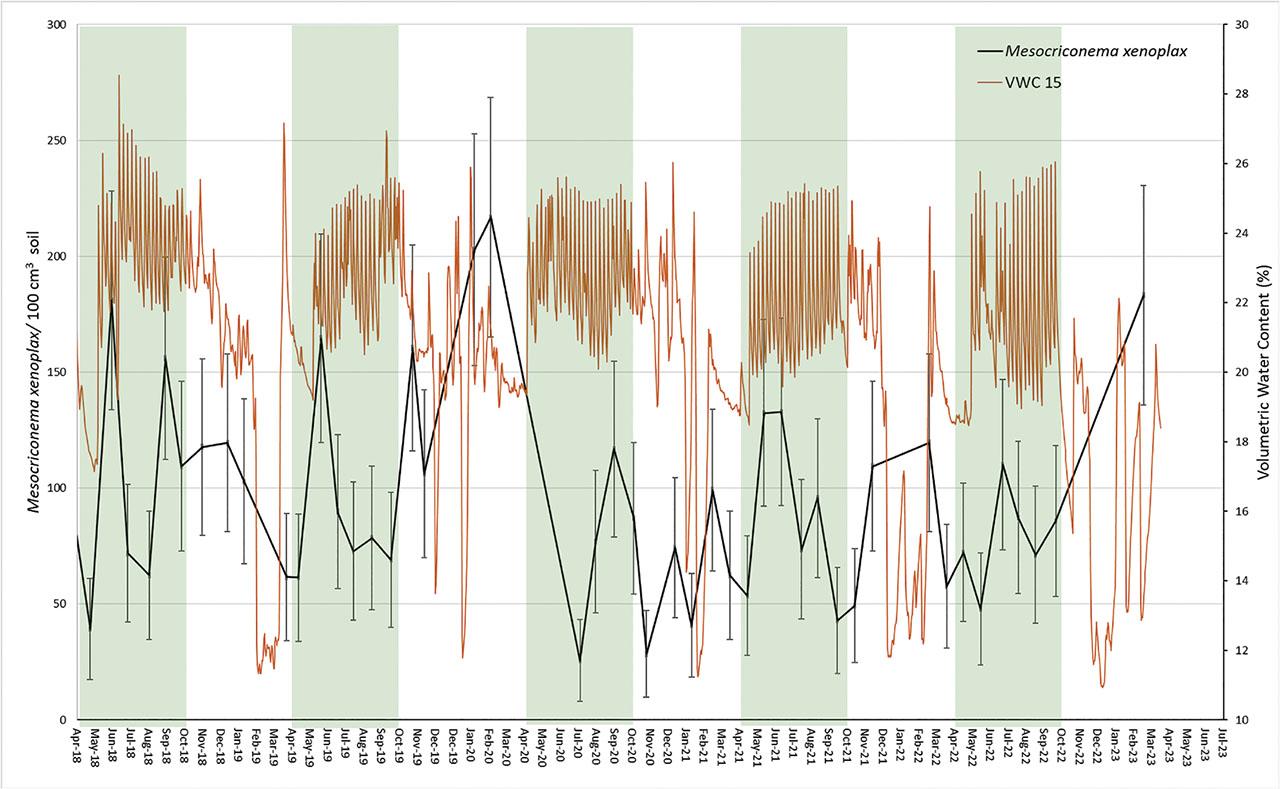
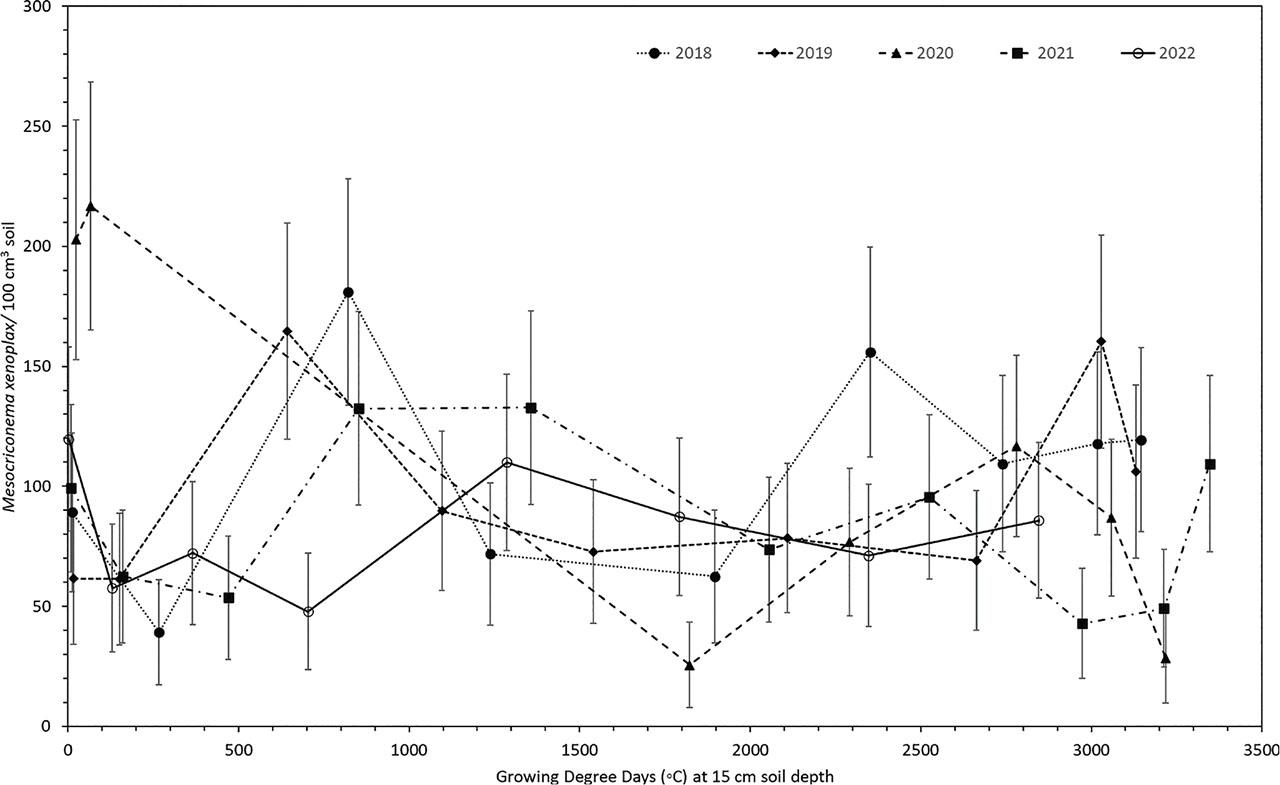
Have a personal or library account? Click to login
Population Dynamics of Mesocriconema xenoplax Parasitizing Sweet Cherry Trees in British Columbia, Canada Cover

Population Dynamics of Mesocriconema xenoplax Parasitizing Sweet Cherry Trees in British Columbia, Canada

By: Thomas Forge and  Paige Munro  
Open Access
|Nov 2024

Figures & Tables

Figure 1:

Temporal dynamics of Mesocriconema xenoplax population densities (Mesocriconema xenoplax/100 cm3 soil) in relation to soil temperature at 15-cm depth, through five consecutive population years under a 16- to 21-year-old cherry orchard. Shaded areas encompass the growing season, April to October. Data points are least-squared means and error bars are +/− standard errors from the overall repeated measures analysis of effect of sample date. The dotted line is a regression line for the entire data set (R2 = 0.0014).

Figure 2:

Temporal dynamics of Mesocriconema xenoplax population densities (Mesocriconema xenoplax/100 cm3 soil) in relation to volumetric soil moisture contents at 15-cm depth (VWC 15), through five consecutive population years under a 16- to 21-year-old cherry orchard. Shaded areas encompass the growing season, April to October. Data points are least-squared means and error bars are +/− standard errors from the overall repeated measures analysis of effect of sample date.

Figure 3:

Population densities of Mesocriconema xenoplax (Mesocriconema xenoplax/100 cm3 soil) in relation to accumulation of soil degree-days at 15-cm depth calculated using base 0°C, for each of five growing seasons in a 16- to 21-year-old sweet cherry orchard in British Columbia.

Maximum, minimum, and overall mean population densities of Mesocriconema xenoplax (M_ xenoplax/100 cm3 soil) for each of the five population years (April 1 through March 31, variable number of sample dates per year) in a sweet cherry orchard in Summerland, British Columbia_ Month names in parentheses are the month in which the maximum or minimum was recorded_ The two “Date p-values” for each year are p-values from repeated measures analyses of effect of sample date for the entire population year and for the growing season (April through October), respectively_

YearMaximumMinimumMeanDate p-value
2018–19 (n = 55)181 (June)39 (May)1010.08, 0.04
2019–20 (n = 50)217 (March)61 (April)1220.06, 0.09
2020–21 (n = 40)117 (September)26 (July)690.04, 0.15
2021–22 (n = 50)133 (July)43 (October)870.13, 0.13
2022–23 (n = 40)183 (March)48 (June)890.20, 0.18

Summary of soil temperatures at 15-cm depth and seasonal milestones for the five population years (April 1 through March 31) of the study_ Column headings “Date > 10°C” and “Date < 10°C” are the dates on which soil temperatures rose above 10°C or dropped below 10°C, respectively_ “Max_ (date)” and “Min_ (date)” refer to maximum and minimum temperatures recorded within each population year and the dates they were recorded_ “DD total” refers to the total number of degree-days accumulated through the year, calculated using base 0°C_

YearDate > 10°CMax. (date)Date < 10°CDD totalMin. (date)
2018–1921 April20 (11 Aug)3 Oct3172−2.9 (10 Feb)
2019–2018 April20 (10 Aug)8 Oct3234−0.4 (15 Jan)
2020–2118 April20 (1 Aug)13 Oct3305−3.0 (12 Feb)
2021–2216 April23 (1 July)8 Oct33790 (27 Dec)
2022–2329 April22 (28 July)18 Oct3190−2.9 (22 Dec)
DOI: https://doi.org/10.2478/jofnem-2024-0041 | Journal eISSN: 2640-396X | Journal ISSN: 0022-300X
Language: English
Submitted on: Feb 8, 2024
Published on: Nov 23, 2024
Published by: Society of Nematologists, Inc.
In partnership with: Paradigm Publishing Services
Publication frequency: 1 issue per year

© 2024 Thomas Forge, Paige Munro, published by Society of Nematologists, Inc.
This work is licensed under the Creative Commons Attribution 4.0 License.