
Figure 1.
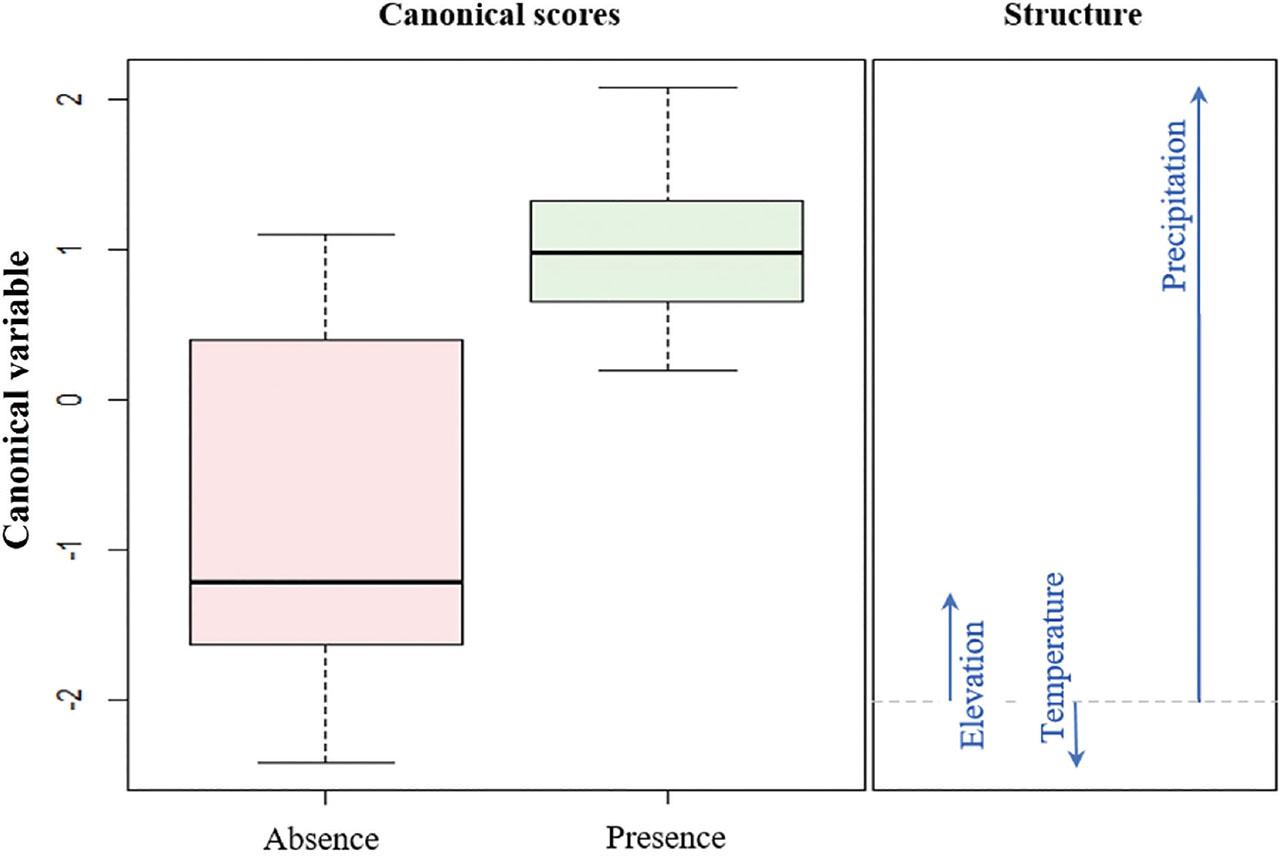
Figure 2.
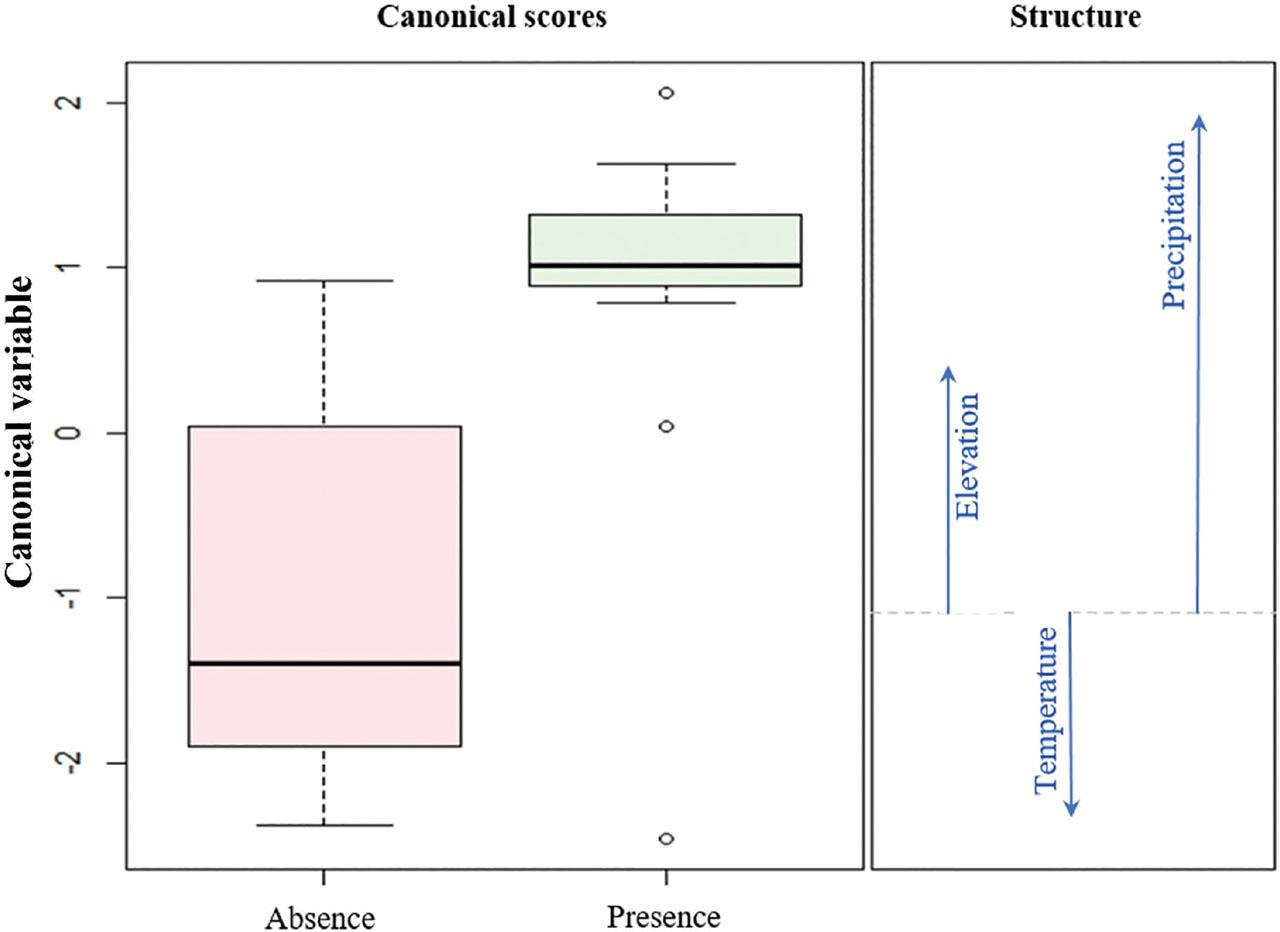
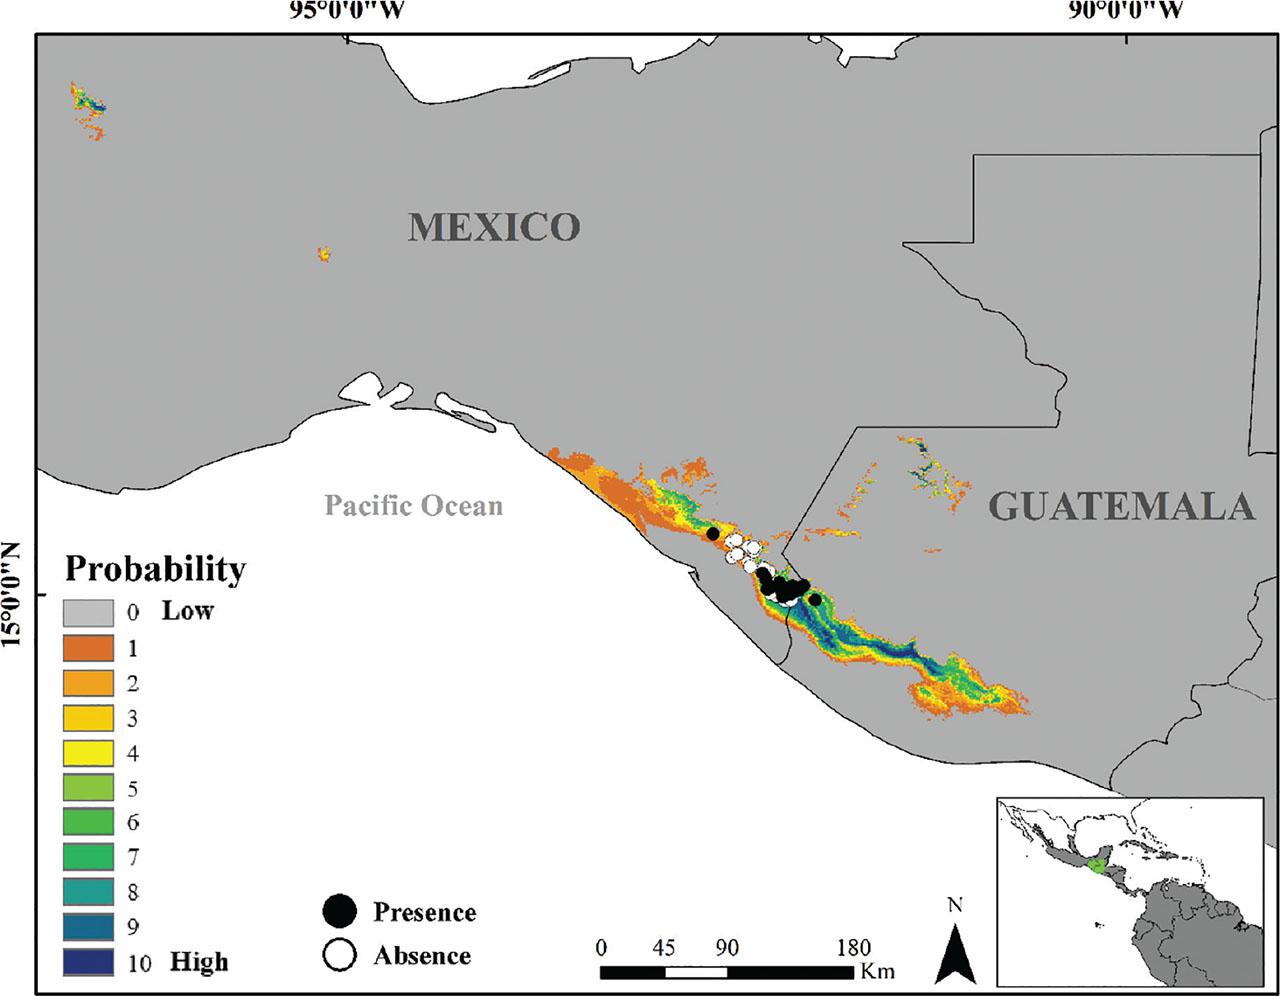
Figure 3.
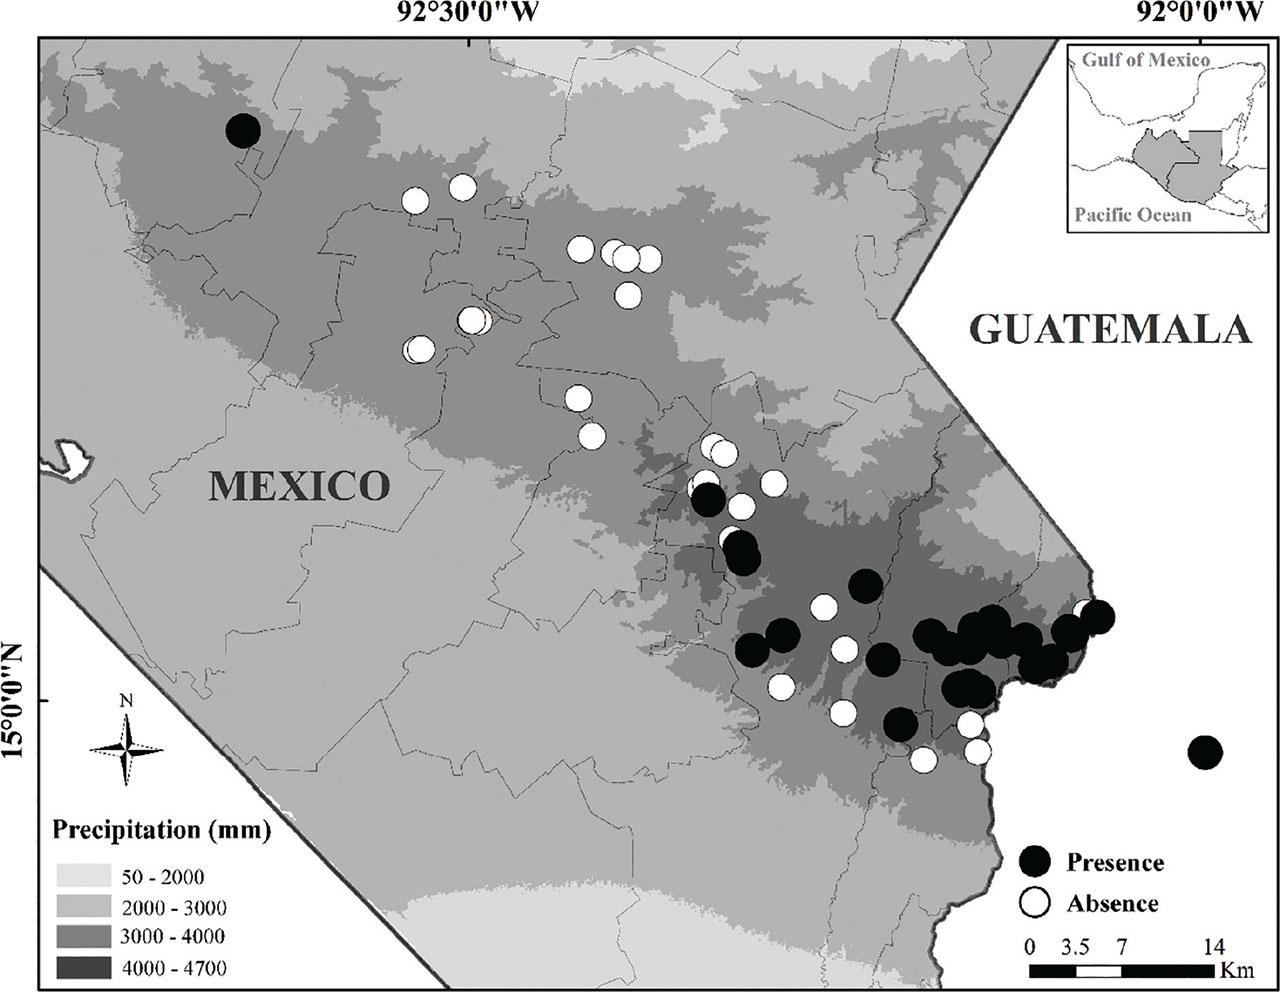
Figure 4.
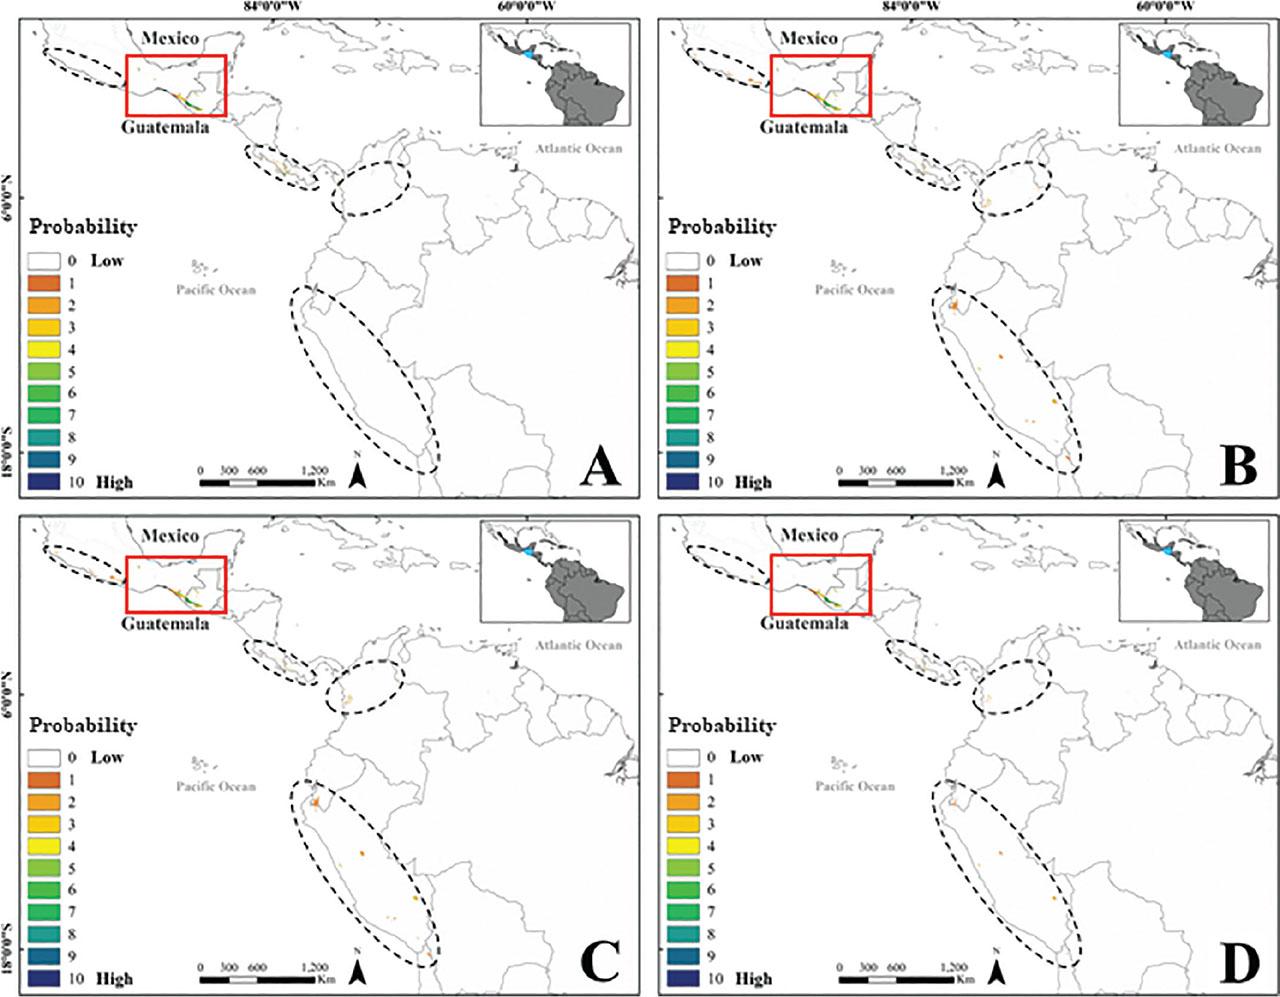
Figure 5.
Altitude, temperature, and precipitation for 2003 and 2019 in coffee plantations with Metaparasitylenchus hypothenemi absence_
| Year | Municipality | Locality | Altitude (m a.s.l.) | Temperature (°C) | Precipitacion (mm/year) |
|---|---|---|---|---|---|
| 2003 | Unión Juárez | Unión Juárez | 1295.00 | 21.51 | 4013.41 |
| Cacahoatán | Finca La Gloria | 569.00 | 24.64 | 4436.73 | |
| Tuxtla Chico | Ejido Manuel Lazos | 363.00 | 25.45 | 3834.87 | |
| San José La Victoria | 484.00 | 24.96 | 4286.24 | ||
| Tapachula | Finca Hamburgo | 1166.00 | 22.18 | 3729.59 | |
| Finca Irlanda | 1149.00 | 22.32 | 3694.39 | ||
| Finca Maravillas | 647.00 | 24.28 | 4290.40 | ||
| San Miguel | 409.00 | 25.45 | 3943.71 | ||
| Huixtla | Camino Real | 465.00 | 25.16 | 3631.59 | |
| Finca Córcega | 370.00 | 25.23 | 3628.14 | ||
| Villacomaltitlán | Ejido Zapote Mocho | 120.00 | 26.85 | 3329.28 | |
| Finca La Granja | 459.00 | 24.87 | 3638.88 | ||
| 2019 | Motozintla | Finca Santa Catalina | 795.00 | 23.52 | 3363.59 |
| Ranchería Varitas | 757.00 | 23.67 | 3376.80 | ||
| El Manguito | 748.00 | 23.87 | 3464.51 | ||
| Finca Brasil | 734.00 | 23.80 | 3441.29 | ||
| Los Cocos | 637.00 | 24.34 | 3642.55 | ||
| Tapachula | Ejido Mexiquito | 813.00 | 23.63 | 4072.84 | |
| Santa Anita | 766.00 | 23.76 | 4041.23 | ||
| Finca Maravillas | 760.00 | 23.83 | 4148.71 | ||
| Tiro Seguro | 713.00 | 24.08 | 4130.85 | ||
| San José Nexapa | 665.00 | 24.30 | 4429.00 | ||
| Ejido Toluca | 553.00 | 24.76 | 4372.55 | ||
| Malpaso | 326.00 | 25.85 | 3554.65 | ||
| Tuxtla Chico | Finca El Encanto | 461 | 25.14 | 4176.88 | |
| Escuintla | Ejido Tres de mayo | 529.00 | 25.06 | 3377.83 | |
| Jamaica | 331.00 | 25.99 | 3441.58 | ||
| Tuzantán | El Retiro | 480.00 | 25.22 | 3818.76 | |
| Río Negro | 208.00 | 26.65 | 3339.10 | ||
| Villacomaltitlán | Manuel Ávila Camacho | 109.00 | 27.05 | 3249.11 | |
Altitude, temperature, and precipitation for 2003 and 2019 in coffee plantations with Metaparasitylenchus hypothenemi presence (various localities in Mexico and San Pablo, Guatemala)_
| Year | Municipality | Locality | Altitude (m a.s.l.) | Temperature (°C) | Precipitation (mm/year) |
|---|---|---|---|---|---|
| 2003 | Unión Juárez | Finca Monte Perla | 1020 | 22.87 | 4311.96 |
| Ejido Once de Abril | 852 | 23.50 | 4544.00 | ||
| Cacahoatán | Ejido Santo Domingo | 810 | 23.79 | 4640.05 | |
| Finca La Alianza | 671 | 24.24 | 4503.66 | ||
| Finca El Zapote | 676 | 24.21 | 4525.80 | ||
| Rancho El Paraíso | 564 | 24.65 | 4433.28 | ||
| Tapachula | Finca San Enrique | 754 | 23.99 | 4139.28 | |
| Ejido Cinco de Mayo | 554 | 24.85 | 4315.99 | ||
| Ejido El Edén | 544 | 25.57 | 3875.75 | ||
| Rancho La Esperanza | 507 | 25.14 | 4134.87 | ||
| Tuxtla Chico | Finca El Encanto | 461 | 25.03 | 4242.72 | |
| 2019 | Unión Juárez | Río Suchiate | 1014 | 22.00 | 3295.00 |
| Finca Monte Perla | 938 | 23.18 | 4443.20 | ||
| Santo Domingo | 883 | 23.47 | 4636.51 | ||
| Ejido Once de Abril | 850 | 23.56 | 4562.55 | ||
| San Rafael | 819 | 23.63 | 4629.64 | ||
| Ejido San Jerónimo | 747 | 23.94 | 4573.30 | ||
| Cacahoatán | Dos de Mayo | 839 | 23.64 | 4566.13 | |
| Faja de Oro | 836 | 23.60 | 4559.70 | ||
| Finca El Zapote | 720 | 24.09 | 4547.48 | ||
| Finca La Alianza | 703 | 23.92 | 4563.86 | ||
| Rosario Ixtal | 600 | 24.59 | 4455.24 | ||
| Rancho San Antonio | 577 | 24.61 | 4447.98 | ||
| La Unidad | 568 | 24.63 | 4443.94 | ||
| Tapachula | Finca Santa Lucía | 672 | 24.26 | 4426.17 | |
| Salvador Urbina | 598 | 24.59 | 4439.59 | ||
| Finca Brasil | 463 | 25.31 | 4045.24 | ||
| Acacoyagua | Ejido Los Cacaos | 450 | 25.25 | 3211.97 | |
| San Pablo | Finca Buena Vista | 670 | 24.00 | 3689.00 | |
Breadth and evaluation of the SDMs_ All models were characterized by a high predictive accuracy in the partial ROC test (AUC = 0_99)_ The breadth of the geographical distribution of Metaparasitylenchus hypothenemi was similar (4692 km2), although all models predict a limited geographical distribution (0_02%) for the Neotropical region (23943229 km2)_
| SDM | Accessible area | SDM breadth | Proportion | Partial ROC test | ||
|---|---|---|---|---|---|---|
| (1px = 1km2) | (1px = 1km2) | (%) | AUC of 0.95 | AUC of 0.5 | Ratio | |
| Model A | 23,943,229 | 4,977 | 0.021 | 0.99976 | 0.49999 | 1.99951 |
| Model B | 4,811 | 0.020 | 0.99979 | 0.49999 | 1.99959 | |
| Model C | 4,834 | 0.020 | 0.99980 | 0.49999 | 1.99959 | |
| Final model (D) | 4,692 | 0.020 | - | - | - | |