
Figure S1.
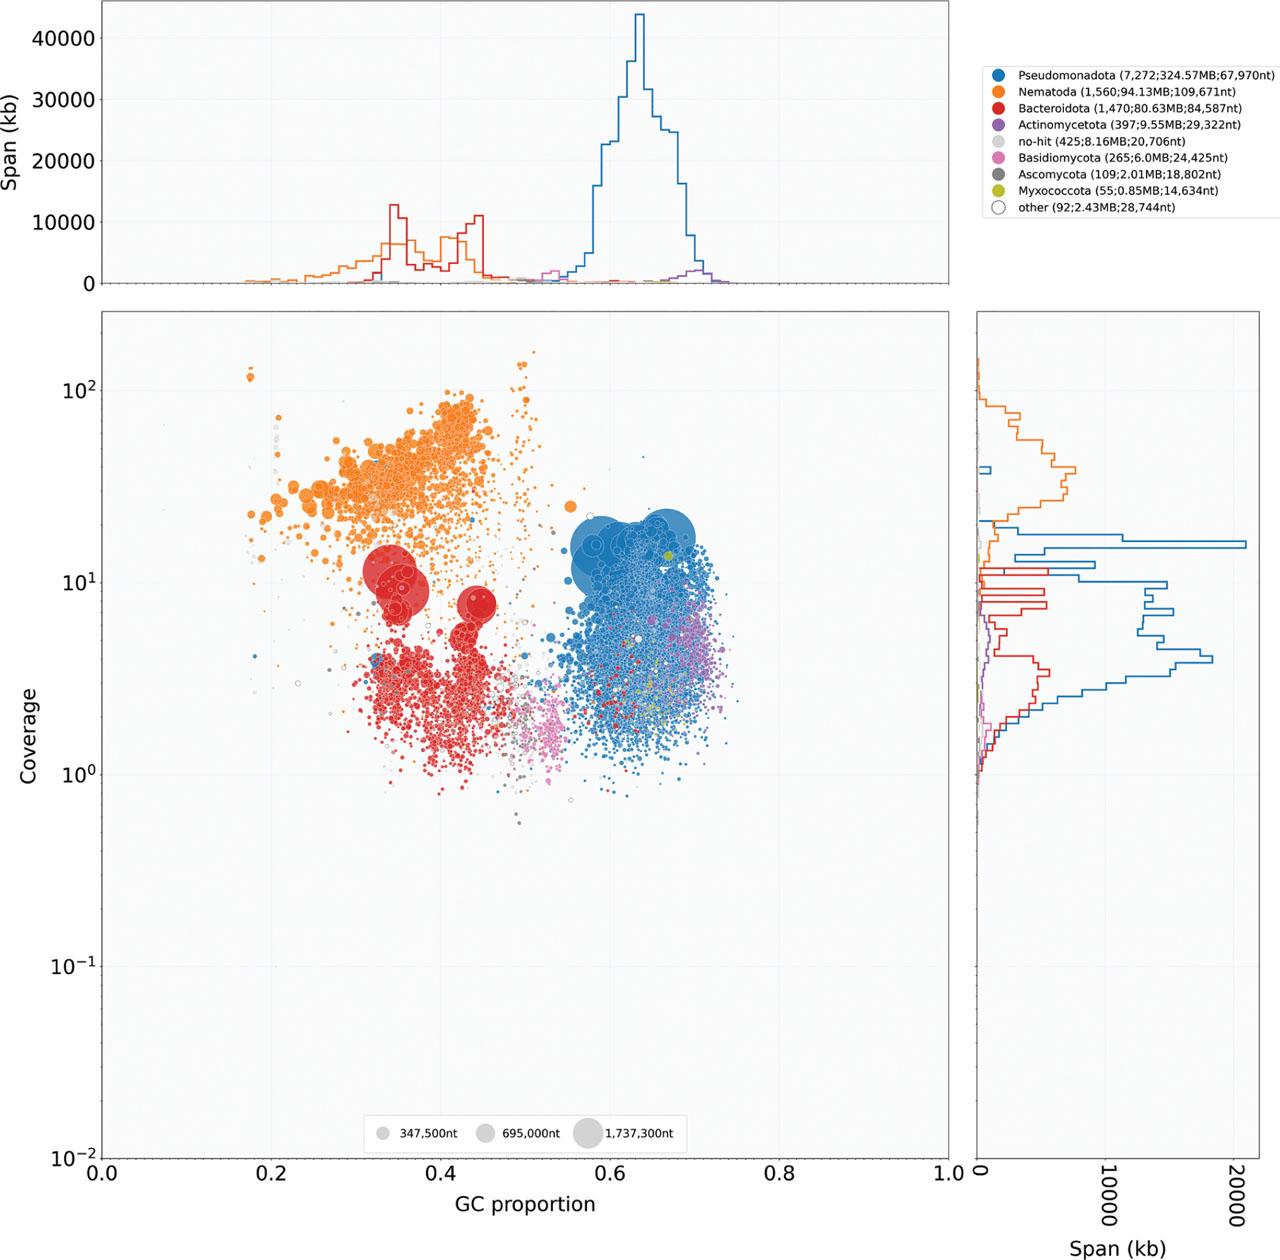
Figure S2.
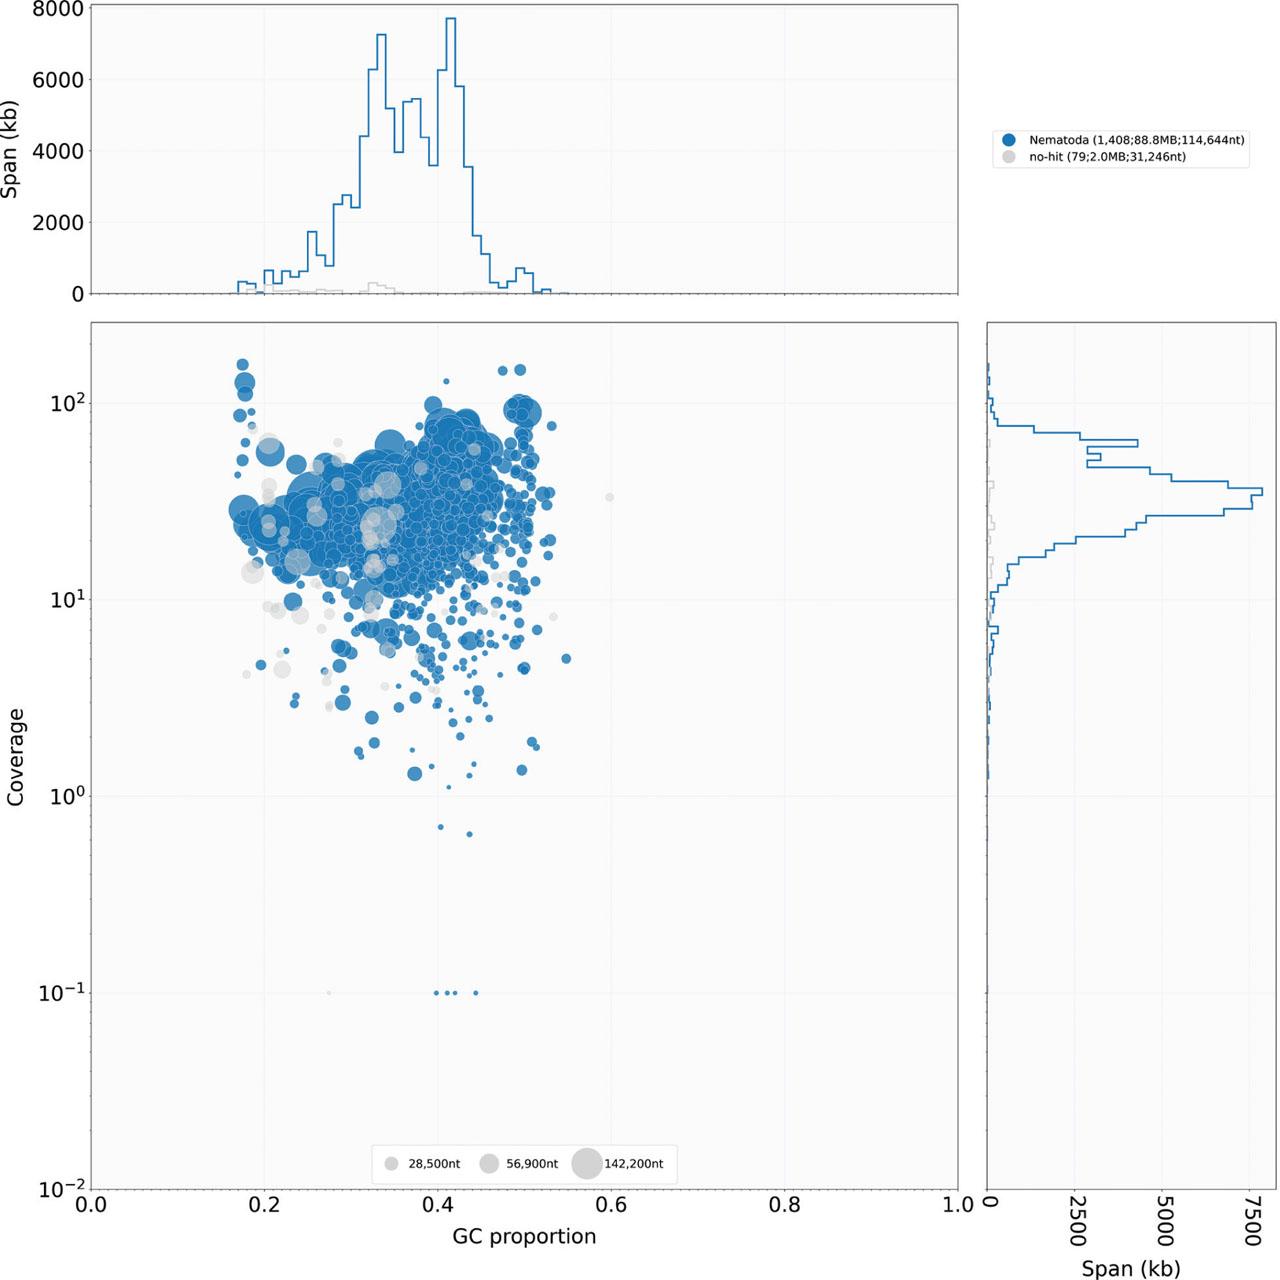
Figure S3.
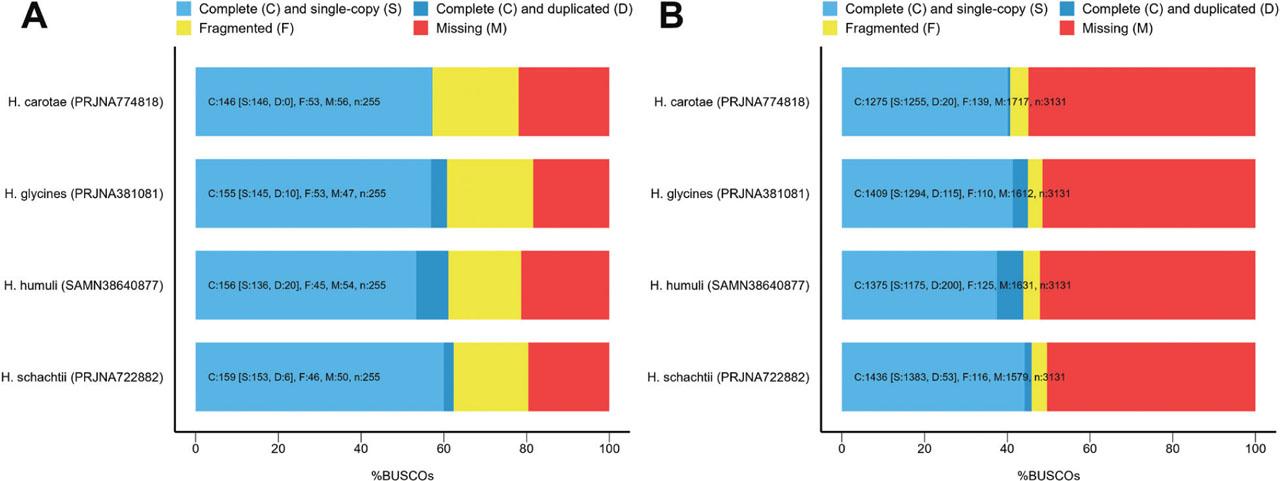
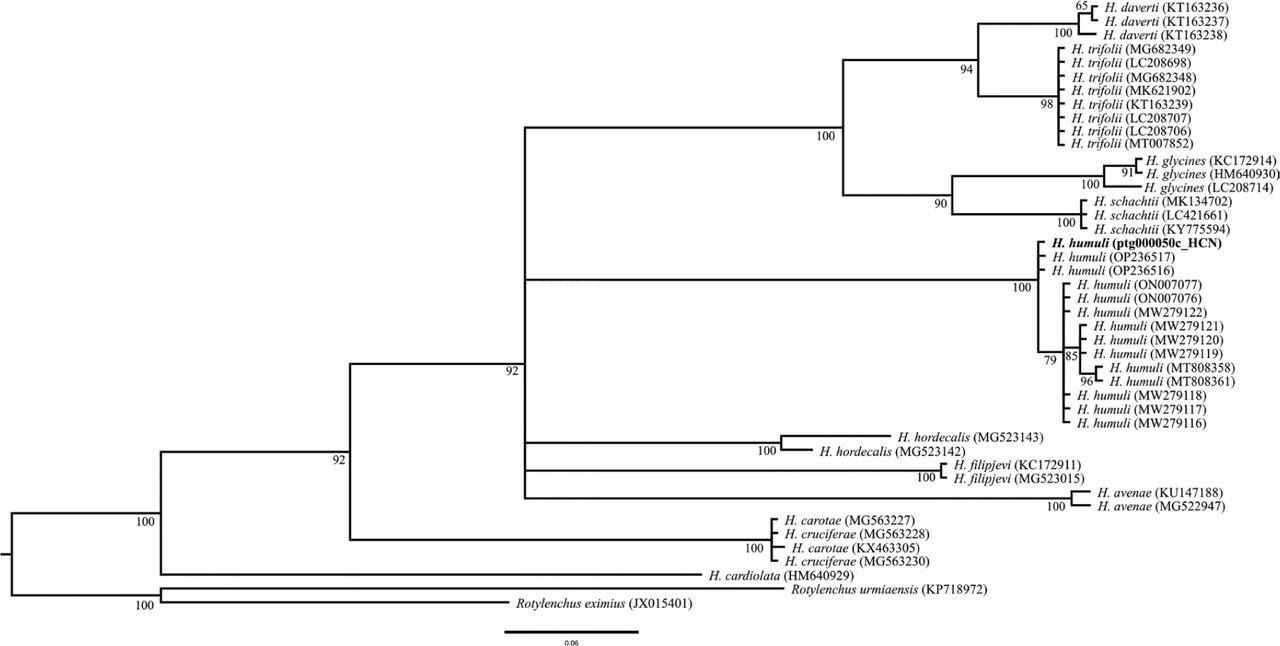
Figure S4.
Comparison of genome assembly statistics of Heterodera humuli and three other Heterodera species_
| Type of analysis | Parameter | H. carotae (PRJNA774818)x | H. glycines (PRJNA381081)x | H. humuli (PRJNA1048471)x | H. schachtii (PRJNA767548)x |
|---|---|---|---|---|---|
| Genome statistics | Total Number of bp | 95,115,141 | 157,978,452 | 90,806,450 | 190,153,211 |
| Number of Contigs | 17,835 | 9 | 1,487 | 705 | |
| Largest contig | 113,425 | 23,985,585 | 568,746 | 4,323,191 | |
| Contigs ≥ 25000 | 699 | 9 | 871 | 609 | |
| Contigs ≥ 50000 | 103 | 9 | 559 | 531 | |
| Average GC% | 39.39 | 36.66 | 36.11 | 32.36 | |
| Contig N50 | 13,935 | 17,907,690 | 111,383 | 500,954 | |
| Contig L50 | 1,836 | 4 | 231 | 86 | |
| Number of N’s per 100 kbp | 0 | 1,062.01 | 0 | 2,253.83 | |
| Predicted number coding genes | 17,037 | 22,465 | 15,428 | 29,851 | |
| Predicted number of transcripts | 17,322 | 29,933 | 16,848 | 31,564 | |
| Predicted Protein BUSCO Analysis (Nematoda_ob10 – 3,131 genes) | Complete BUSCOs (C) (%) | 1,301 (41.5%) | 1,884 (60.2%) | 2,030 (64.9%) | 2,080 (66.4%) |
| Complete BUSCOs and single-copy BUSCOs (S) (%) | 1,237 (39.5%) | 1,612 (51.5%) | 1,590 (50.8%) | 1,675 (53.5%) | |
| Complete and duplicated BUSCOs (D) (%) | 64 (2%) | 272 (8.7%) | 440 (14.1%) | 405 (12.9%) | |
| Fragmented BUSCOs (F) (%) | 124 (4%) | 47 (1.5%) | 66 (2.1%) | 69 (2.2%) | |
| Missing BUSCOs (M) (%) | 1,706 (54.5%) | 1,200 (38.3%) | 1,035 (33%) | 982 (31.4%) | |
| Predicted Protein BUSCO Analysis (Eukaryota_ odb10 - 255 genes) | C (%) | 160 (62.8%) | 199 (78%) | 221 (86.6%) | 224 (87.8%) |
| S (%) | 156 (61.2%) | 176 (69%) | 174 (68.2%) | 200 (78.4%) | |
| D (%) | 4 (1.6%) | 23 (9%) | 47 (18.4%) | 24 (9.4%) | |
| F (%) | 52 (20.4%) | 20 (7.8%) | 13 (5.1%) | 15 (5.9%) | |
| M (%) | 43 (16.8%) | 36 (14.2%) | 21 (8.3%) | 16 (6.3%) | |