
Figure 1:
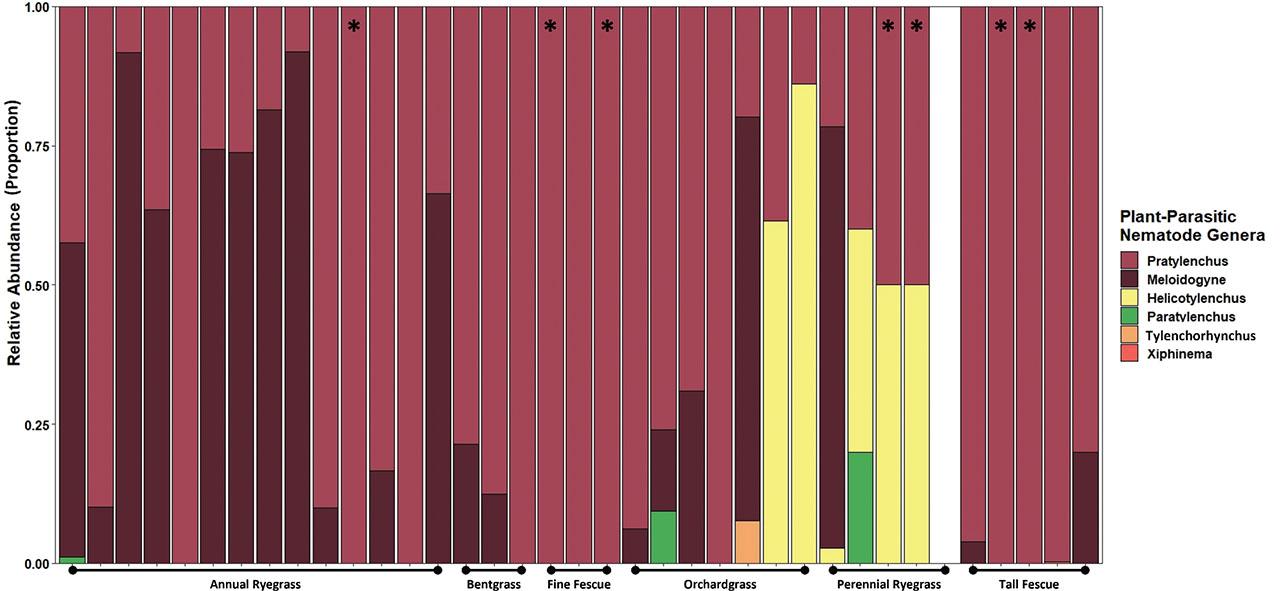
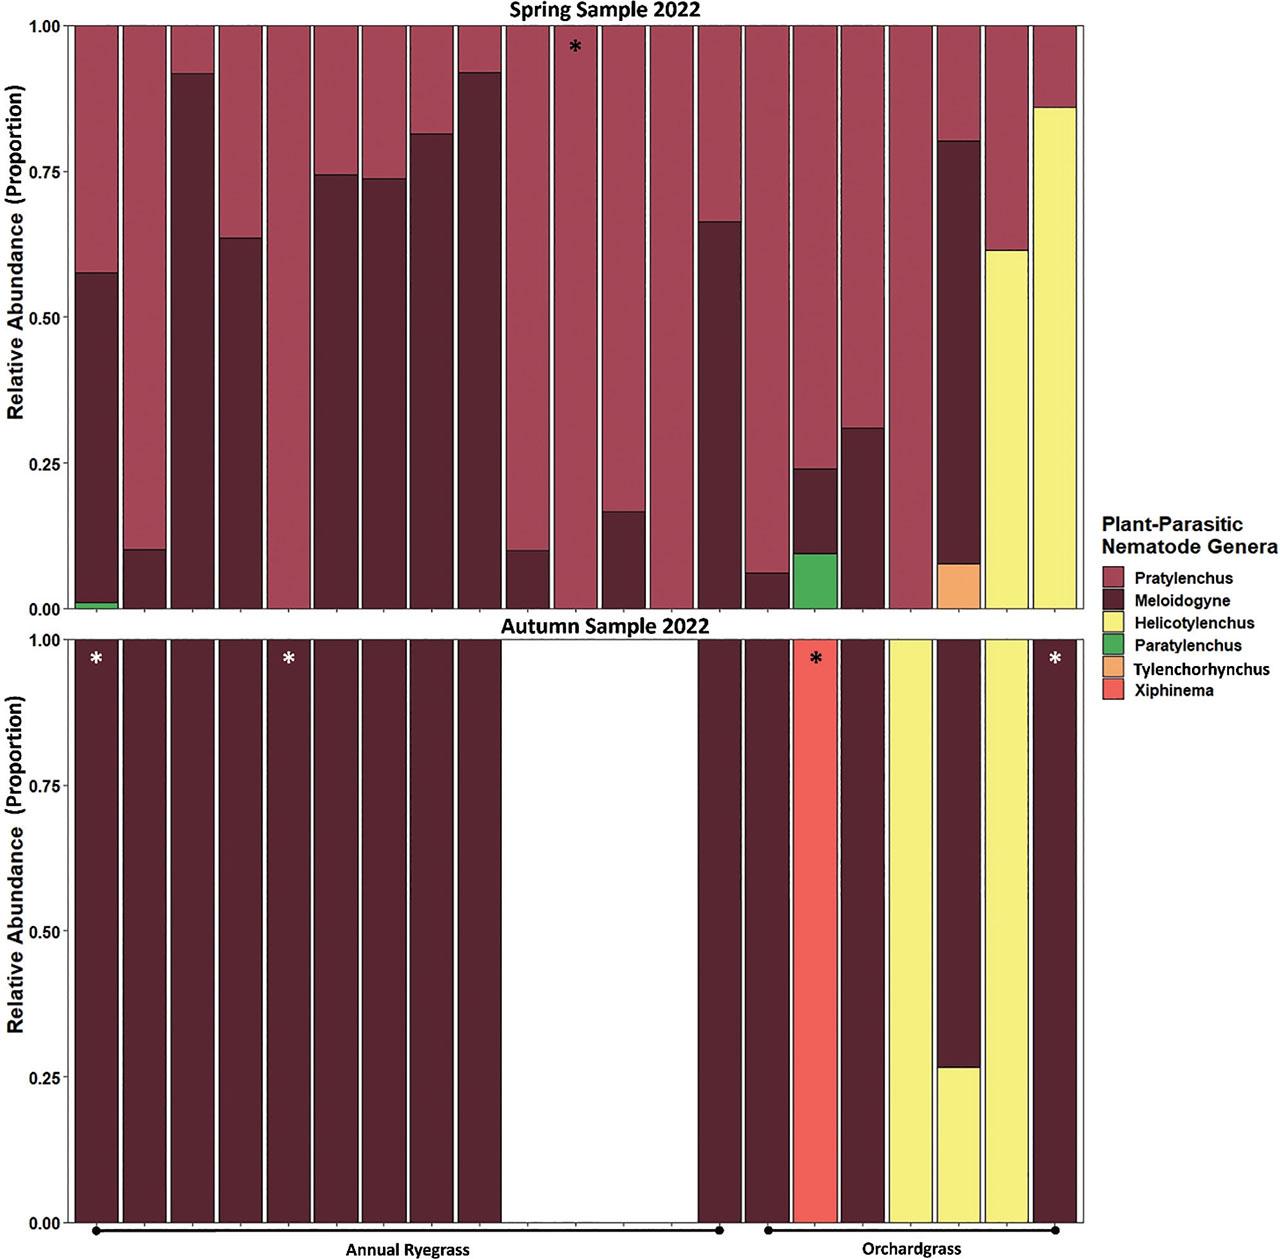
Figure 2:
Average plant-parasitic nematode species densities and diversity measures for all grass species sampled in 2022 and 2023_
| Grass species | Nb | Sample time | Average Density (#/100 g soil) | Diversity Measuresa | |||||||
|---|---|---|---|---|---|---|---|---|---|---|---|
| Pratylenchus | Meloidogyne | Helicotylenchus | Paratylenchus | Tylenchorhynchus | Xiphinema | Alpha | Beta | Gamma | |||
| Annual ryegrass | 14 | Spring 2022 | 90 | 206 | 0 | 1 | 0 | 0 | 1.9 | 0.6 | 3 |
| Autumn 2022 | 0 | 34 | 0 | 0 | 0 | 0 | 0.7 | 0.4 | 1 | ||
| Bentgrass | 3 | Spring 2023 | 169 | 38 | 0 | 0 | 0 | 0 | 1.7 | 0.2 | 2 |
| Fine fescue | 3 | Spring 2023 | 3 | 0 | 0 | 0 | 0 | 0 | 1.0 | 0.0 | 1 |
| Orchardgrass | 7 | Spring 2022 | 227 | 58 | 22 | 14 | 1 | 0 | 2.1 | 1.4 | 5 |
| Autumn 2022 | 0 | 20 | 7 | 0 | 0 | 1 | 1.1 | 1.7 | 3 | ||
| Perennial ryegrass | 5 | Spring 2023 | 3 | 6 | 1 | 1 | 0 | 0 | 2.0 | 1.0 | 4 |
| Tall fescue | 5 | Spring 2023 | 166 | 4 | 0 | 0 | 0 | 1 | 1.6 | 0.9 | 3 |
Percentage frequency of occurrence (%FO), mean population densities when present (# nematodes/100 g soil), and maximum population densities (# nematodes/100 g soil) of plant-parasitic nematodes associated with grass for seed crops in Oregon sampled in Spring 2022 or 2023_
| Pratylenchus | Meloidogyne | Helicotylenchus | Paratylenchus | Tylenchorhynchus | Xiphinema | |
|---|---|---|---|---|---|---|
| %FOa | 97 | 54 | 16 | 8 | 3 | 3 |
| Meanb | 117 (30.2) | 172 (61.7) | 26 (18.2) | 32 (26.4) | 7 | 1 |
| Maxc | 1,984 | 2,496 | 288 | 556 | 24 | 2 |
Pratylenchus spp_ identified on grass for seed crops in Oregon_a
| Grass type | P. crenatus | P. fallax | P. neglectus | P. penetrans | P. thornei |
|---|---|---|---|---|---|
| Annual ryegrass | + (11)b | + (2) | + (9) | + (5) | −c |
| Perennial ryegrass | ndd | nd | nd | nd | nd |
| Bentgrass | + (3) | − | − | − | − |
| Tall fescue | + (1) | − | − | − | − |
| Fine fescue | nd | nd | nd | nd | nd |
| Orchardgrass | + (1) | − | + (6) | + (2) | + (2) |