
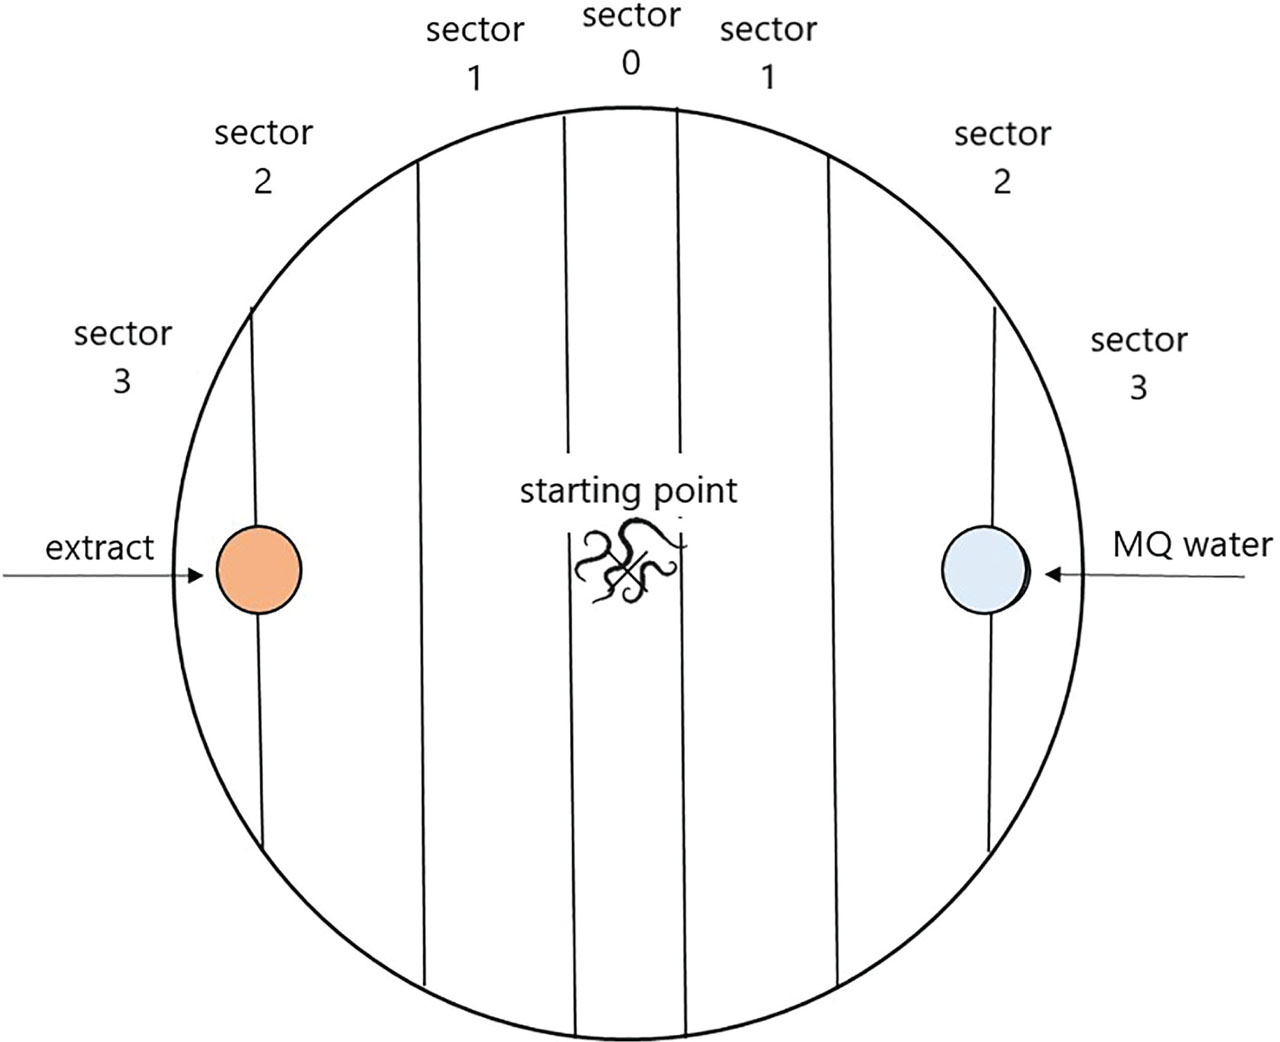
Figure 1:
Representation of the sectors identified during the reading of the area choice test.
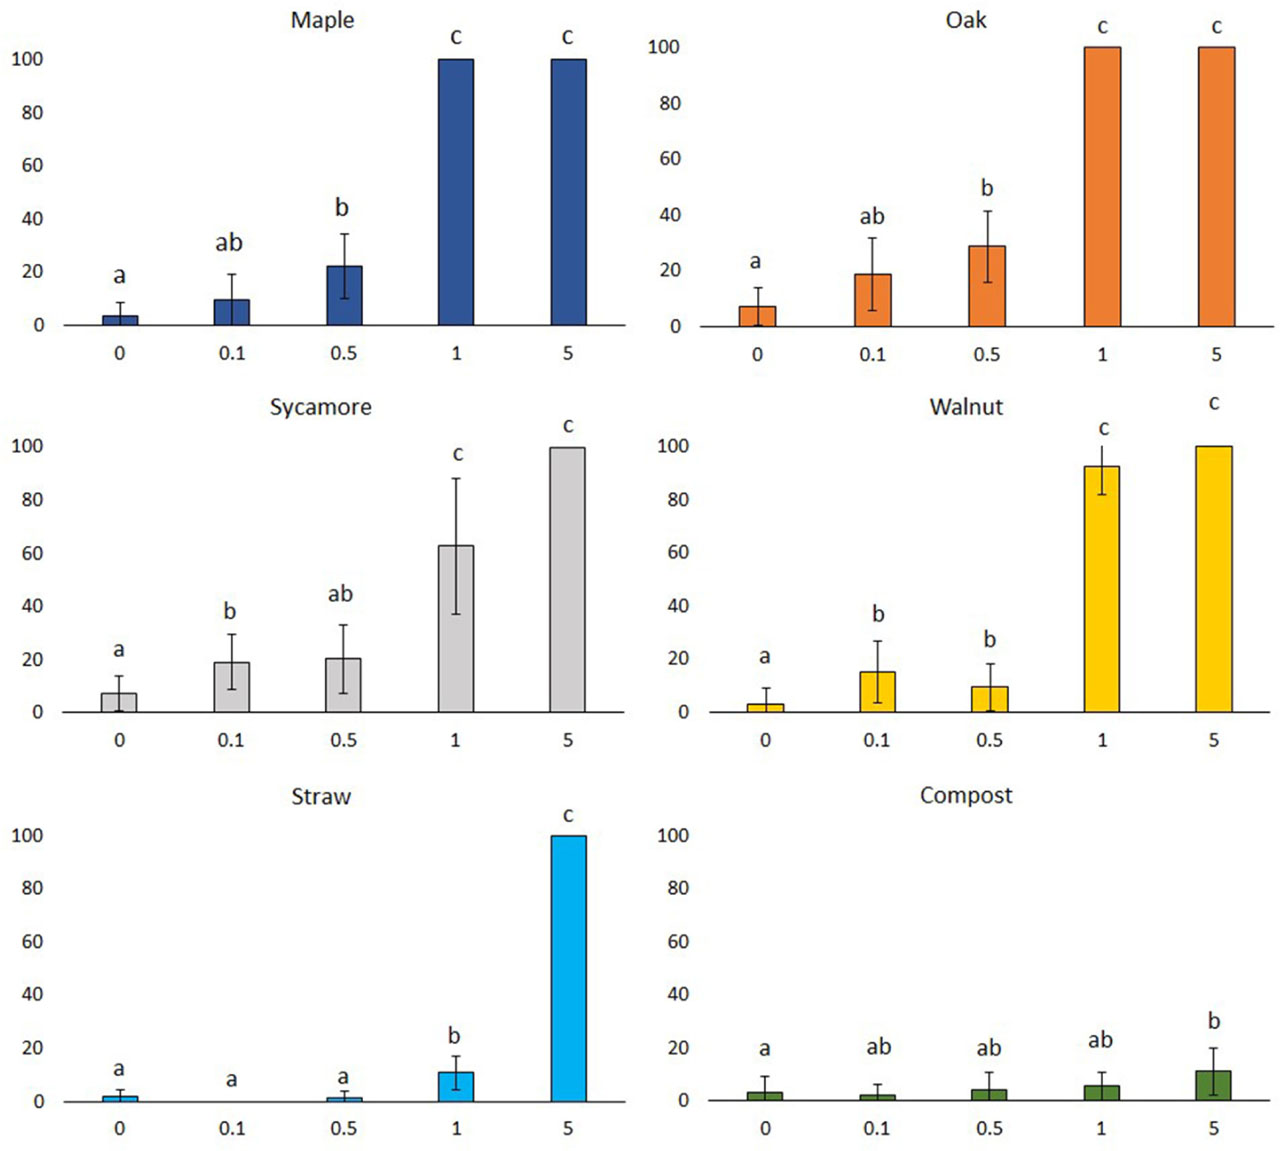
Figure 2:
Mortality rates (mean ± CI 95%) of Meloidogyne incognita juveniles of different concen-trations (0.1, 0.5, 1 and 5%) of various leaf litter, straw and compost extracts. (CI 95%: 95% of confidence interval) (One-way ANOVA, Tukey's pairwise comparisons (in the case of compost), Mann–Whitney U test; different letters in the same row indicate significant difference at p ≤ 0.05 level).
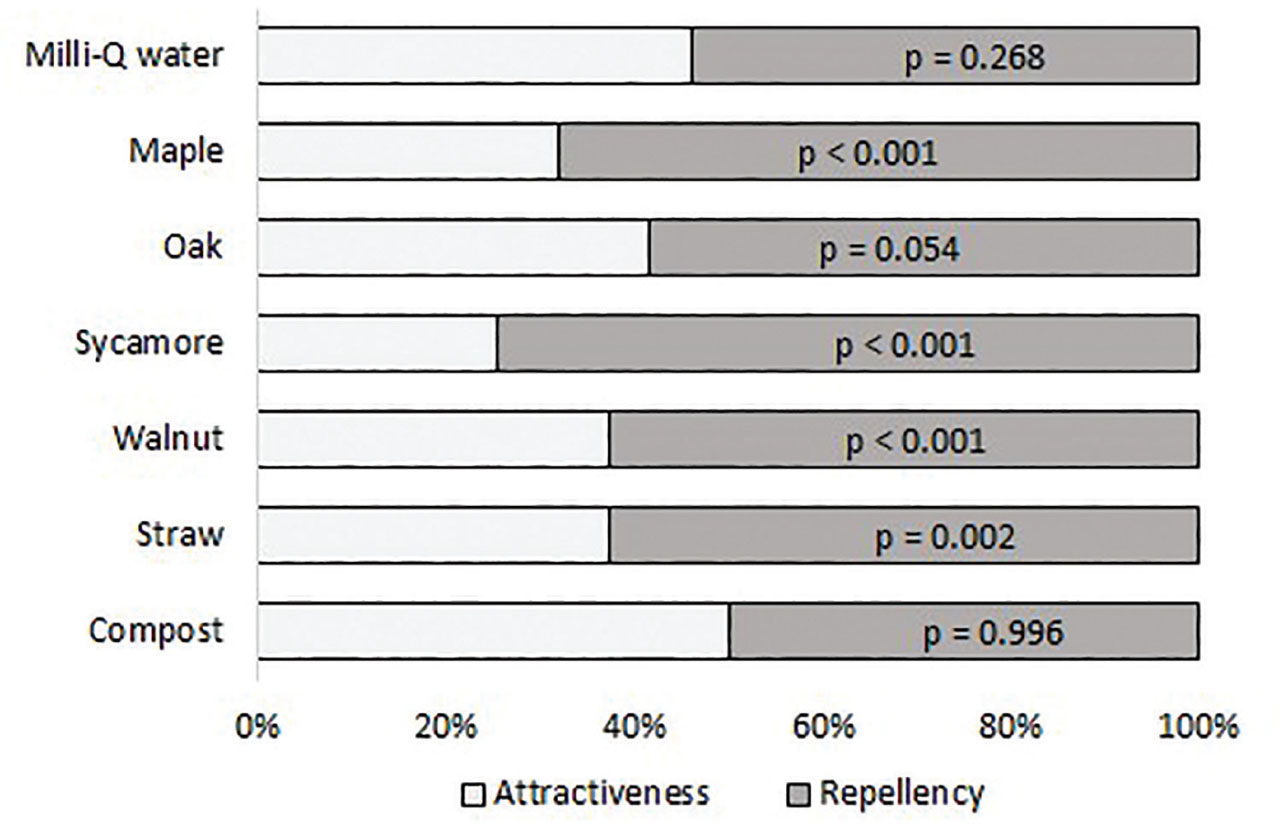
Figure 3:
Area choice of Meloidogyne incognita juveniles with various leaf litter, straw and compost extracts (treated) and MQ-water (control). (Welch-test, p ≤ 0.05, p-value means that the number of M. incognita juveniles counted on the treated side is significantly different from that on the control side).
Table 1.
Tannic acid content of different concentrations of various leaf litter, straw, and compost extracts.
| Tannic acid content (%) | |||||
|---|---|---|---|---|---|
| Concentrations (%) | 0 | 0.1 | 0.5 | 1 | 5 |
| Extracts | |||||
| Maple leaf litter | n.d. | 0.00521 | 0.02605 | 0.0521 | 0.2605 |
| Oak leaf litter | n.d. | 0.00241 | 0.01205 | 0.0241 | 0.1205 |
| Sycamore leaf litter | n.d. | 0.00209 | 0.01045 | 0.0209 | 0.1045 |
| Walnut leaf litter | n.d. | 0.0008 | 0.004 | 0.008 | 0.04 |
| Straw | n.d. | 0.00002 | 0.0001 | 0.0002 | 0.001 |
| Compost | n.d. | n.d. | n.d. | n.d. | n.d. |
[i] (n.d.: non detectable)
Table 2.
Values (mean ± CI 95%) of pH of different concentrations of various leaf litter, straw, and compost extracts. (CI 95%: 95% of confidence interval).
| pH value | |||||
|---|---|---|---|---|---|
| Concentrations (%) | 0 | 0.1 | 0.5 | 1 | 5 |
| Extracts | |||||
| Maple leaf litter | 7.02 ± 0.04 | 5.33 ± 0.01 | 4.81 ± 0.02 | 4.78 ± 0.03 | 4.43 ± 0.03 |
| Oak leaf litter | 7.02 ± 0.04 | 5.95 ± 0.01 | 5.42 ± 0.02 | 5.23 ± 0.03 | 4.99 ± 0.03 |
| Sycamore leaf litter | 7.02 ± 0.04 | 6.42 ± 0.01 | 6.09 ± 0.03 | 5.36 ± 0.03 | 5.12 ± 0.02 |
| Walnut leaf litter | 7.02 ± 0.04 | 6.30 ± 0.01 | 6.63 ± 0.03 | 6.68 ± 0.03 | 6.21 ± 0.04 |
| Straw | 7.02 ± 0.04 | 6.37 ± 0.02 | 6.41 ± 0.04 | 6.44 ± 0.01 | 6.46 ± 0.03 |
| Compost | 7.02 ± 0.04 | 6.90 ± 0.01 | 7.29 ± 0.03 | 7.57 ± 0.03 | 7.79 ± 0.06 |
Table 3.
Correlation between the concentration, the tannic acid content, the pH of mulch-derived extracts and the percentage mortality of the juveniles of Meloidogyne incognita.
| Extracts | Concentration/Mortality | Tannic acid/Mortality | pH/Mortality |
|---|---|---|---|
| Maple leaf litter | 0.732 | 0.732 | 0.785 |
| Oak leaf litter | 0.710 | 0.710 | 0.854 |
| Sycamore leaf litter | 0.919 | 0.919 | 0.766 |
| Walnut leaf litter | 0.718 | 0.718 | 0.495 |
| Straw | 0.982 | 0.982 | 0.267 |
| Compost | 0.522 | 0.108 | 0.495 |