
Table 1.
Trial one Globodera pallida progeny cysts, remaining encysted eggs recovered from cyst bags, viability of remaining encysted eggs, viable remaining encysted eggs, and determined host status for G. pallida. Data presented are means of six replicates. Significant differences are denoted by different letters in the columns based on least squares means at α = 0.05.
| Species | Progeny Cysts/Pot | Remaining Encysted Eggs/Cyst | Viability of Remaining Eggs/Cyst | Viable Remaining Encysted Eggs/Cyst | Host Status for Globodera pallida |
|---|---|---|---|---|---|
| Solanum aethiopicum | 0 c | 160.4 a | 65.2% abc | 81.9 a | Nonhost |
| Solanum douglasii | 0 c | 135.8 a | 62.4% abc | 58.8 b | Nonhost |
| Solanum macrocarpon | 0 c | 147.8 a | 52.6% bc | 46.7 bc | Nonhost |
| Solanum quitoense | 0 c | 96.9 b | 48.0% c | 32.8 c | Nonhost |
| Solanum retroflexum | 0 c | 91.2 b | 61.5% abc | 44.9 bc | Nonhost |
| Bare Soil | 0 c | 158.4 a | 73.7% a | 89.1 a | Nonhost |
| Solanum tuberosum ‘Desiree’ | 369.7 a | 77.9 bc | 66.1% ab | 43.9 bc | Host |
| Solanum tuberosum ‘Russet Burbank’ | 265.5 a | 70.9 c | 61.3% abc | 33.8 c | Host |
Table 2.
Trial two Globodera pallida progeny cysts, remaining encysted eggs recovered from cyst bags, viability of remaining encysted eggs, viable remaining encysted eggs, and determined host status for G. pallida. Data presented are means of six replicates. Significant differences are denoted by different letters in the columns based on least squares means at α = 0.05.
| Species | Progeny Cysts | Remaining Encysted Eggs/Cyst | Viability of Remaining Eggs | Viable Remaining Encysted Eggs | Host Status for Globodera pallida |
|---|---|---|---|---|---|
| Solanum aethiopicum | 0 b | 147.5 a | 61.2% | 62.8 b | Nonhost |
| Solanum douglasii | 0 b | 133.7 ab | 70.0% | 51.2 bcd | Nonhost |
| Solanum macrocarpon | 0 b | 133.2 ab | 55.3% | 57.1 bc | Nonhost |
| Solanum quitoense | 0 b | 108.9 b | 59.9% | 63.7 b | Nonhost |
| Solanum retroflexum | 0 b | 77.7 c | 65.5% | 43.5 d | Nonhost |
| Bare Soil | 0 b | 148.4 a | 65.7% | 93.7 a | Nonhost |
| Solanum tuberosum ‘Desiree’ | 57.2 a | 81.1 c | 63.7% | 44.4 cd | Host |
| Solanum tuberosum ‘Russet Burbank’ | 64.8 a | 80.3 c | 64.9% | 43.5 d | Host |
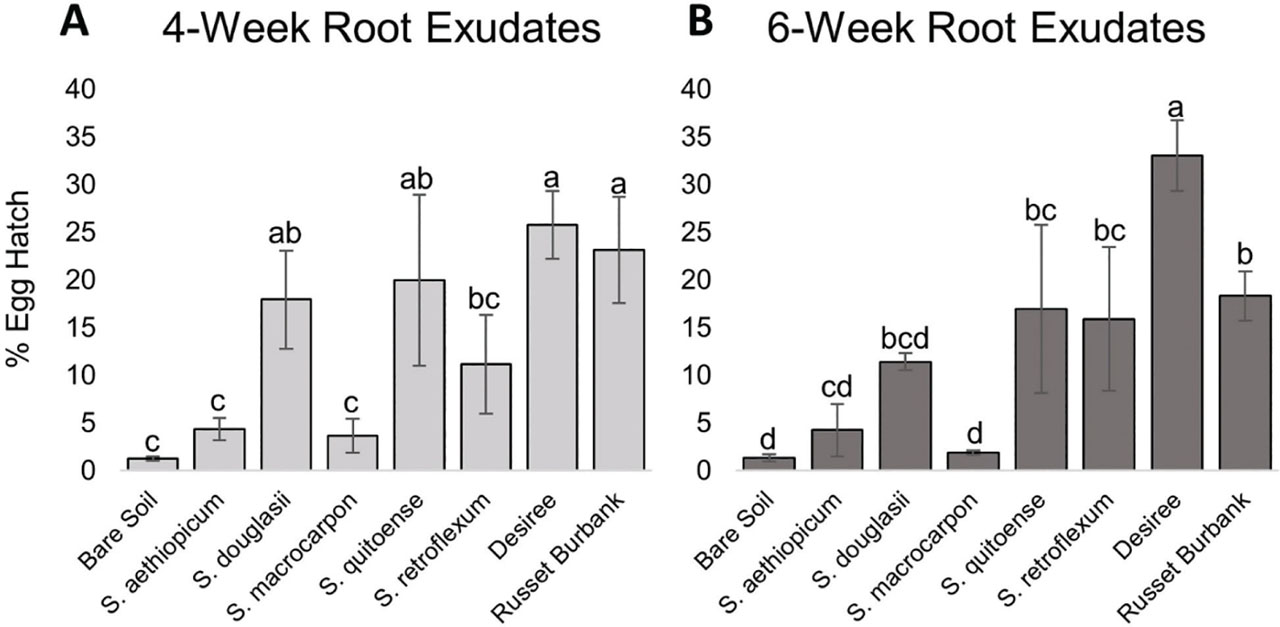
Figure 1:
Trial one mean percentage egg hatch two weeks after root exudate application.
A) Percentage egg hatch for root exudates collected at four weeks of growth. B) Percentage egg hatch for root exudates collected at six weeks of growth. Standard error of the means is indicated by the bars. Different letters indicate significantly different means based on least squares means at α = 0.05.
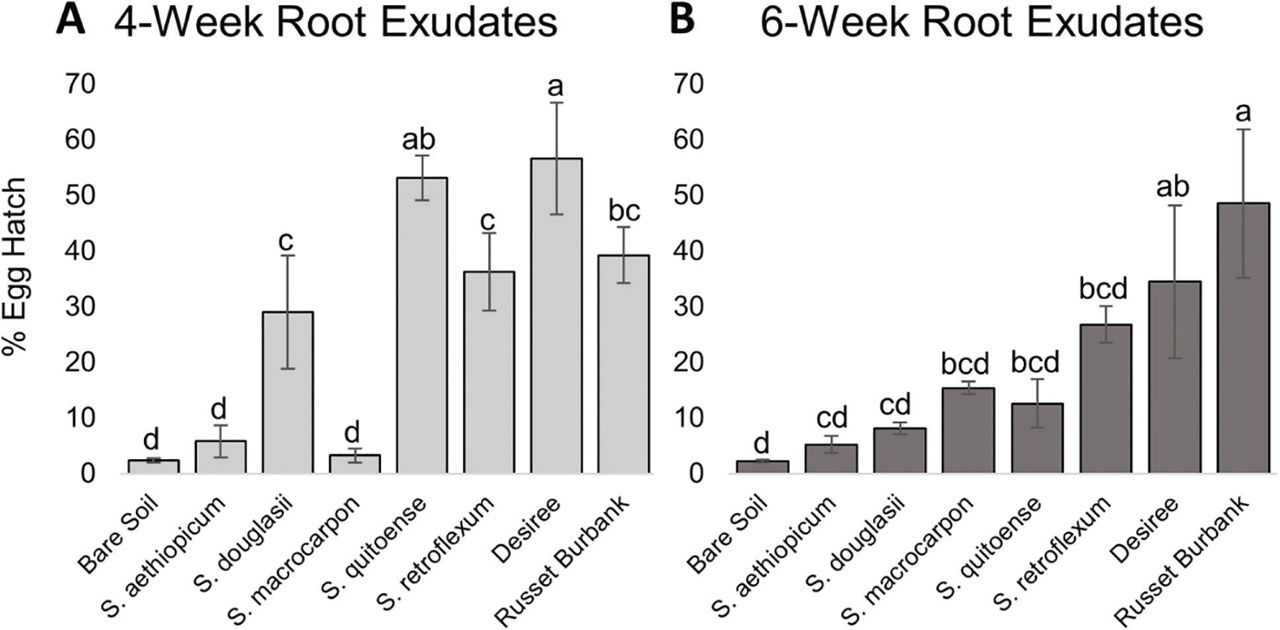
Figure 2:
Trial two mean percentage egg hatch two weeks after root exudate application.
A) Percentage egg hatch for root exudates collected at four weeks of growth. B) Percentage egg hatch for root exudates collected at six weeks of growth. Standard error of the means is indicated by the bars. Different letters indicate significantly different means based on least squares means at α = 0.05.