
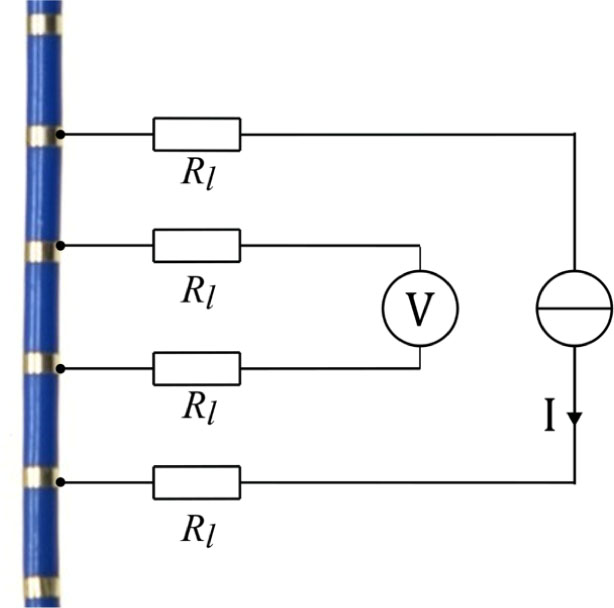
Figure 1:
Close-up of a section of the catheter, with a conceptual drawing of a single 4 electrode measurement. All electrode combinations with both measurement electrodes inside of the injection electrodes are considered.
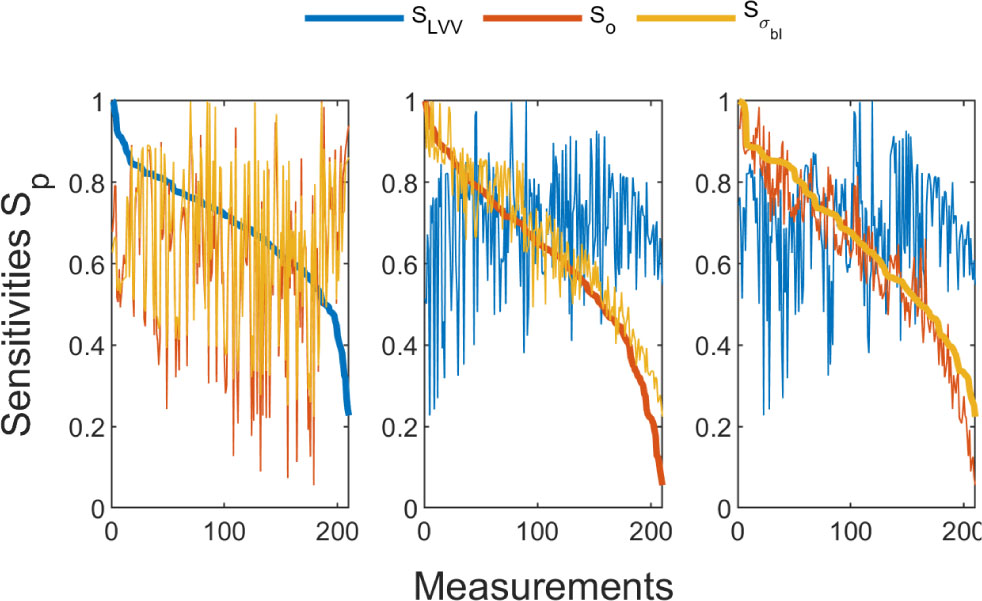
Figure 2:
Normalized sensitivity of the measurements. Sorted by three different parameters: LVV (left), blood conductivity (center), catheter offset (right).

Figure 3:
High-level overview of the FEM-based estimation algorithm using intracardiac admittance measurements.
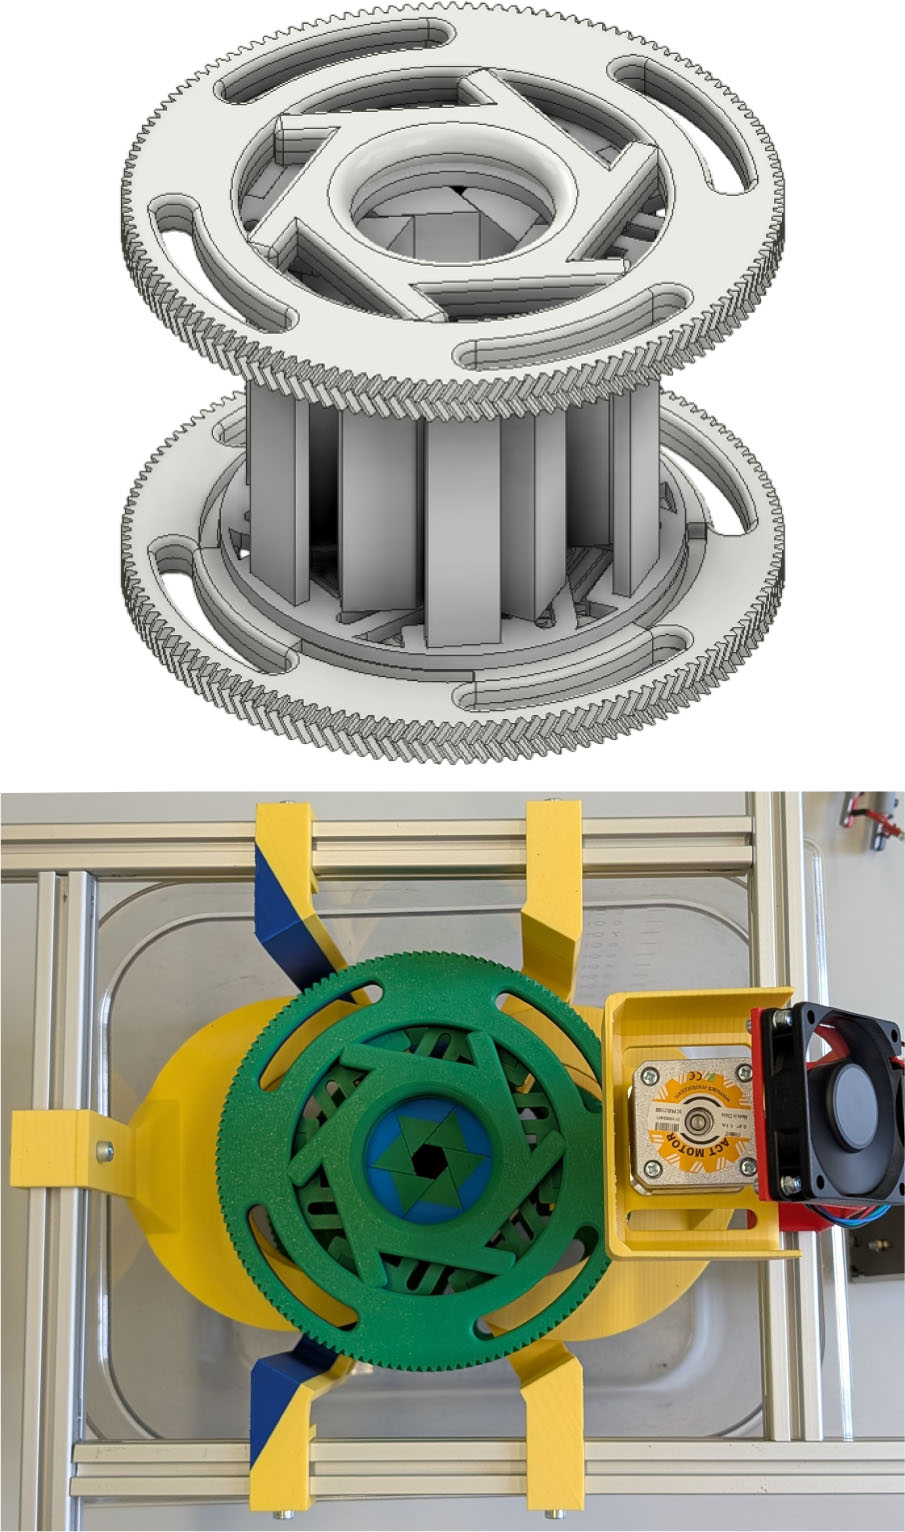
Figure 4:
Experimental setup; CAD drawing of phantom model phantom (top); Real phantom submerged in NaCl solution (bottom).
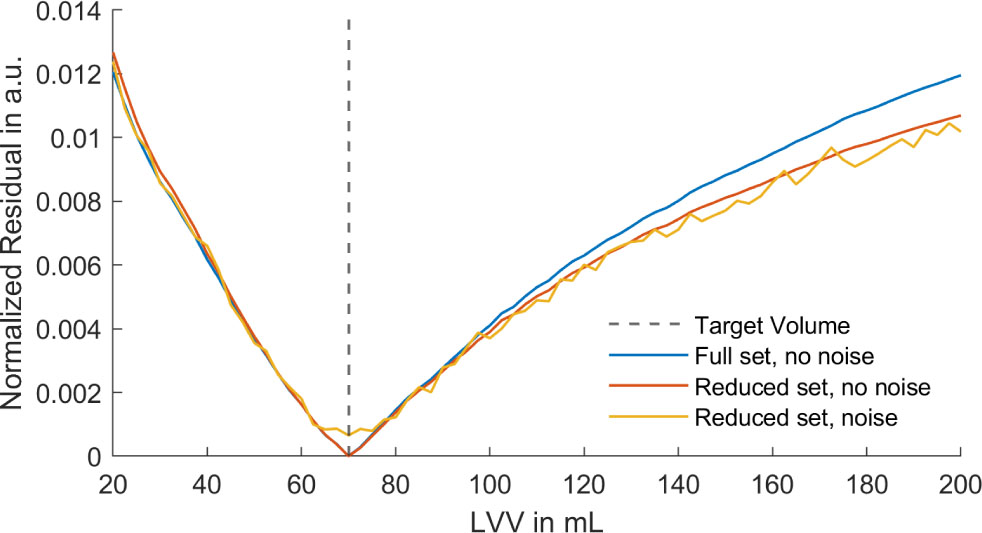
Figure 5:
Residual norm as a function of volume for the physiological simulation with a true volume of 70 mL: comparison of all 210 measurements, the reduced set of 19 measurements, and the reduced set with added noise.
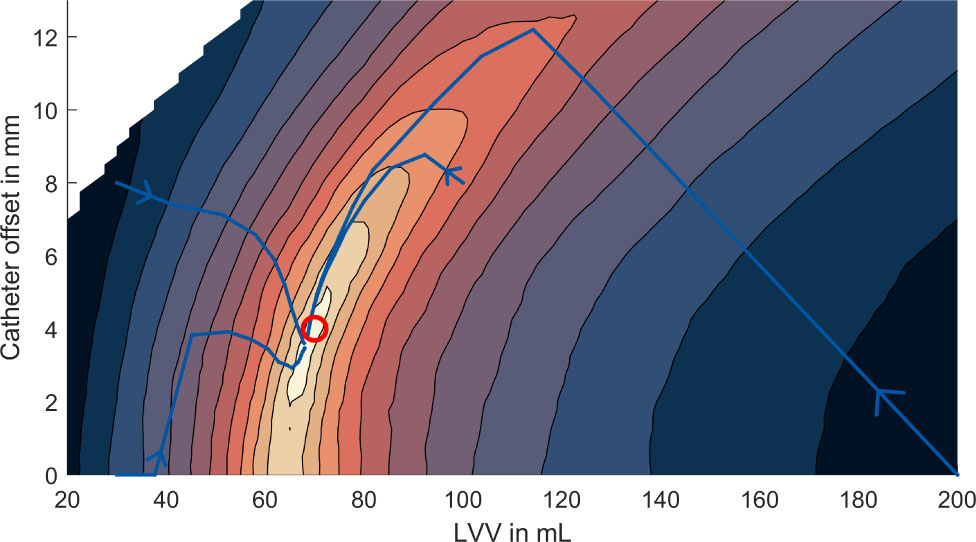
Figure 6:
Residual map for the simulation using the reduced set of 19 measurements; the true parameter combination is marked in red, and four Gauss–Newton iteration trajectories from different initial guesses are overlaid.
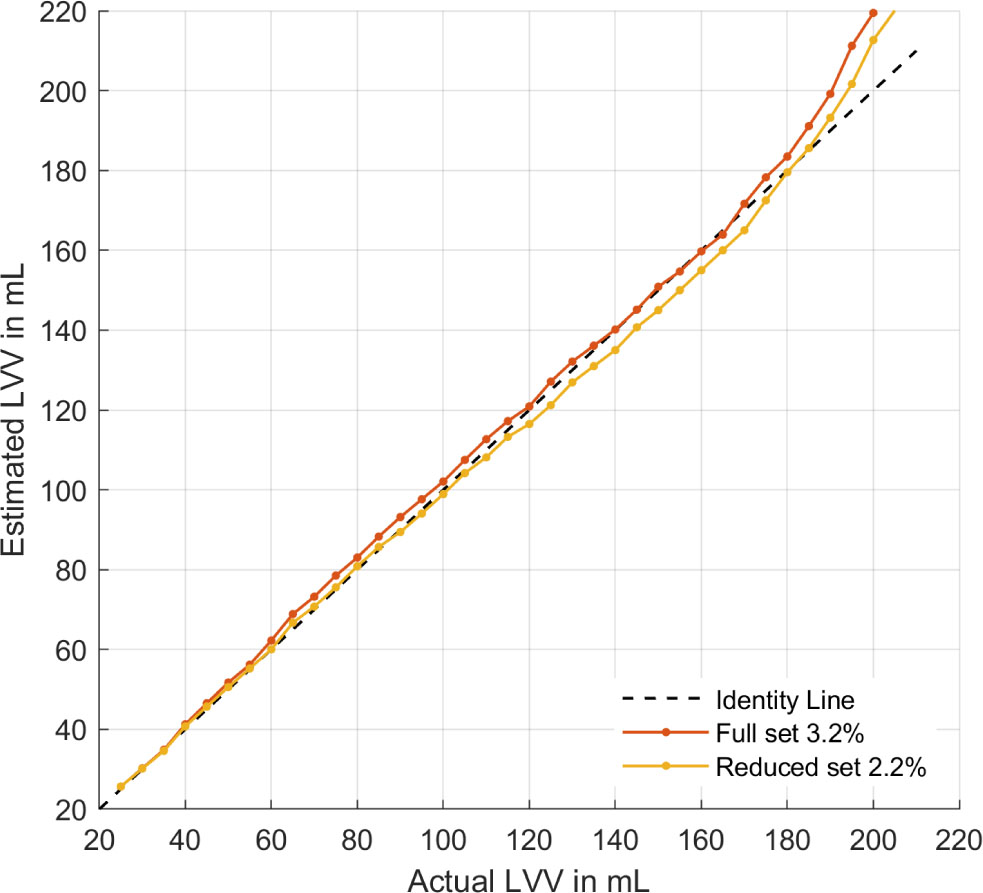
Figure 7:
Estimated volume over actual volume of the phantom experiment for the full set of 210 measurements and the reduced set of 19 measurements.
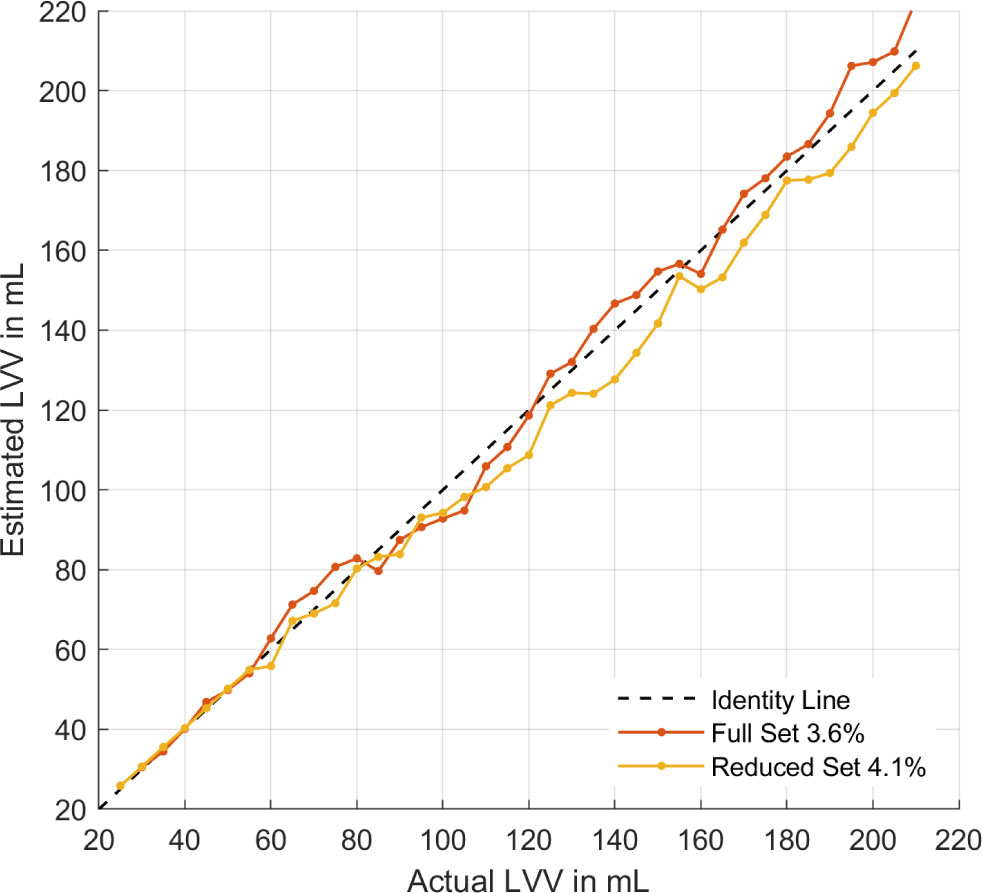
Figure 8:
Estimated volume for the joint volume and offset estimation in the phantom. Full measurement set of 210 measurements and the reduced set of 19 measurements.