
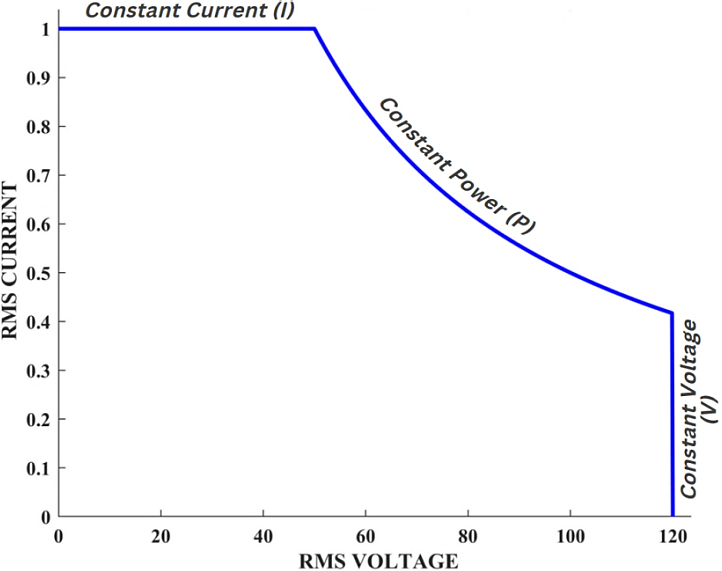
Figure 1:
Desired output characteristic. Current in amperes and voltage in volts.
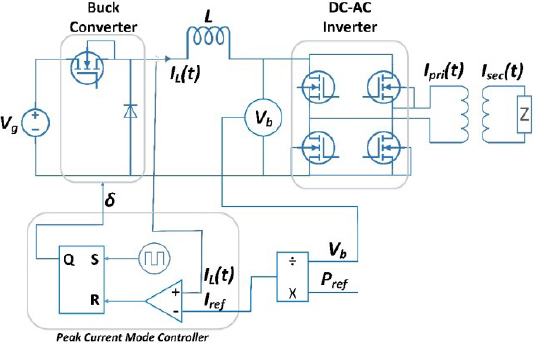
Figure 2:
Circuit diagram of Electrosurgical generator.
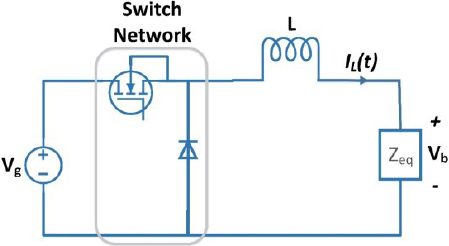
Figure 3:
Buck converter.
Table 1:
Parameters of buck converter.
| Parameter | Value | Unit |
|---|---|---|
| Input voltage (Vg) | 50 | Volt |
| Maximum output voltage (Vb) | 45 | Volt |
| Maximum average current (Iavg) | 3 | Ampere |
| Duty cycle (D) | 46 | Percent |
| Switching frequency (fs) | 1 x 10⁶ | Hz |
| Inductance (L) | 100 x 10−6 | Henry |
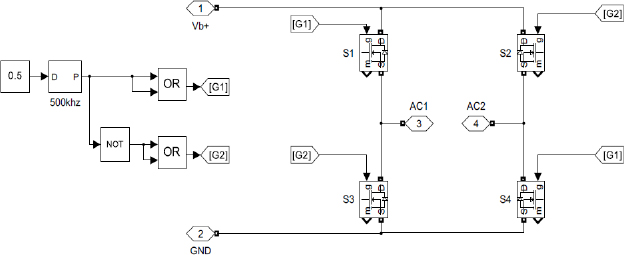
Figure 4:
High frequency DC-AC Inverter.
Table 2:
Parameters of inverter.
| Parameter | Value | Unit |
|---|---|---|
| Maximum Input DC voltage (yfc) | 45 | Volt |
| Maximum output voltage (VRMS) | 120 | Volt |
| Maximum output current (IRMS) | 1 | Ampere |
| Switching frequency (fs) | 500 x 103 | Hz |
| Transformer turn ratio | 1:3 | - |
| Impedance range | 10-340 | Ohms |
| Reference power command | 50 | Watt |
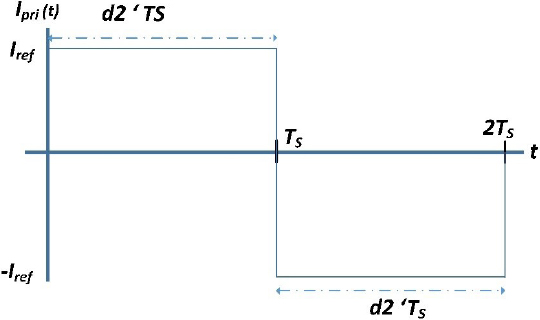
Figure 5:
CMC buck output current waveform.
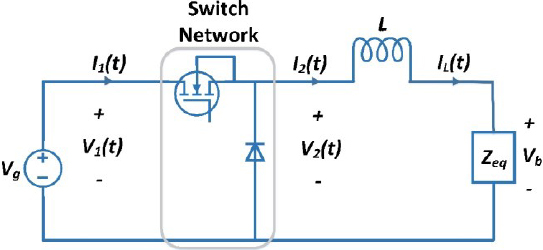
Figure 6:
Switch network terminal quantities of buck converter.
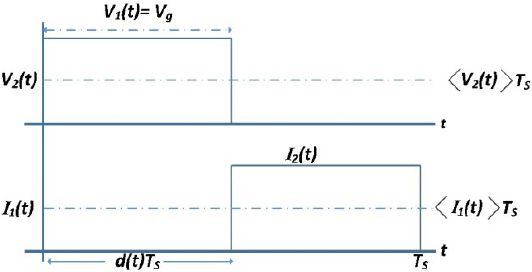
Figure 7:
Waveforms for circuit.
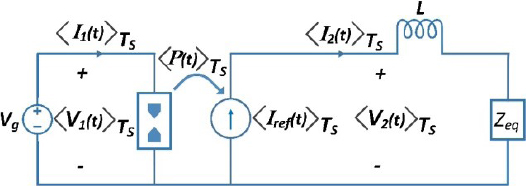
Figure 8:
Averaged switch network derived from equation (7).
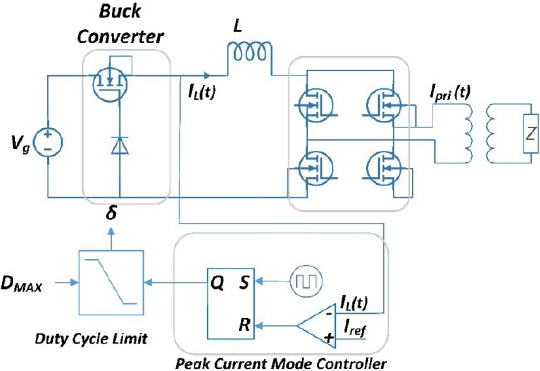
Figure 9:
Maximum voltage limit using duty cycle.
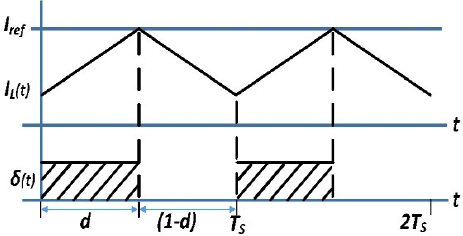
Figure 10:
Waveforms in PCM control.
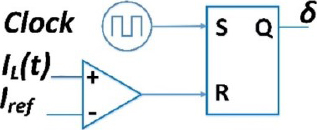
Figure 11:
Realization of Peak current mode controller.
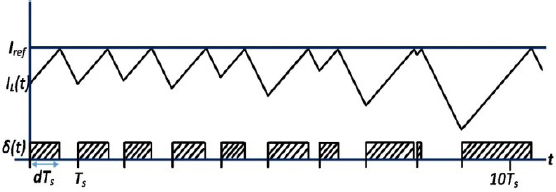
Figure 12:
PCM control waveforms showing instability
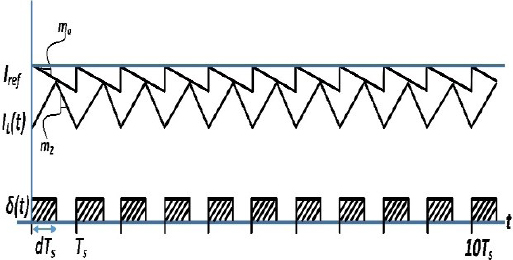
Figure 13:
PCM controller’s stability is improved by adding an artificial ramp.
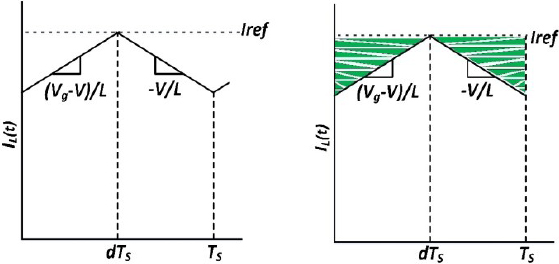
Figure 14:
Steady-state inductor current.
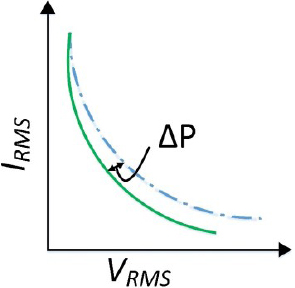
Figure 15:
Peak to average error in ideal curve using PCMC.
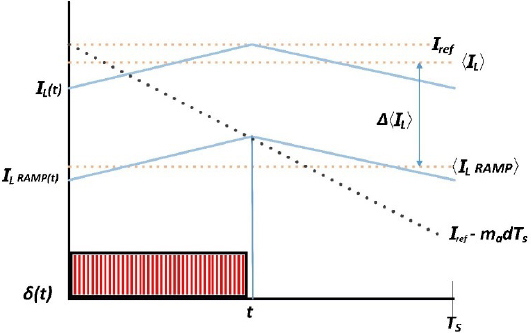
Figure 16:
PCM control with and without artificial ramp.
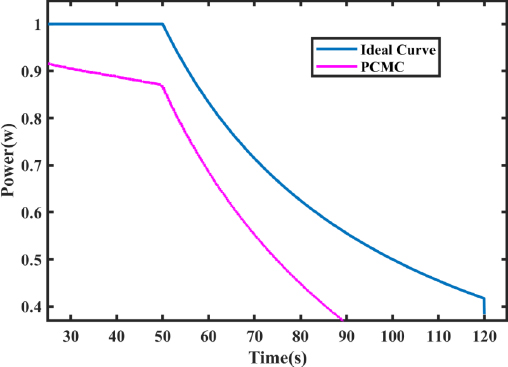
Figure 17:
Impact of PAE and artificial ramp error.
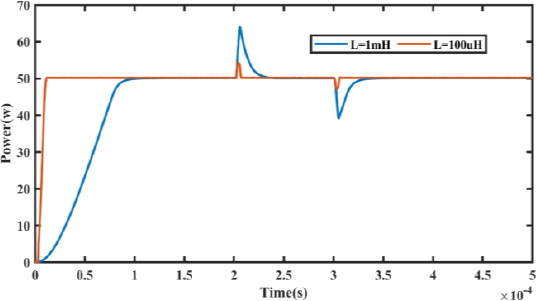
Figure 18:
Transient response under step load.
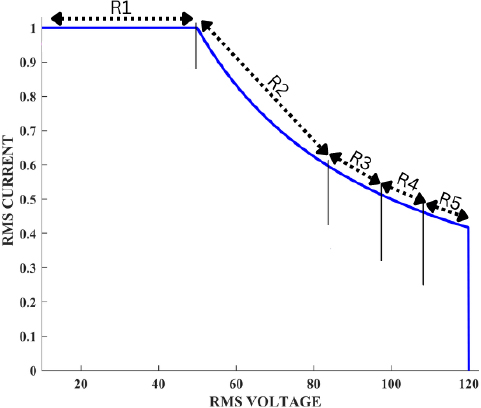
Figure 19:
Rules derivation from ideal curve.
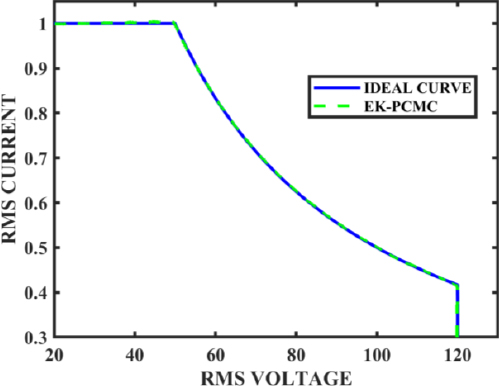
Figure 20:
Output curve using EK-PCMC.
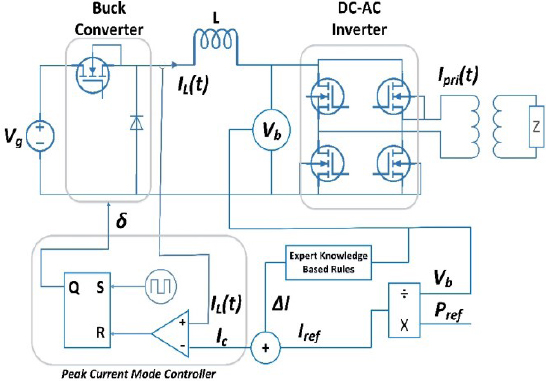
Figure 21:
Block diagram of ESU with EK-PCMC control.
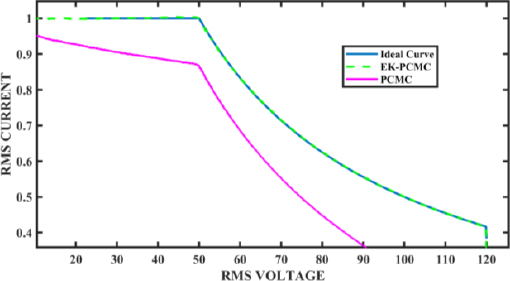
Figure 22:
Comparison of VI curves for Ideal, PCMC, and EK-PCMC.
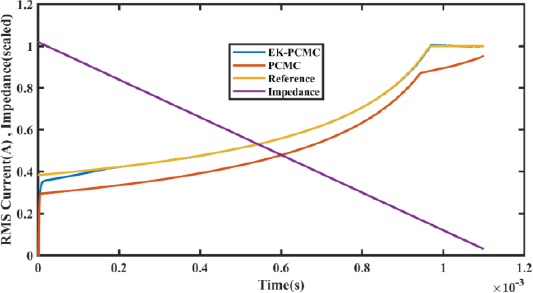
Figure 23:
Output current comparison under load variations.
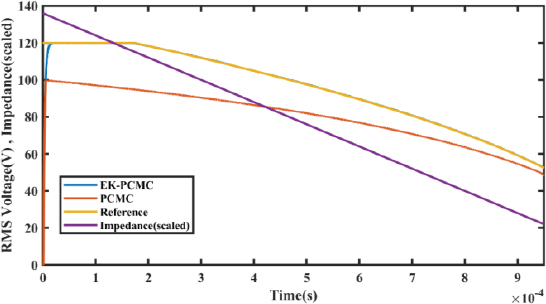
Figure 24:
Output voltage comparison under load variations.
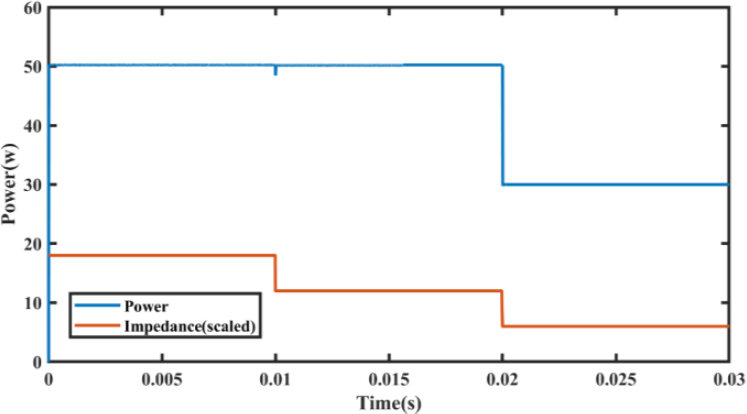
Figure 26:
Output Power for decreasing load steps.
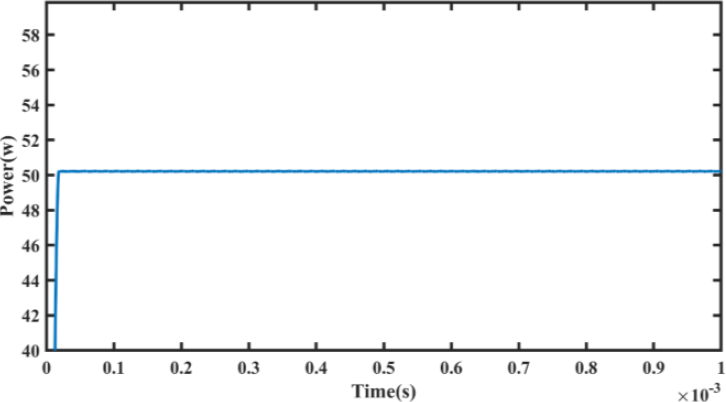
Figure 27:
Output power (zoomed).
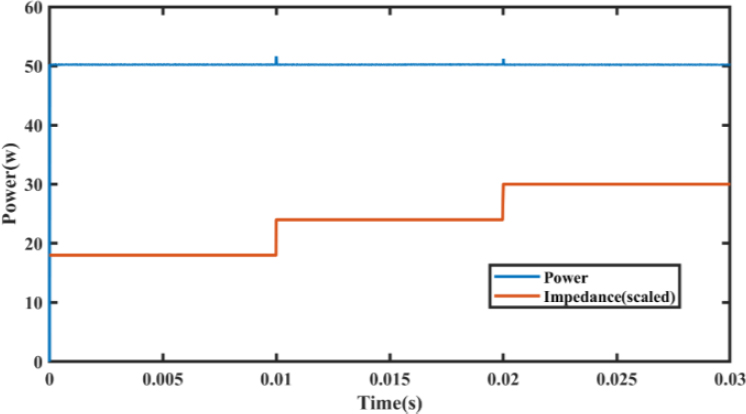
Figure 28:
Output Power for increasing load steps.
Table 3:
Performance comparison between proposed and PCMC.
| Controller | Integral square error (ISE) | Integral absolute error (IAE) |
|---|---|---|
| PCMC | 0.3190 | 0.0175 |
| EK-PCMC | 0.0822 | 0.0036 |
Table 4:
Performance comparison between proposed and previous work for increasing load.
| Performance criteria | Previous work | EK-PCMC |
|---|---|---|
| Step Response at 50W power at Impedance=90 ohm at time 0s | ||
| Power overshoot | 4.20% | 0.188% |
| Rise time of Power | 0.89 ms | 0.0047 ms |
| Settling time of power | 2.1 ms | 0.017 ms |
| Load step from Z1 to Z2(90 ohm to 120 ohm) at time 0.01s | ||
| Power overshoot | 9% | 3.2% |
| Load step from Z2 to Z3(120 ohm to 150 ohm) at time 0.02s | ||
| Power overshoot | 10% | 2.6% |
Table 5:
Performance comparison between proposed and previous work for decreasing load.
| Performance criteria | Previous work | EK-PCMC |
|---|---|---|
| Step Response at 50W power at Impedance=90 ohm | ||
| Power overshoot | 4.20% | 0.188% |
| Rise time of Power | 0.89 ms | 0.0047 ms |
| Settling time of power | 2.1 ms | 0.017 ms |
| Load step from Z1 to Z2(90 ohm to 60 ohm) at time 0.01s | ||
| Power Undershoot | NA | 3.2% |
| Load step from Z2 to Z3(120 ohm to 30 ohm) at time 0.02s | ||
| Power Undershoot | NA | (In constant current mode) |