Figure 1
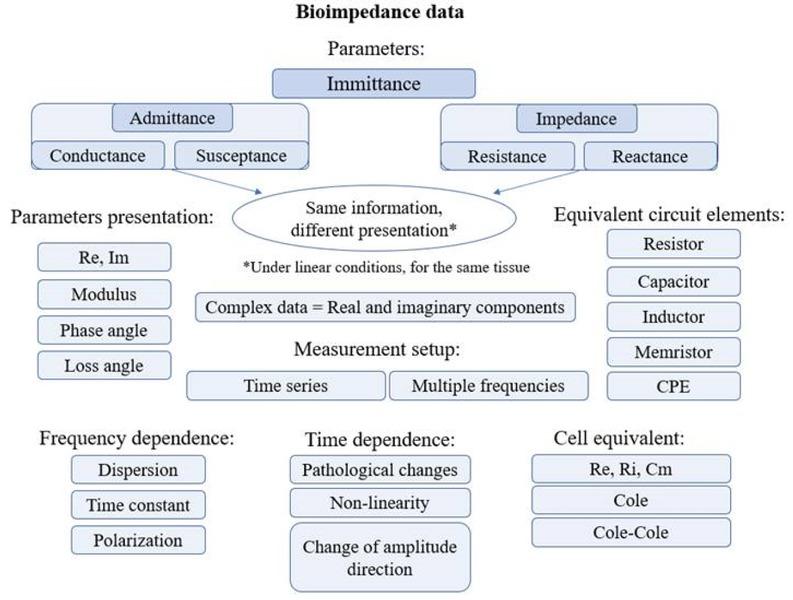
Figure 2
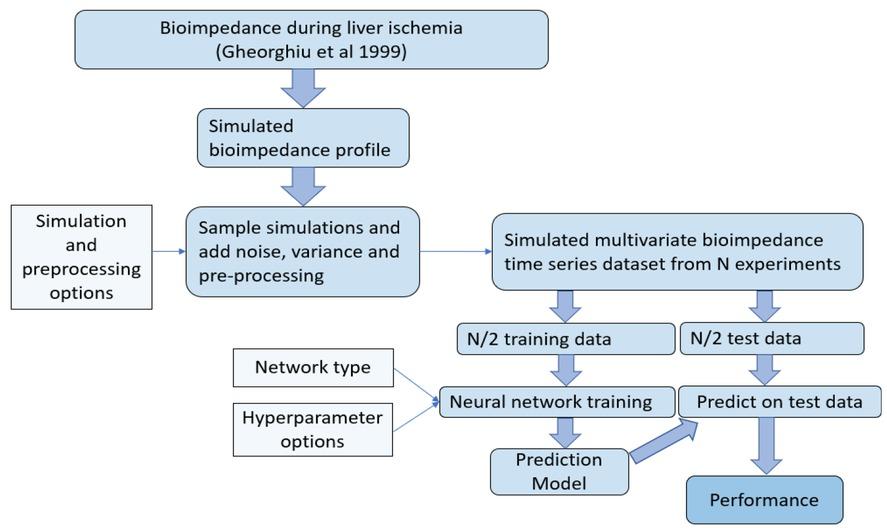
Figure 3
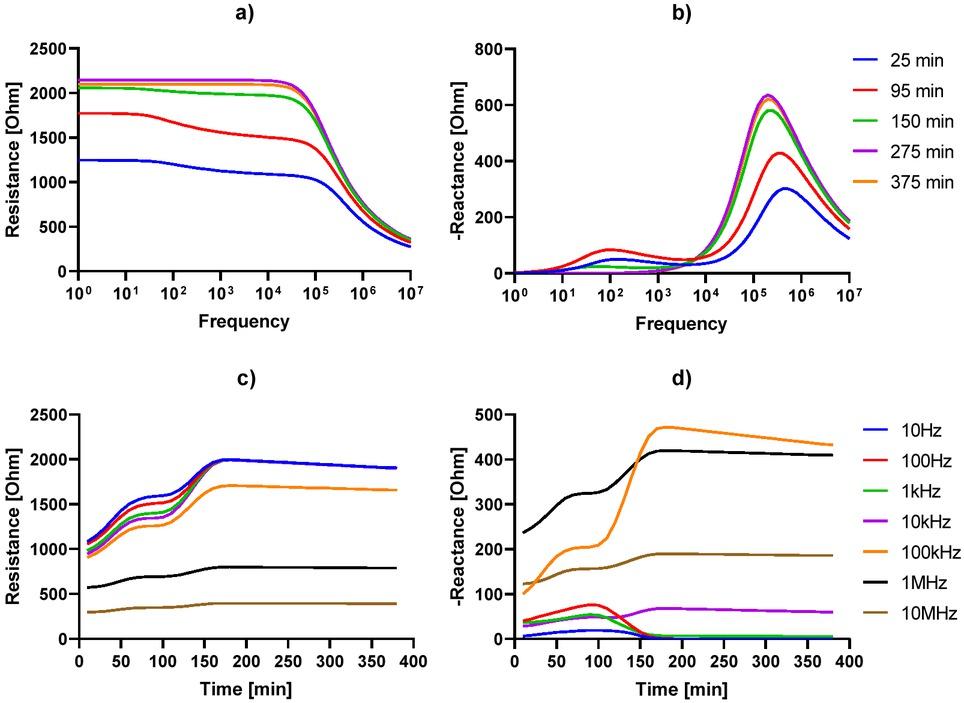
Figure 4
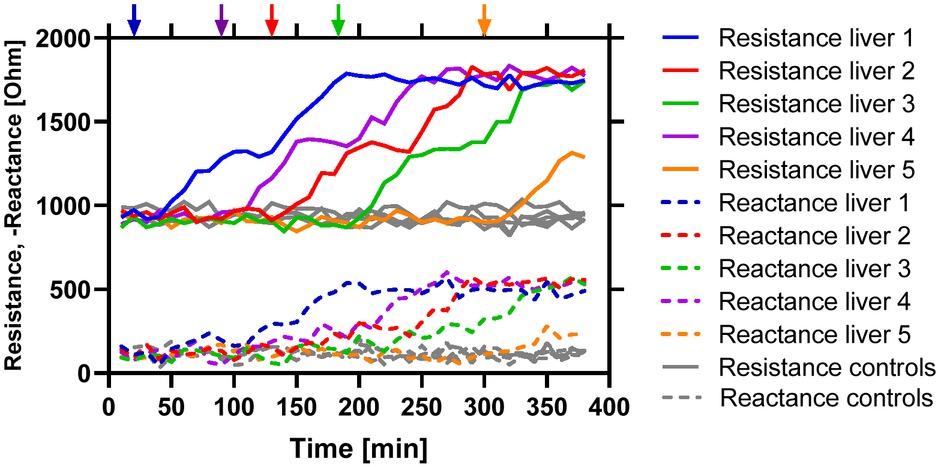
Figure 5
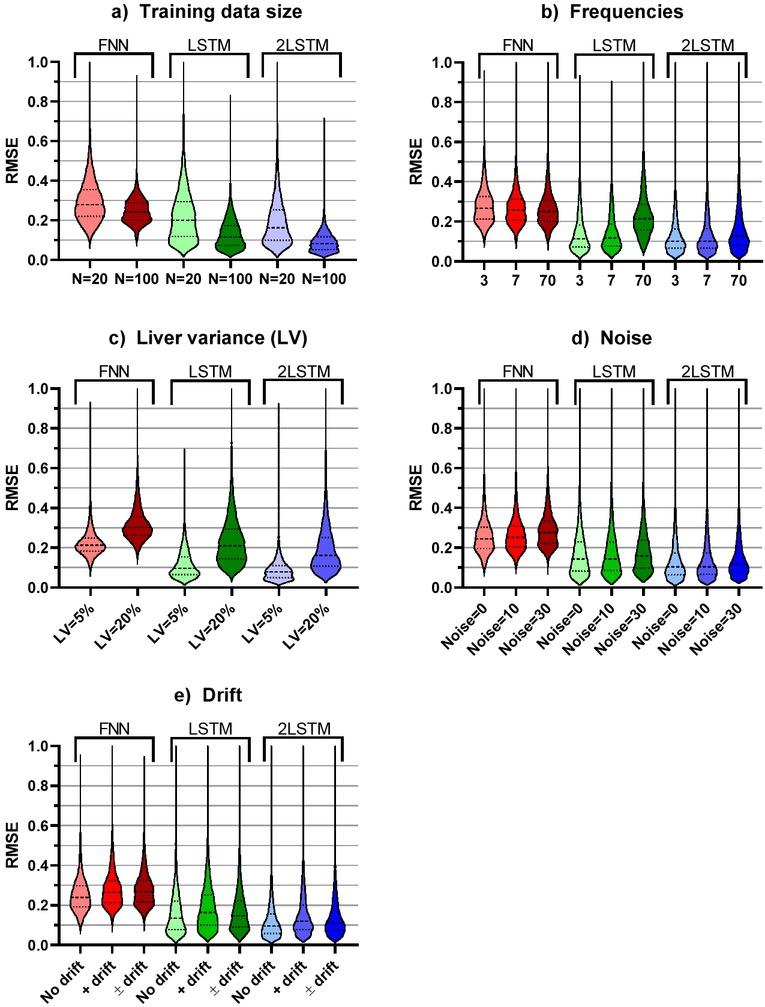
Figure 6
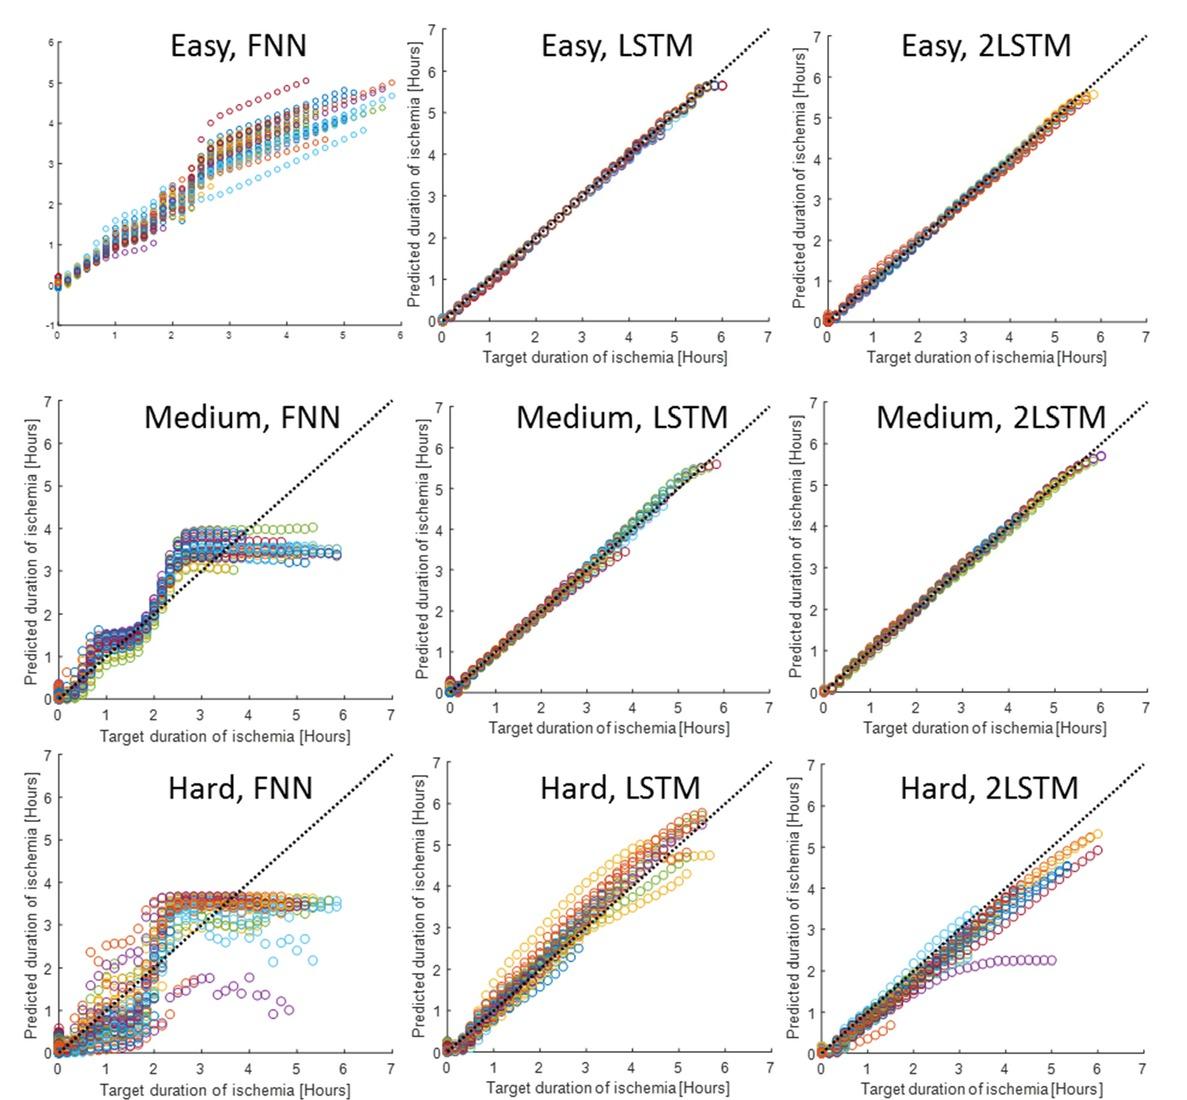
List of all variables used for comparing different varieties of the bioimpedance input data and hyperparameters in the machine learning for prediction of ischemic duration_
| Variable | Description | Tested levels | Values |
|---|---|---|---|
| Measurement noise | Setting for simulated input data | 3 | 0, 10, 30 |
| Liver variance | Setting for simulated input data | 2 | 5, 20 |
| Drift | Setting for simulated input data | 3 | 0 ±50 +100 |
| Frequencies | Selection of input variables | 3 | {102 104 106}, 101:7, 101:0.1:7 |
| Sample size | Training and testing data size | 2 | 20, 100 |
| Regularization | Neural network hyperparameter | 3 | 10-1, 10-2, 10-3 |
| Hidden layer size | Neural network hyperparameter | 3 | 2, 5, 25 |
| Minibatch size | Neural network hyperparameter | 2 | 16, 32 |
| Epochs | Neural network hyperparameter | 2 | 250, 500 |
Comparison of prediction performance for the different ANN architectures in three different cases of difficulty based on the liver-to-liver variance, noise and drift in the measurement_ The selection of input frequencies and hyperparameters for the best prediction performance of the different ANN architectures is provided in the rows below the prediction performances_ The last row presents the best prediction performance when all 70 frequencies are used as input to the ANN_ RMSEP=root mean square error of prediction, RMSEC=root mean square error of calibration, both having units of ischemia duration in hours_
| Case | Easy | Medium | Hard | ||||||
|---|---|---|---|---|---|---|---|---|---|
| Liver variance | 5 % | 5 % | 20 % | ||||||
| Noise | 0 | 10 | 30 | ||||||
| Drift | 0 | 100 | 100 | ||||||
| Drift direction | None | Increasing | Both | ||||||
| Training examples | 100 | 100 | 100 | ||||||
| Best performance | FNN | LSTM | 2LSTM | FNN | LSTM | 2LSTM | FNN | LSTM | 2LSTM |
| Mean RMSEP | 0.124 | 0.016 | 0.017 | 0.173 | 0.029 | 0.026 | 0.256 | 0.079 | 0.066 |
| Std RMSEP | 0.025 | 0.003 | 0.009 | 0.044 | 0.003 | 0.012 | 0.044 | 0.013 | 0.015 |
| Mean RMSEC | 0.112 | 0.014 | 0.015 | 0.175 | 0.026 | 0.021 | 0.256 | 0.037 | 0.038 |
| Std RMSEC | 0.029 | 0.005 | 0.007 | 0.029 | 0.006 | 0.009 | 0.029 | 0.006 | 0.018 |
| Frequencies | 70 | 3 | 7 | 70 | 7 | 3 | 70 | 3 | 3 |
| Hidden layer size | 25 | 25 | 5 | 5 | 5 | 25 | 2 | 25 | 25 |
| l2 regularization | 0.1 | 0.001 | 0.001 | 0.001 | 0.001 | 0.001 | 0.001 | 0.001 | 0.001 |
| Training epochs | NA | 500 | 500 | NA | 500 | 500 | NA | 500 | 500 |
| Minibatch size | NA | 32 | 32 | NA | 32 | 32 | NA | 32 | 16 |
| Mean RMSEP (freq=70) | 0.124 | 0.056 | 0.022 | 0.173 | 0.073 | 0.035 | 0.256 | 0.142 | 0.106 |