
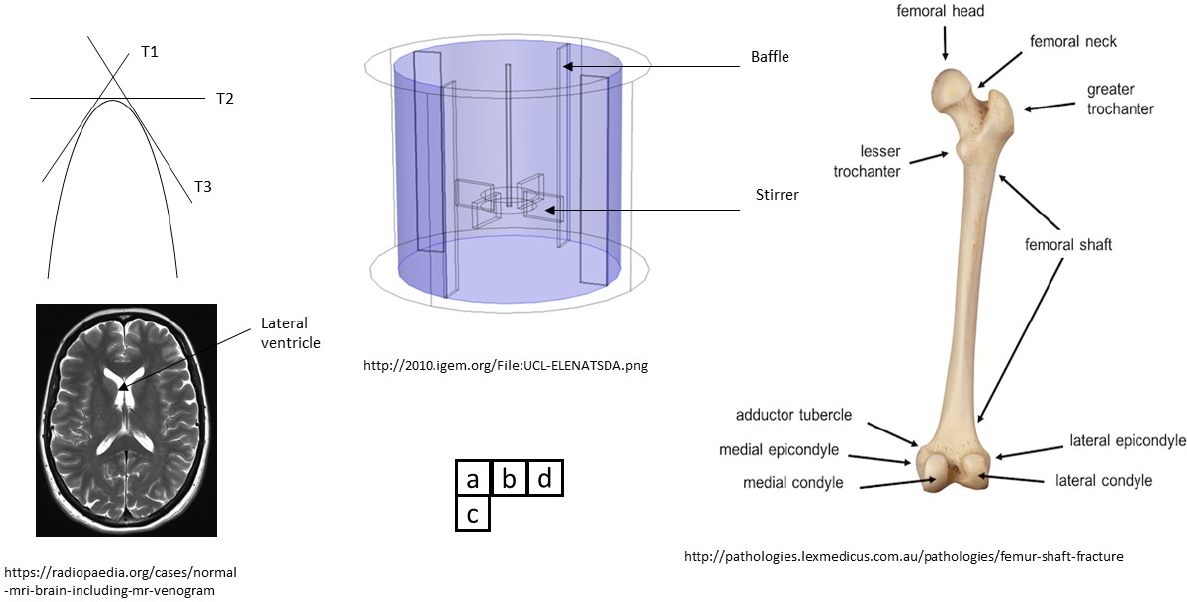
Fig.1
(a) High curvature objects of interest in (c)(d) Medical imaging & (b) process tomography.
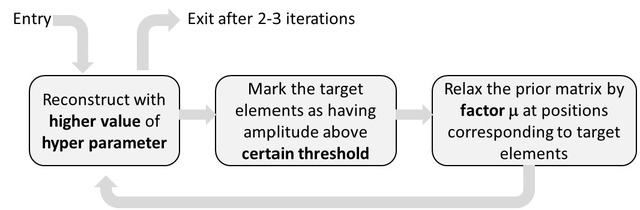
Fig.2
Flow of DeTER.
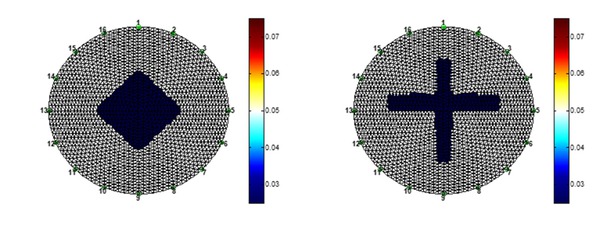
Fig.3
Conductivity distributions simulated to verify use of DeTER.
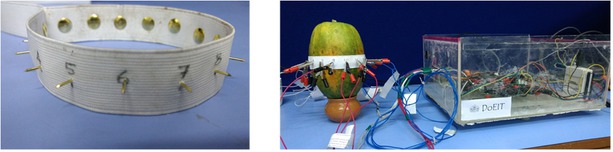
Fig.4
(a) Modified electrode interface (b) Papaya under test with electrodes attached.
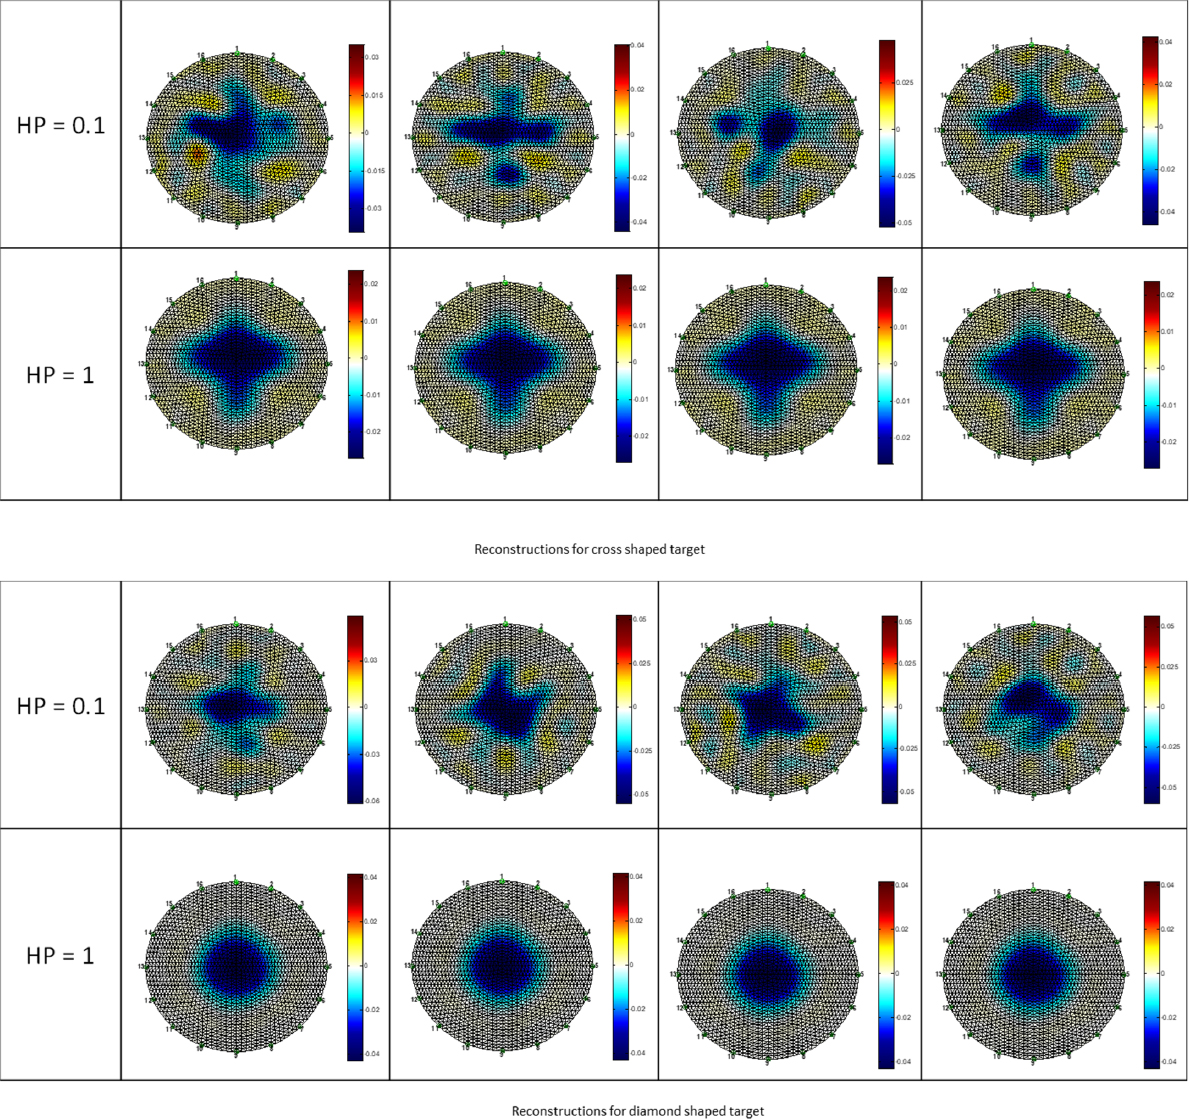
Fig.5
Effect of hyper parameter in the reconstruction process HP: hyper parameter; 0.1 indicates low regularization and 1 indicates hish regularization.
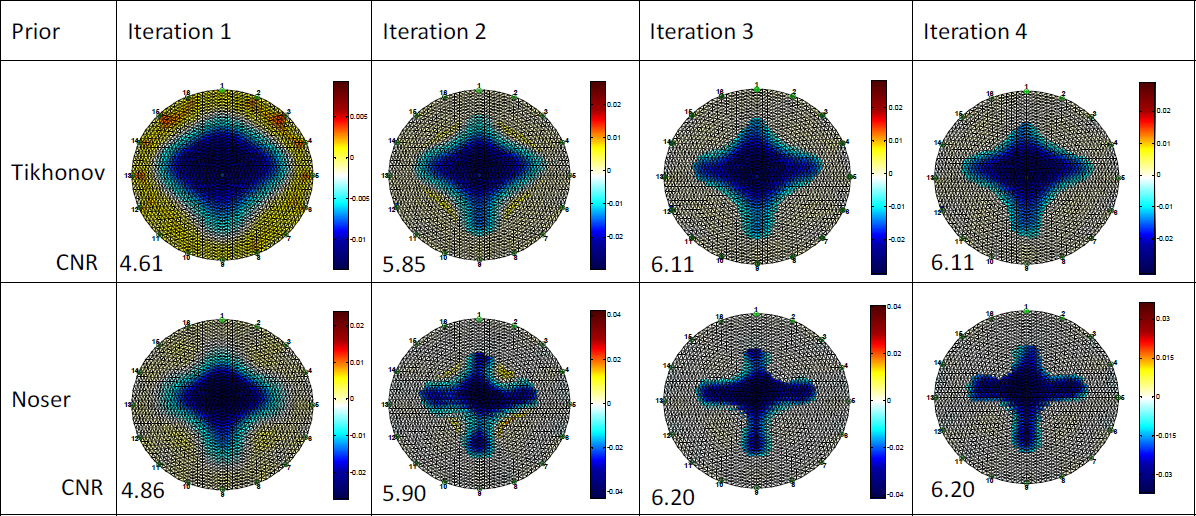
Fig.6
Effect of type of prior on reconstructed image using DeTER.
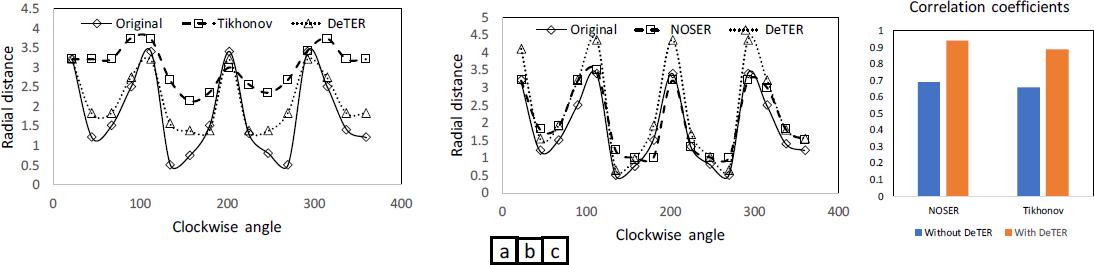
Fig.7
Plots of shape descriptor function for original and reconstructed images without and with DeTER (3rd iteration) using (a) Tikhonov and (b) NOSER prior (c) comparison of correlation coefficients for (a) and (b).
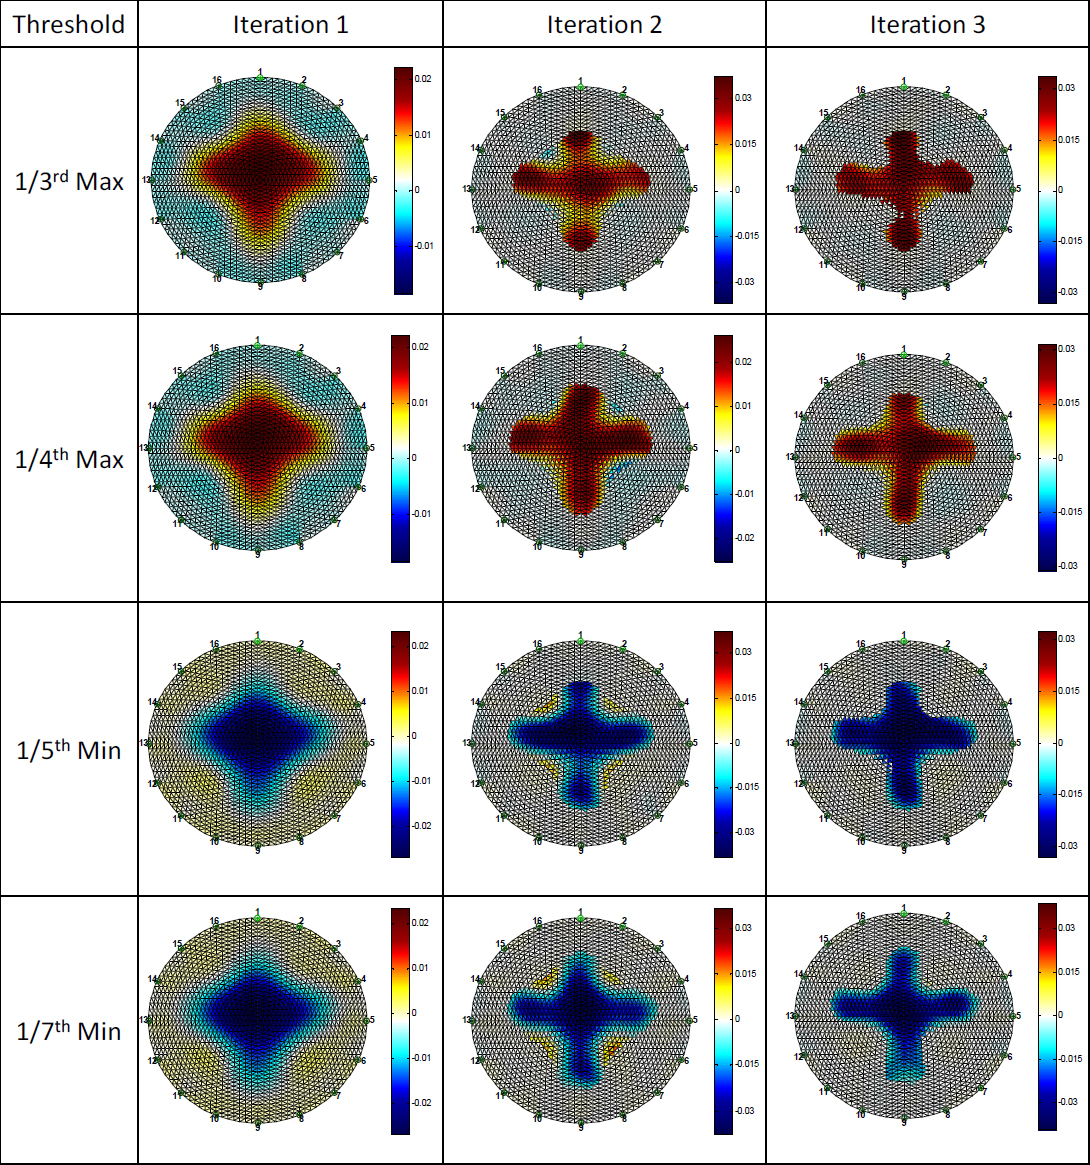
Fig.8
Effect of threshold on reconstruction of conducting and non-conducting objects.
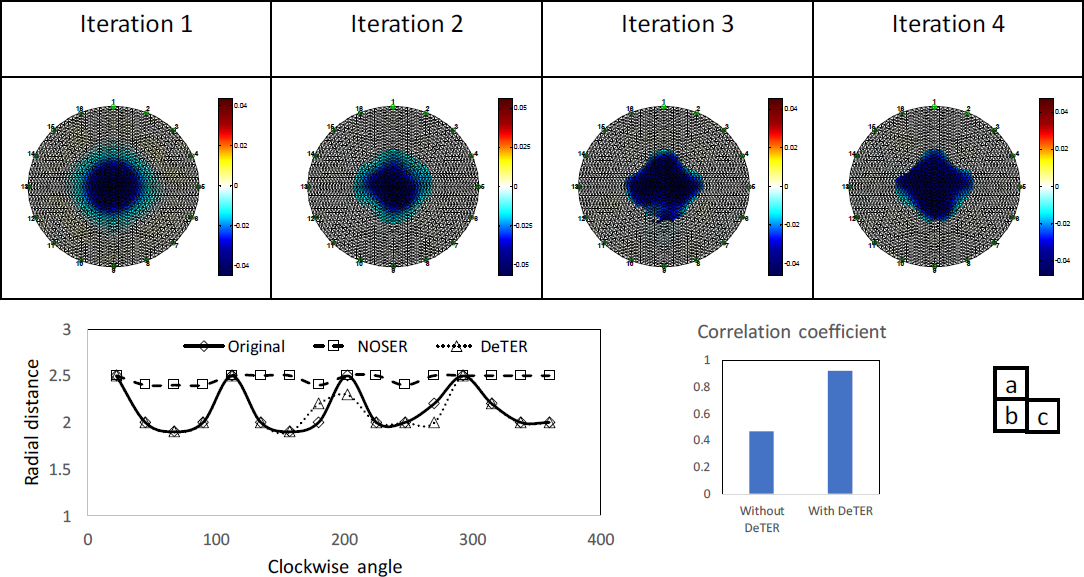
Fig.9
(a) Reconstruction of diamond shape object with DeTER using NOSER prior (b)Shape descriptor for original and reconstructed images with and without DeTER (c) Comparison of correlation coefficients.
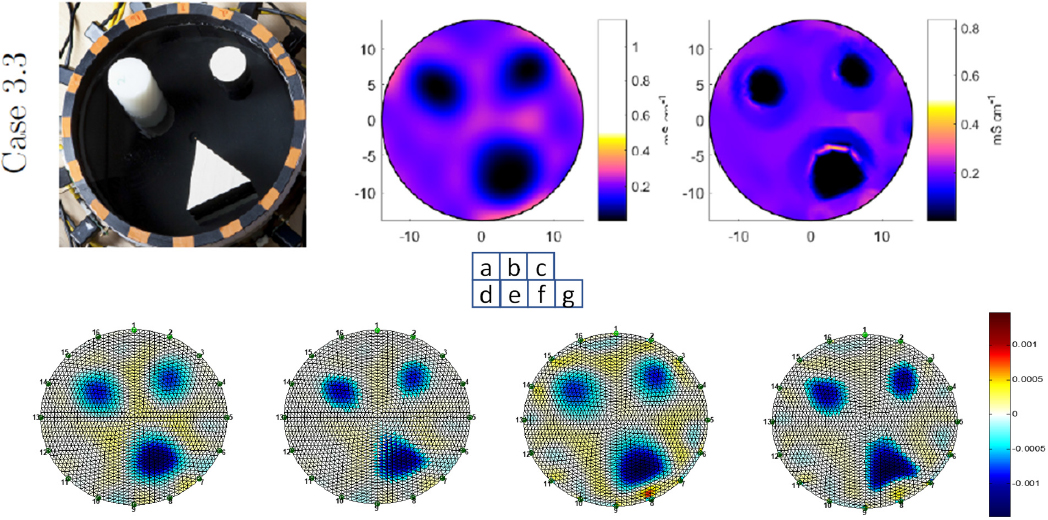
Fig.10
Reconstructions for open data. (a)(b)(c) case3.3 actual photograph with reconstructed images in open EIT data. (d)(e) Reconstructed images without and with DeTER using NOSER prior. (f)(g) Reconstructed images without and with DeTER using Tikhonov prior.
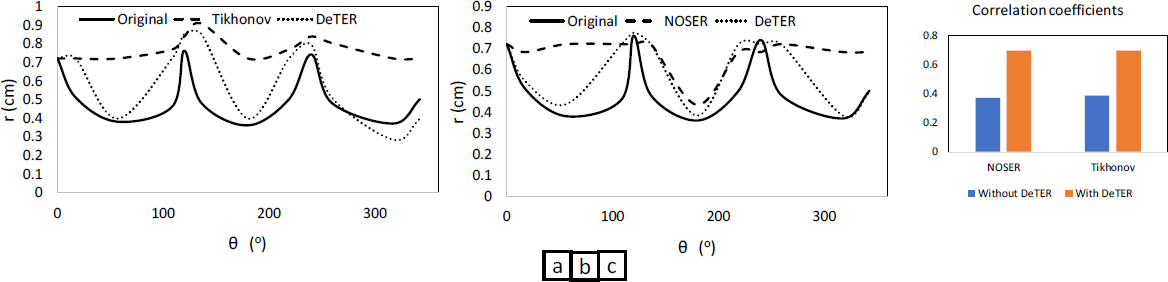
Fig.11
Shape descriptor functions for triangular target in original and reconstructed images with and without DeTER using (a) Tikhonov and (b) NOSER prior (c) comparison of correlation coefficients for (a) and (b).
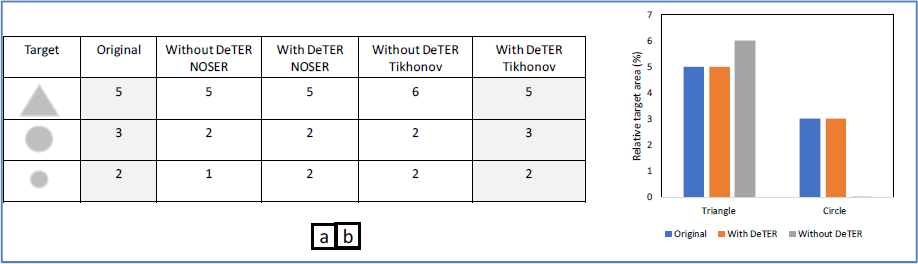
Fig.12
(a) Relative target area (%) for all targets in the original and reconstructed images
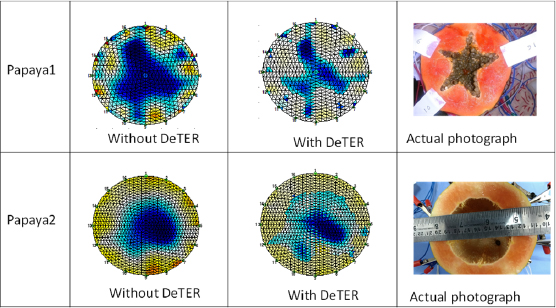
Fig.13
Reconstructed images with actual cross-sectional cuts of papaya fruits
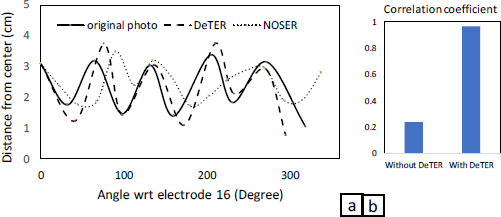
Fig.14
(a) Shape descriptor functions for void in papaya1 and its images. (b) Comparison of correlation coefficients.
Table 1
Improvements in correlation coefficient for shape descriptor function
| Parameter | Correlation coefficient for shape descriptor function | ||||
|---|---|---|---|---|---|
| Data | Simulated | Open data | DoEIT | ||
| Inclusion | Cross | Diamond | Triangle | Circle | Papaya1 |
| Original | 1 | 1 | 1 | 1 | 1 |
| With DeTER | 0.94 | 0.92 | 0.70 | 1.00 | 0.96 |
| Without DeTER | 0.69 | 0.47 | 0.39 | 1.00 | 0.23 |
Table 2
Improvement in relative target area
| Parameter | Relative target area (%) | ||
|---|---|---|---|
| Data | Open data | DoEIT | |
| Inclusion | Triangle | Circle | Papaya2 |
| Original | 5 | 3 | 33 |
| With DeTER | 5 | 5 | 36 |
| Without DeTER | 6 | 2 | 28 |
Table 3
Improvement in CNR
| Parameter | Contrast to noise ratio (CNR) | ||
|---|---|---|---|
| Data | Simulated | DoEIT | |
| Inclusion | Cross | Diamond | Papaya1 |
| With DeTER | 6.20 | 6.21 | 6.10 |
| Without DeTER | 4.86 | 4.62 | 4.55 |
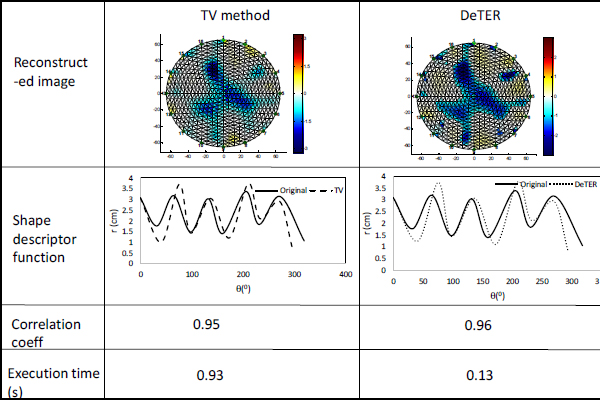
Fig.15
Comparison of DeTER with the TV method.