
Figure 1
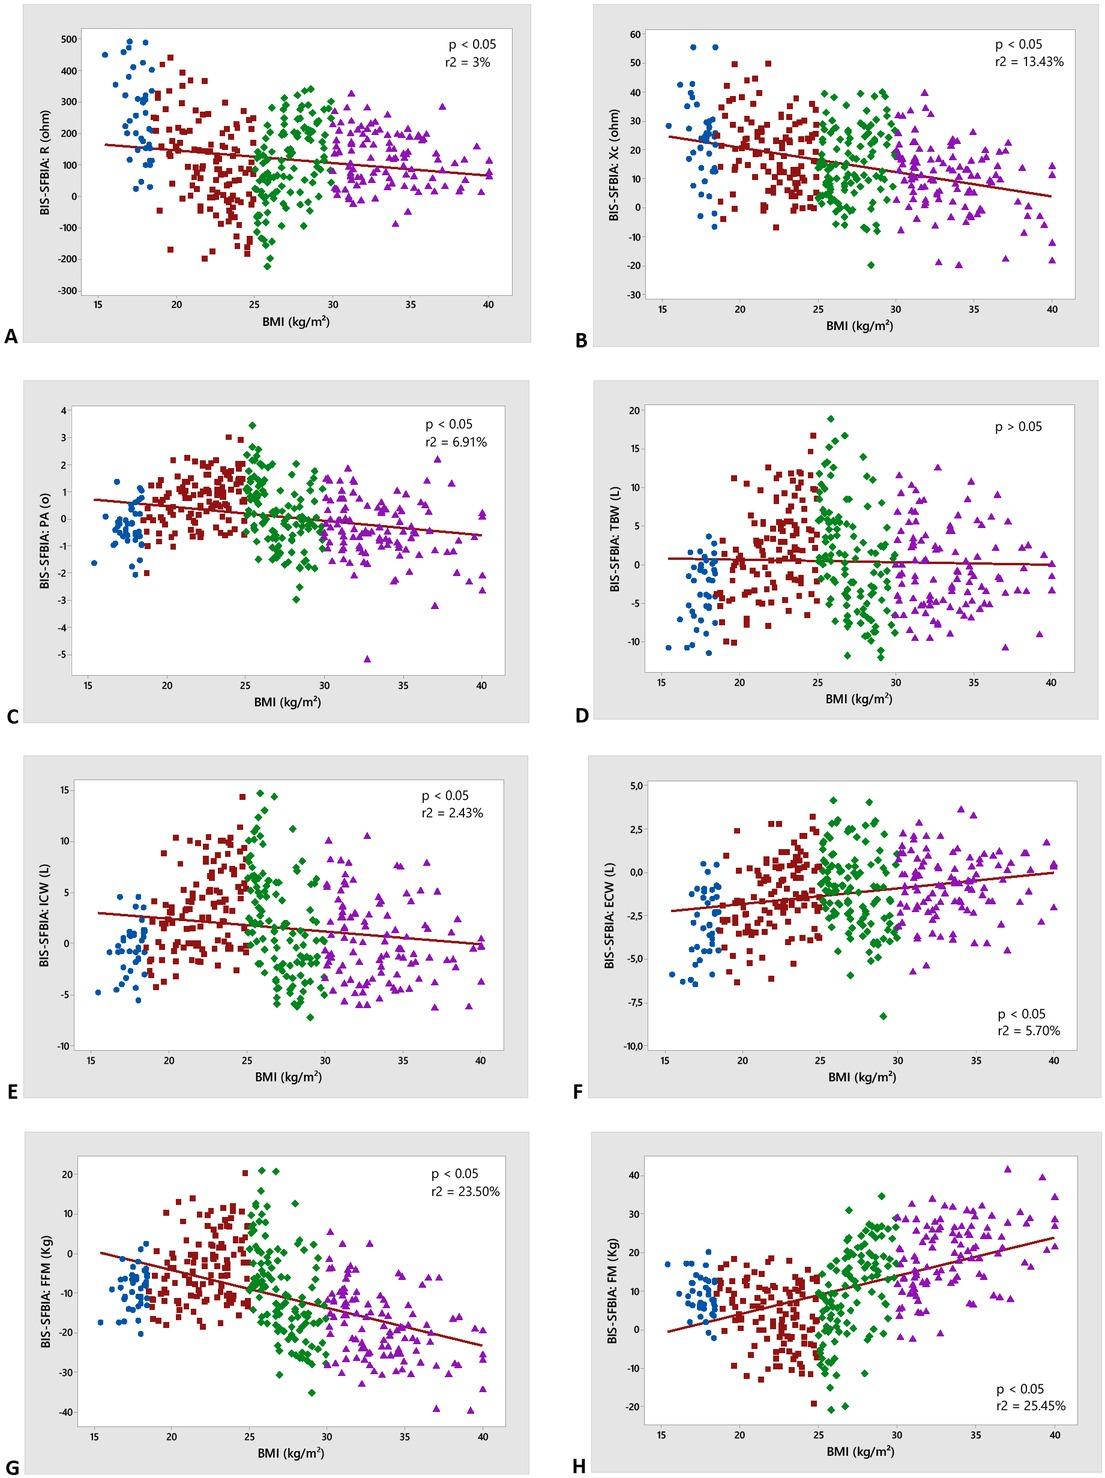
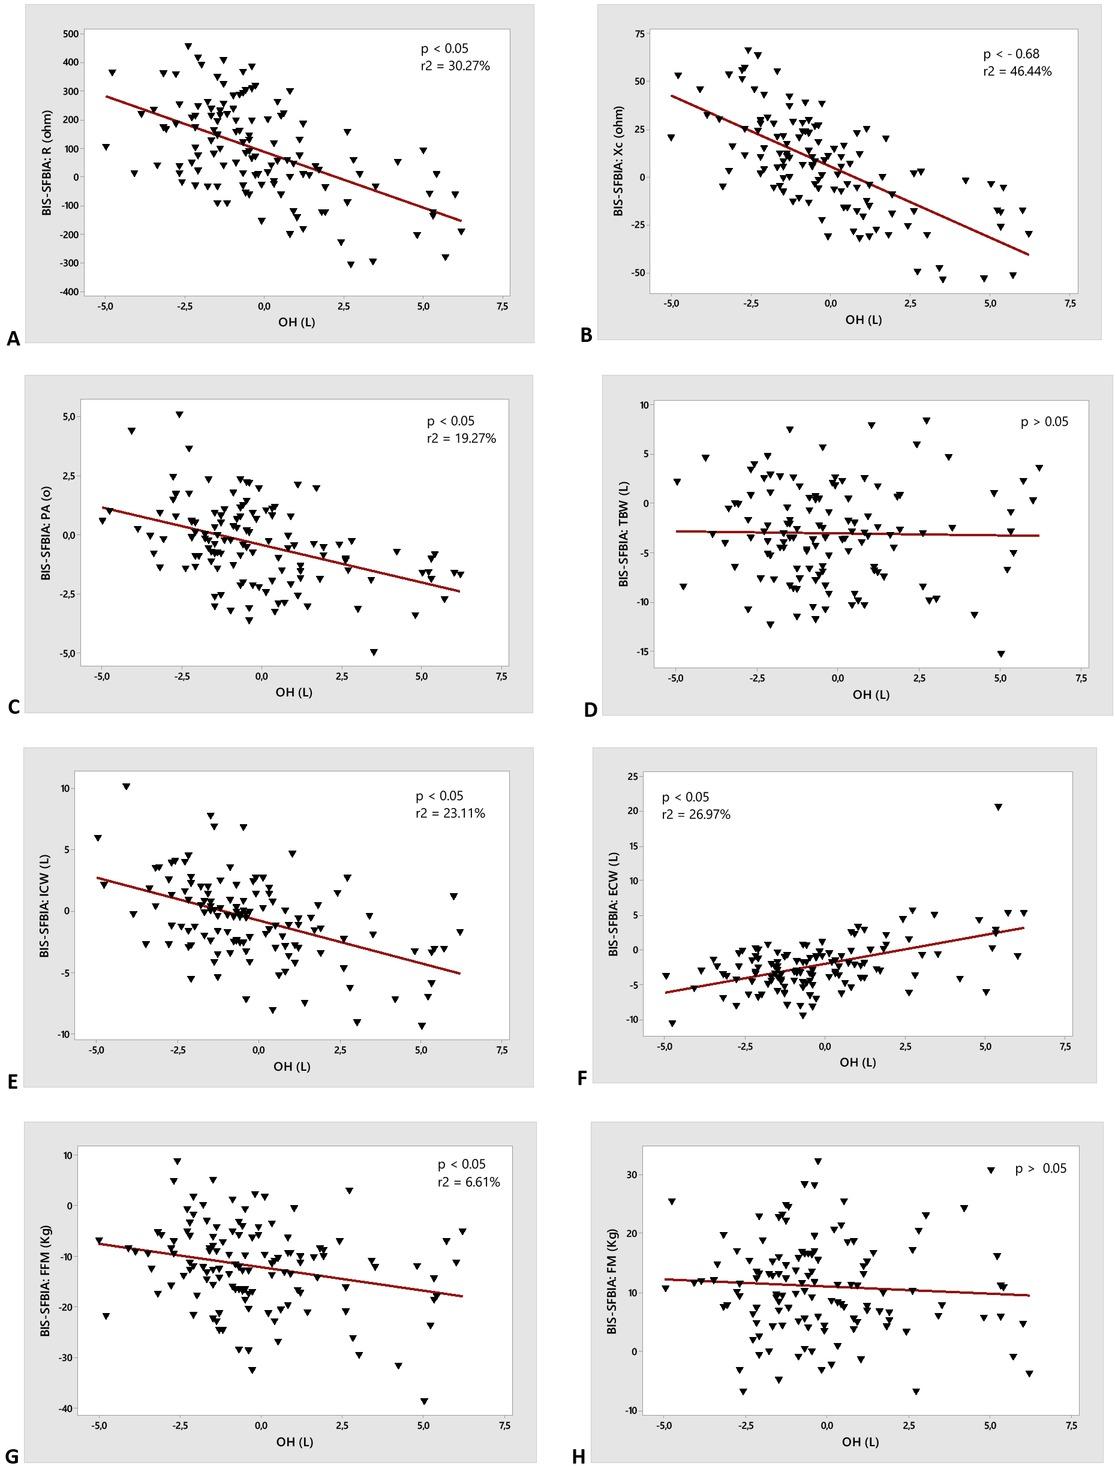
Figure 2
Descriptive data for non-CKD subjects stratified in BMI subgroups and for CKD patients stratified in PD and HD subgroups
| BMI<18.5 | 18.5≤BMI<25 | 25≤BMI<30 | BMI≥30 | PD | HD | |
|---|---|---|---|---|---|---|
| n | 40 | 120 | 118 | 108 | 30 | 93 |
| Women (%) | 32 | 62 | 59 | 52 | 11 | 42 |
| (80) | (51) | (50) | (48) | (37) | (45) | |
| Age (years) | 26±4.2a | 29±3.9a | 29±4.6a | 30±5a | 52±19b | 47±13c |
| (20 to 38) | (20 to 40) | (20 to 40) | (20 to 40) | (15 to 81) | (20 to 76) | |
| Weight (kg) | 48±4.9a | 64±9.4b | 79±9.8c | 98±12d | 68±13be | 72±17e |
| (39 to 60) | (45 to 87) | (59 to 109) | (71 to 124) | (38 to 93) | (42 to 137) | |
| BMI (kg/m2) | 18±0.7a | 22±1.8b | 27±1.4c | 34±2.7d | 24±3.4e | 26±5e |
| (15 to 18) | (19 to 25) | (25 to 30) | (30 to 40) | (16 to 32) | (17 to 44) | |
| OH (L) | -0.1±0.4a | -0.3±0.7a | -0.5±0.9ab | -0.8±0.9b | 2.1±2.2c | -0.9±1.9b |
| (-1.2 to 0.9) | (-1.9 to 1.5) | (-3.1 to 2.1) | (-3 to 1.8) | (-0.7 to 6.2) | (-5 to 6.0) | |
| OH>1.1 L (%) | 0 | 0 | 4 | 3 | 17 | 10 |
| (0) | (0) | (3) | (3) | (57) | (11) | |
| OH<-1.1 L (%) | 0 | 14 | 29 | 42 | 0 | 49 |
| (0) | (12) | (25) | (39) | (0) | (53) | |
| FFM (kg) | 34±6.3a | 43±11b | 45±13b | 46±13b | 34±6.6a | 38±9.7a |
| (26 to 51) | (26 to 70) | (27 to 76) | (25 to 76) | (24 to 56) | (20 to 60) | |
| FFMI (kg/m2) | 12±1.5a | 15±2.8b | 15±3.1b | 15±3.1b | 12±1.8a | 14±2.6a |
| (10 to 16) | (9 to 22) | (10 to 23) | (9 to 23) | (8 to 16) | (8 to 20) | |
| FM (kg) | 14±4a | 21±7.1b | 34±9.3c | 52±12d | 30±12c | 34±16c |
| (4 to 21) | (3 to 37) | (11 to 57) | (24 to 83) | (9 to 56) | (2 to 99) | |
| FMI (kg/m2) | 5±1.5a | 7±2.7b | 12±3.5c | 18±4.6d | 11±4.2c | 12±5.6c |
| (1 to 8) | (1 to 13) | (4 to 19) | (8 to 29) | (4 to 19) | (1 to 29) | |
| PA (ₒ) | 5.8±0.5a | 6.6±0.8b | 6.8±0.8b | 6.8±0.8b | 4.7±1.1c | 6.1±1.2a |
| (4.8 to 7) | (4.8 to 8.2) | (5.3 to 9) | (5 to 8.9) | (2.8 to 7.1) | (3 to 9.1) | |
| Impairment Nutritional status (%)1 | 4 | 7 | 4 | 2 | 23 | 33 |
| (10) | (6) | (3) | (2) | (76) | (36) | |
| DM (%) | 0 | 0 | 0 | 0 | 10 | 61 |
| (0) | (0) | (0) | (0) | (33) | (66) | |
| SAH (%) | 0 | 0 | 0 | 0 | 19 | 61 |
| (0) | (0) | (0) | (0) | (63) | (66) | |
| Residual Diuresis (ml)2 | 937±680*** | 170±330*** | ||||
| (50 to 2000) | (0 to 2000) | |||||
| Kt/V1 | 2.6±0.9*** | 1.5±0.3*** | ||||
| (1.4 to 4.5) | (1 to 2.5) | |||||
| Duration of dialytic treatment | 33±32*** | 63±48*** | ||||
| (months)2 | (3 to 144) | (5 to 264) | ||||
| Dialytic treatment >12 months (%) | 21 | 82 | ||||
| (70) | (88) |
Statistics of BIS vs SFBIA data in CKD subjects (PD and HD subgroups)
| PD subgroup (n=30) | ||||||||
|---|---|---|---|---|---|---|---|---|
| Bland-Altman | ||||||||
| 95% limits of agreement | ||||||||
| Data analysed | BIS | SFBIA | ICC | r | Biasa (%)b | 95%CI Biasc (%)d | Lower | Upper |
| R (ohm) | 533±83 | 532±83 | 0.03 | 0.04 | 1±115 (0.2±21) | 42 to 44 (7.5 to 8) | -224 | 226 |
| Xc (ohm) | 44±15 | 48±14 | -0.16 | -0.2 | -4±22 (-9±47) | -12 to 4.4 (-27 to 8.4) | -48 | 40 |
| PA (ₒ) TBW (L) | 4.7±1.1 34±5.4 | 5.1±1 38±6.4 | -0.23 0.59** | -0.2 0.75*** | -0.5±1.6 (-10±34) -4.2±4.2 (-11±11) | -1.1 to 0.15 (-23 to 2.7) -5.7 to -2.6 (-16 to -7.4) | -3.7 -12 | 2.7 4.1 |
| ECW (L) | 17±3.3 | 19±3.2 | 0.47** | 0.52** | -1.4±3.2 (-8.3±19) | -2.6 to -0.2 (-15 to -1.4) | -7.7 | 4.9 |
| ICW (L) | 17±2.7 | 20±3.9 | 0.40** | 0.58** | -2.8±3.2 (-14±16) | -3.9 to -1.6 (-20 to -1.2) | -9 | 3.4 |
| FFM (kg) | 34±6.6 | 49±8.9 | 0.50** | 0.79*** | -15±8.3 (-36±17) | -18 to -12 (-43 to -30) | -31 | 1.3 |
| FM (kg) | 31±12 | 19±12 | 0.14* | 0.44** | 11±7.7 (95±257) | 7.7 to 13 (1.0 to 191) | -4.5 | 26 |
| HD subgroup (n=93) | ||||||||
| Bland-Altman | ||||||||
| 95% limits of agreement | ||||||||
| Data | BIS | SFBIA | ICC | r | Biasa (%)b | 95%CI Biasc (%)d | Lower | Upper |
| analysed | ||||||||
| R (ohm) | 730±128 | 606±103 | -0.03 | -0.05 | 124±168 (18±25) | 90 to 159 (13 to 23) | -206 | 454 |
| Xc (ohm) | 78±22 | 68±17 | 0.18* | 0.16 | 10±25 (13±38) | 5.2 to 16 (5.3 to 21) | -40 | 60 |
| PA (ₒ) | 6.1±1.2 | 6.4±1.3 | 0.05 | 0.07 | -0.3±1.7 (-5.3±29) | -0.7 to 0.1 (-11 to 0.6) | -3.7 | 3 |
| TBW (L) | 33±6.9 | 36±5.7 | 0.64** | 0.71*** | -2.6±5 (-8.5±14) | -3.7 to -1.6 (-11 to -5.6) | -12 | 7.1 |
| ECW (L) | 14±3.2 | 17±3.1 | 0.38** | 0.51** | -2.6±3.1 (-18±19) | -3.3 to -2 (-21 to -14) | -8.8 | 3.5 |
| ICW (L) | 19±4.2 | 19±3.7 | 0.68** | 0.68** | -0.01±3.2 (-0.7±17) | -0.7 to 0.6 (-4.1 to 2.8) | -6.3 | 6.2 |
| FFM (kg) | 38±9.7 | 49±7.9 | 0.65** | 0.85*** | -11±8.2 (-27±20) | -13 to -9.3 (-31 to -23) | -27 | 5.1 |
| FM (kg) | 34±16 | 23±13 | 0.32** | 0.58** | 11±8.2 (45±44) | 9.5 to 13 (36 to 54) | -5 | 27 |
Statistics of BIS vs SFBIA data in non-CKD BMI stratified subgroup
| Underweight subjects (n=40) | ||||||||
|---|---|---|---|---|---|---|---|---|
| Bland-Altman | ||||||||
| 95% limits of agreement | ||||||||
| Data analysed | BIS | SFBIA | ICC | r | Biasa (%)b | 95%CI Biasc (%)d | Lower | Upper |
| R (ohm) | 848±74 | 596±103 | -0.02 | -0.12 | 252+134 (35.5+18.9) | 209 to 294 (29 to 42) | -10 | 513 |
| Xc (ohm) | 86±9.3 | 63±9.5 | -0.03 | -0.12 | 23+14 (31.1+18.1) | 19 to 28 (25 to 37) | -4.6 | 51 |
| PA (ₒ) | 5.8±0.5 | 6.1±0.6 | 0.12 | 0.09 | -0.3+0.8 (-4.8+12.6) | -0.5 to -0.05 (-8.9 to -0.7) | -1.8 | 1.2 |
| TBW (L) | 27±3.9 | 30±4.1 | 0.38** | 0.47** | -3.4+4.1 (-11.7+14.3) | -4.7 to -2 (-16 to -7.1) | -11 | 4.7 |
| ECW (L) | 11±1.4 | 14±2.2 | 0.20* | 0.47** | -2.9+2 (-22.8+14.8) | -3.6 to -2.3 (-28 to -18) | -6.8 | 0.9 |
| ICW (L) | 16±2.6 | 16±1.9 | 0.45** | 0.44** | -0.4+2.5 (-3.1+14.8) | -1.2 to 0.4 (-7.9 to 1.7) | -5.2 | 4.4 |
| FFM (kg) | 34±6.3 | 43±4.8 | 0.26* | 0.59** | -9.1+5.1 (-24.4+13.9) | -11 to -7.5 (-29 to -20) | -19 | 1 |
| FM (kg) | 14±4 | 5±4.4 | 0.07* | 0.27* | 8.8+5.1 (81+202.4) | 7.2 to 10 (15 to 147) | -1.1 | 19 |
| Normal weight subjects (n=120) | ||||||||
| Bland-Altman | ||||||||
| 95% limits of agreement | ||||||||
| Data analysed | BIS | SFBIA | ICC | r | Biasa (%)b | 95%CI Biasc (%)d | Lower | Upper |
| R (ohm) | 718±99 | 621±97 | -0.02 | -0.05 | 97+141 (14.6+20.6) | 71 to 122 (11 to 18) | -180 | 374 |
| Xc (ohm) | 82±9.6 | 63±8.9 | 0.04 | 0.13 | 19+12 (25.8+16.9) | 16 to 21 (23 to 29) | -5.3 | 43 |
| PA (ₒ) | 6.6±0.8 | 5.9±0.5 | 0.10 | 0.17 | 0.7+0.9 (11.1+14.1) | 0.5 to 0.9 (8.6 to 14) | -1 | 2.5 |
| TBW (L) | 35±7.3 | 32±4.4 | 0.51** | 0.62** | 2.1+5.7 (4.9+16.7) | 1.0 to 3.1 (1.8 to 7.9) | -9.1 | 13 |
| ECW (L) | 14±2.6 | 16±2.4 | 0.58** | 0.66** | -1.3+2.1 (-9.4+14.3) | -1.7 to -0.9 (-12 to -6.8) | -5.4 | 2.7 |
| ICW (L) | 20±4.8 | 17±2 | 0.27* | 0.56** | 3.4+4 (16.2+19.4) | 2.7 to 4.1 (13 to 20) | -4.4 | 11 |
| FFM (kg) | 43±11 | 47±5.6 | 0.52** | 0.71*** | -3.6+8.5 (-10.9+20) | -5.2 to -2.1 (-15 to -7.2) | -20 | 13 |
| FM (kg) | 21±7.1 | 18±6.5 | 0.21* | 0.25* | 3.6+8.3 (18.8+50.4) | 2.1 to 5.1 (9.8 to 28) | -13 | 20 |
| Overweight subjects (n=118) | ||||||||
| Bland-Altman | ||||||||
| 95% limits of agreement | ||||||||
| Data analysed | BIS | SFBIA | ICC | r | Biasa (%)b | 95%CI Biasc (%)d | Lower | Upper |
| R (ohm) | 650±78 | 547±102 | 0.01 | 0.02 | 102±128 (18±22) | 79 to 126 (14 to 22) | -148 | 352 |
| Xc (ohm) | 77±9 | 62±8.3 | 0.01 | -0.02 | 15±12 (21±18) | 12 to 17 (18 to 24) | -9.6 | 39 |
| PA (ₒ) | 6.8±0.8 | 6.6±0.9 | 0.01 | 0.01 | 0.2±1.2 (3±18) | -0.03 to 0.4 (-0.4 to 6.3) | -2.2 | 2.6 |
| TBW (L) | 38±7.7 | 37±6 | 0.52** | 0.52** | 0.8±6.8 (1.4±18) | -0.4 to 2.1 (-1.8 to 4.7) | -13 | 14 |
| ECW (L) | 16±2.8 | 17±2.8 | 0.65** | 0.70*** | -0.9±2.2 (-6.1±13) | -1.4 to -0.6 (-8.4 to -3.7) | -5.2 | 3.3 |
| ICW (L) | 22±5.1 | 20±3.5 | 0.30** | 0.34** | 1.8±5.1 (7.4±23) | 0.9 to 2.8 (3.1 to 12) | -8.1 | 12 |
| FFM (kg) | 45±13 | 55±8.9 | 0.31** | 0.46** | -9.5±12 (-21±24) | -12 to -7.4 (-26 to -17) | -32 | 13 |
| FM (kg) | 34±9.2 | 24±5.7 | -0.07* | -0.13* | 9.6±11 (31±41) | 7.5 to 12 (24 to 39) | -13 | 32 |
| Obese subjects (n=108) | ||||||||
| Bland-Altman | ||||||||
| 95% limits of agreement | ||||||||
| Data analysed | BIS | SFBIA | ICC | r | Biasa (%)b | 95% CI Biasc (%)d | Lower | Upper |
| R (ohm) | 596±77 | 482±53 | 0.07 | 0.19 | 114±85 (20.8+14.8) | 98 to 130 (17.9 to 23.6) | -52 | 280 |
| Xc (ohm) | 71±9.3 | 61±6.9 | -0.01 | -0.01 | 9.8±12 (14.5+17.4) | 8 to 12 (11.2 to 17.9) | -13 | 33 |
| PA (ₒ) | 6.8±0.8 | 7.2±0.6 | 0.01 | -0.05 | -0.4±1 (-5.7+15.3) | -0.6 to -0.2 (-8.7 to -2.8) | -2.5 | 1.7 |
| TBW (L) | 42±8.2 | 42±5.4 | 0.70*** | 0.77*** | -0.6±5.4 (-2.4+12.5) | -1.6 to 0.4 (-4.8 to 0.01) | -11 | 9.9 |
| ECW (L) | 18±3.1 | 19±2.9 | 0.79*** | 0.82*** | -0.8±1.9 (-4.5+9.7) | -1.2 to -0.4 (-6.4 to -2.7) | -4.4 | 2.8 |
| ICW (L) | 24±5.3 | 23±2.4 | 0.53** | 0.69** | 0.2±4 (-0.9+16.6) | -0.5 to 1 (-4.1 to 2.3) | -7.6 | 8.1 |
| FFM (kg) | 46±12.9 | 64±8.1 | 0.26* | 0.71*** | -18±9.2 (-36.4+20.5) | -20 to -16 (-40.3 to -32.5) | -36 | -0.5 |
| FM (kg) | 52±11.5 | 33±6.7 | 0.16* | 0.61** | 19±9.1 (43.3+18.7) | 17.2 to 20.7 (39.7 to 46.9) | 1 | 37 |