
Figure 1.
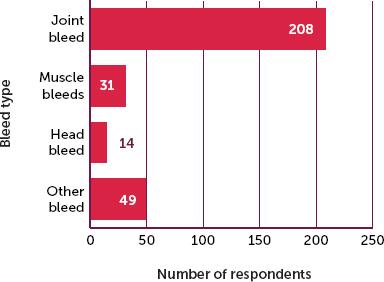
Figure 2.
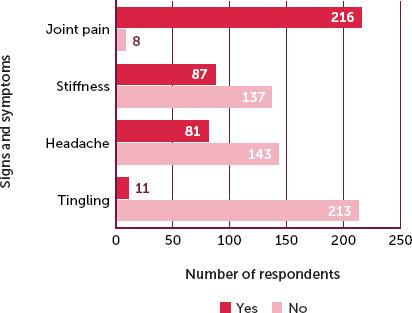
Figure 3.
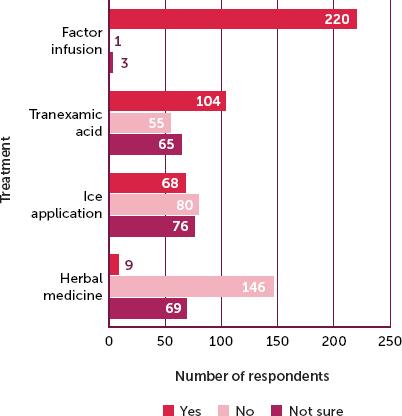
Figure 4.
Multivariable analysis of factors associated with delay in seeking treatment for acute bleeding among people with haemophilia attending haemophilia treatment centres in Uganda
| CHARACTERISTICS | DELAY | NO DELAY | CRUDE PR† | APR† | P-VALUE |
|---|---|---|---|---|---|
| Mode of transportation to HTC | |||||
| Motorcycle | 54 (68.3) | 25 (31.7) | (ref) | (ref) | |
| Private/Family car | 10 (76.9) | 3 (23.1) | 1.13 (0.75-1.69) | 1.17 (0.85-1.58) | 0.331 |
| Public means | 129(97.7) | 3 (2.3) | 1.43 (1.00-2.04) | 1.39 (1.22-1.59) | <0.001 |
| Did you take immediate action on the realisation of a sign of an acute bleed to seek treatment? | |||||
| No | 129(97.0) | 4 (3.0) | (ref) | (ref) | |
| Yes | 64 (70.3) | 27 (29.7) | 0.73 (0.56-0.94) | 0.75 (0.66-0.84) | <0.001* |
Characteristics of people with haemophilia participating in the study (n=224)
| CHARACTERISTICS | FREQUENCY (N) | PERCENTAGE (%) |
|---|---|---|
| Residence | ||
| Rural | 142 | 63.4 |
| Urban | 82 | 36.6 |
| Education | ||
| None | 34 | 15.2 |
| Primary | 135 | 60.3 |
| Secondary and above | 55 | 24.5 |
| Religion | ||
| Anglican/Protestant | 62 | 27.7 |
| Catholic | 92 | 41.1 |
| Muslim | 37 | 16.5 |
| Pentecostal (Born Again) | 23 | 10.3 |
| Seventh Day Adventist | 10 | 4.5 |
| Age | ||
| 1-4 years | 36 | 16.1 |
| 5-13 years | 106 | 47.3 |
| 14-18 years | 38 | 17.0 |
| 19 years and above | 44 | 19.6 |
| Employment | ||
| Child | 22 | 9.8 |
| Student | 40 | 17.9 |
| Formally employed | 35 | 15.6 |
| Self-employed | 76 | 33.9 |
| Unemployed | 51 | 22.8 |
| Average family income per month (UGX) | ||
| 500,001 and above | 11 | 4.9 |
| 300,001-500,000 | 13 | 5.8 |
| 200,001-300,000 | 26 | 11.6 |
| 100,001-200,000 | 30 | 13.4 |
| Less than 100,000 | 144 | 64.3 |
| Time travelling to HTC | ||
| 1 hour | 77 | 34.4 |
| 2 hours | 60 | 26.8 |
| 3 or more hours | 87 | 38.8 |
| Mode of transportation to HTC | ||
| Motorcycle | 78 | 34.8 |
| Private/Family car | 14 | 6.2 |
| Public means (taxi) | 132 | 58.9 |
| Who do you live with? | ||
| Parents/guardian/caregiver | 203 | 90.6 |
| Independent | 21 | 9.4 |
Clinical and health system factors associated with delay in seeking treatment for acute bleeding at a haemophilia treatment centre among people with haemophilia in Uganda (n=193)
| CHARACTERISTICS | PARTICIPANTS N(%) | DELAY CRUDE PR† | P VALUE | ADJUSTED PR† | P VALUE |
|---|---|---|---|---|---|
| Haemophilia type | |||||
| Haemophilia A | 166 (86.5) | (ref) | – | – | – |
| Haemophilia B | 27 (84.4) | 1.15 (0.75-0.47) | 0.75 | – | – |
| Haemophilia severity | |||||
| Mild | 10 (83.3) | (ref) | – | – | |
| Moderate | 60 (81.1) | 1.13 (0.29-4.39) | 0.85 | – | – |
| Severe | 123 (89.1) | 0.65 (0.16-2.52) | 0.53 | – | – |
| Time since haemophilia diagnosis | |||||
| 1 year or less | 36 (75.0) | (ref) | – | – | |
| 2-5 years | 64 (88.9) | 2.25 (0.99-5.10) | 0.05* | – | – |
| >5 years | 93 (89.4) | 0.95 (0.40-2.25) | 0.91 | – | – |
| No. of siblings with haemophilia | |||||
| One | 90 (85.7) | (ref) | – | – | |
| Two-three | 69 (88.5) | 0.80 (0.37-1.75) | 0.58 | – | – |
| Four/more | 34 (82.9) | 1.19 (0.52-2.72) | 0.67 | – | – |
| Siblings lost due to haemophilia | |||||
| Yes | 133 (85.8) | (ref) | – | – | |
| No | 60 (87.0) | 1.01 (0.88-1.17) | 0.85 | – | – |
| Family support | |||||
| Less supportive | 69 (94.5) | (ref) | – | – | |
| Highly supportive | 67 (89.3) | 1.94 (0.61-6.20) | 0.260 | – | – |
| Less supportive | 57 (75.0) | 4.56 (1.62-12.79) | 0.004* | – | – |
| Number of times you experience acute bleeds in a month | |||||
| 0-1 times | 68 (85.0) | (ref) | – | – | |
| 2-3 times | 111 (93.3) | 0.45 (0.18-1.10) | 0.082* | – | – |
| More than 3 times | 14 (56.0) | 2.38 (1.16-4.91) | 0.018* | – | – |
| Time of realising an acute bleeding episode | |||||
| Morning (6am-12pm) | 137 (84.6) | (ref) | – | – | |
| Evening (1pm-6pm) | 39 (86.7) | 0.99 (0.43-2.27) | 0.991 | – | – |
| Night (7pm-5am) | 17 (100.0) | 7.71 (4.00-1.48) | <0.001* | – | – |
| Did you take immediate action on realisation of a sign of an acute bleed to seek treatment? | |||||
| Yes | 64 (97.0) | (ref) | (ref) | ||
| No | 129 (70.3) | 0.10 (0.03-0.28) | <0.001* | 0.75 (0.66-0.84) | <0.001* |
| Opinion of services provided at HTC | |||||
| Fair | 83 (84.7) | (ref) | – | – | |
| Good | 87 (86.1) | 1.11 (0.16-7.39) | 0.912 | – | – |
| Very good | 23 (92.0) | 1.10 ( 0.16-7.42) | 0.915 | – | – |
| Previous waiting time for treatment at HTC | |||||
| 1 hour | 136 (90.1) | (ref) | – | – | |
| 2 hours | 31 (77.5) | 2.26 (1.06-4.79) | 0.033* | – | – |
| 3 or more hours | 26 (78.8) | 2.13 (0.94-4.82) | 0.068* | – | – |
| Attitude of HCPs about care for acute bleeds at HTC | |||||
| Not good | 107 (87.0) | (ref) | – | – | |
| Fairly good | 4 (50.0) | 0.26 (0.11-0.59) | 0.002* | – | – |
| Very good | 82 (88.2) | 0.23 (0.10-0.57) | 0.001* | – | – |
| Do you think haemophilia is curable? | |||||
| No | 181 (86.6) | (ref) | – | – | |
| Yes | 12 (80.0) | 1.49 (0.51-4.35) | 0.464 | – | – |
Bivariate analysis of sociodemographic characteristics associated with delay in seeking of treatment for acute bleeding at a haemophilia treatment centre among people with haemophilia in Uganda (n=193)
| CHARACTERISTIC | DELAYED (N=193) N (%) | CRUDE PR (95%CI) | P-VALUE | ADJUSTED PR (95%CI) | P-VALUE |
|---|---|---|---|---|---|
| Place of residence | |||||
| Rural | 121 (85.2) | (ref) | – | – | |
| Urban | 72 (87.8) | 0.82 (0.40-1.66) | 0.591 | – | – |
| Level of education | |||||
| Tertiary | 31 (91.2) | (ref) | – | – | |
| Primary | 111 (82.2) | 2.01 (0.64-6.31) | 0.22 | – | – |
| Secondary | 31 (88.6) | 1.29 (0.31-5.37) | 0.72 | – | – |
| None | 20 (100.0) | 4.48 (1.39-1.44) | 0.000* | – | – |
| Religion | |||||
| Anglican/Protestant | 53 (85.5) | (ref) | – | – | |
| Catholic | 78 (84.8) | 1.04 (0.48-2.27) | 0.905 | – | – |
| Muslim | 32 (86.5) | 0.9 (0.33-2.57) | 0.89 | – | – |
| Pentecostal (Born Again) | 20 (87.0) | 0.89 (0.26-3.03) | 0.86 | – | – |
| Seventh Day Adventist | 10 (100.0) | 3.96 (1.66-9.43) | 0.000* | – | – |
| Age | |||||
| 1-4 years | 30 (83.3) | (ref) | – | – | |
| 5-13 years | 93 (87.7) | 0.73 (0.30-1.79) | 0.50 | – | – |
| 14-18 years | 29 (76.3) | 1.42 (0.56-3.59) | 0.45 | – | – |
| 19 & above | 41 (93.2) | 0.41 (0.11-1.53) | 0.18 | – | – |
| Employment status | |||||
| Child | 20 (10.36) | (ref) | – | – | |
| Formally employed | 29 (15.03) | 1.88 (0.41-8.55) | 0.41 | – | – |
| Self-employed | 70 (36.27) | 0.86 (0.18-4.01) | 0.85 | – | – |
| Student | 31 (16.06) | 2.47 (0.58-10.49) | 0.21 | – | – |
| Unemployed | 43 (22.28) | 1.72 (0.64-1.10) | 0.46 | – | – |
| Average family income per month (UGX) | |||||
| 500,001 and more | 23 (76.7) | (ref) | – | – | |
| 300,001-500,000 | 25 (96.1) | 0.28 (0.03-2.35) | 0.24 | – | – |
| 200,001-300,000 | 12 (92.3) | 0.14 (0.01-1.21) | 0.07 | – | – |
| 100,001-200,000 | 8 (72.7) | 0.85 (0.26-2.74) | 0.79 | – | – |
| Less than 100,000 | 125 (86.8) | 0.48 (0.16-1.38) | 0.17 | – | – |
| Mode of transportation to HTC | |||||
| Motor cycle | 54 (68.3) | (ref) | (ref) | ||
| Private/Family car | 10 (76.9) | 0.56 (0.15-2.06) | 0.390 | 1.17 (0.85-1.58) | 0.331 |
| Public means | 129 (97.7) | 0.70 (0.02-0.22) | <0.001* | 1.39 (1.22-1.59) | <0.001 |
| Who do you live with? | |||||
| Parent/Guardian | 173 (85.2) | (ref) | – | – | |
| Independent | 20 (95.2) | 0.32 (0.04-2.25) | 0.25 | – | – |