Figure 1.
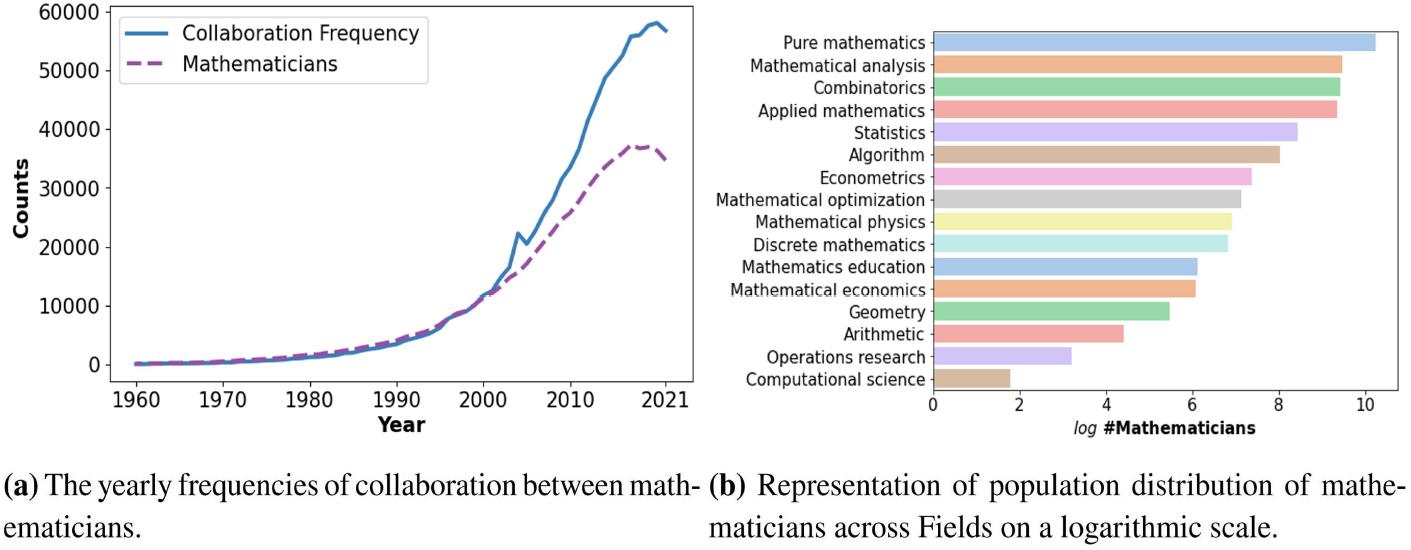
Figure 2.
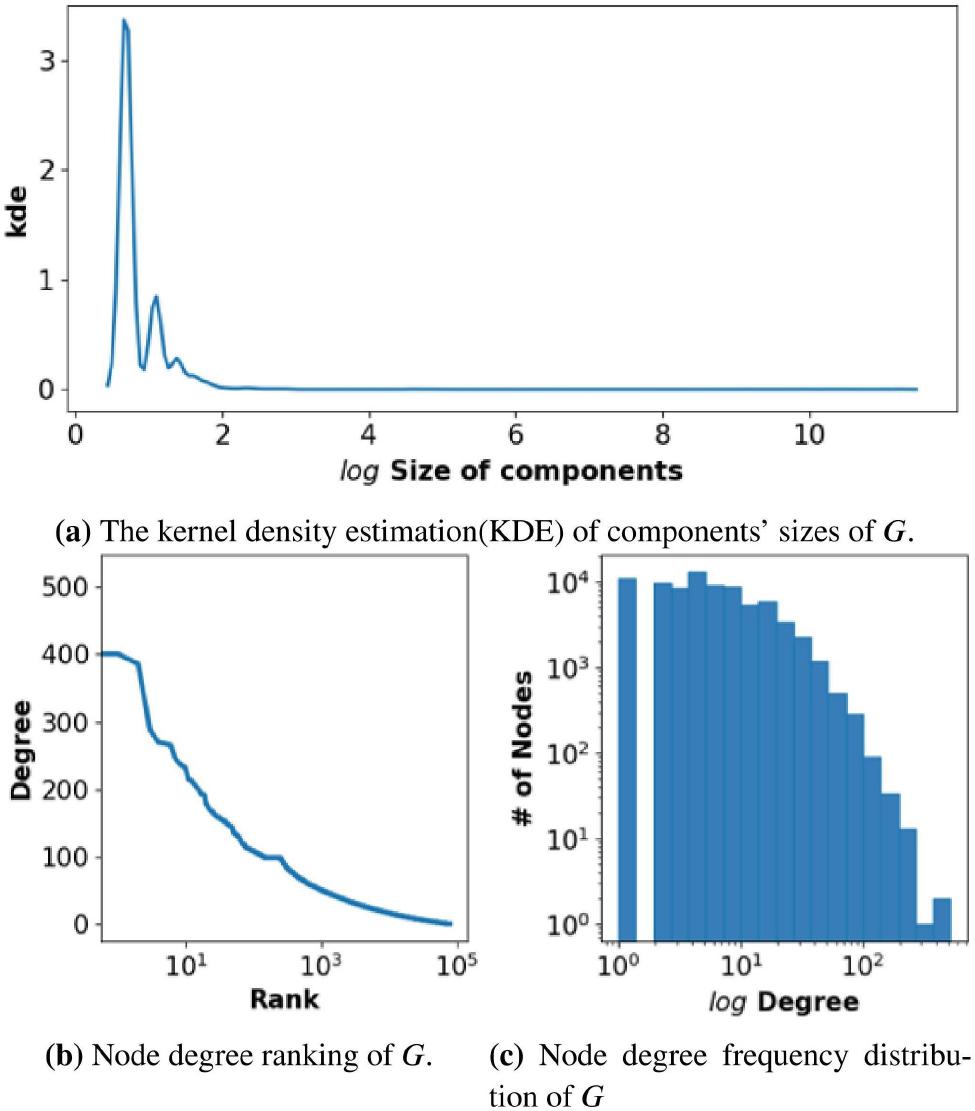
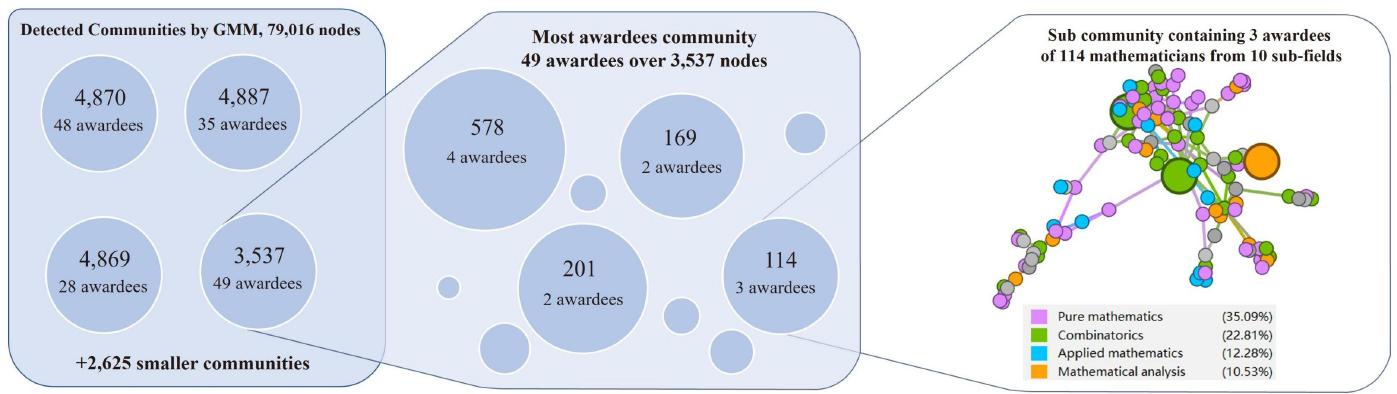
Figure 3.
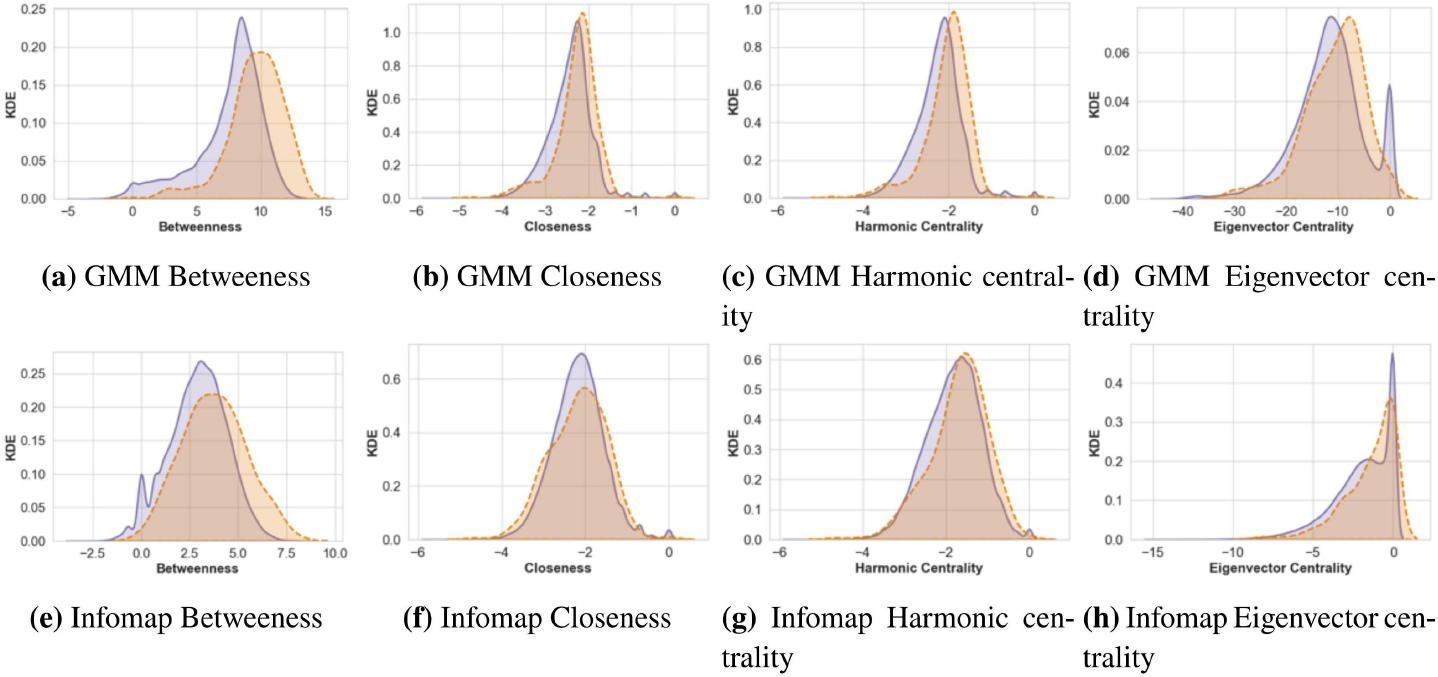
Figure 4.
Algorithm 1
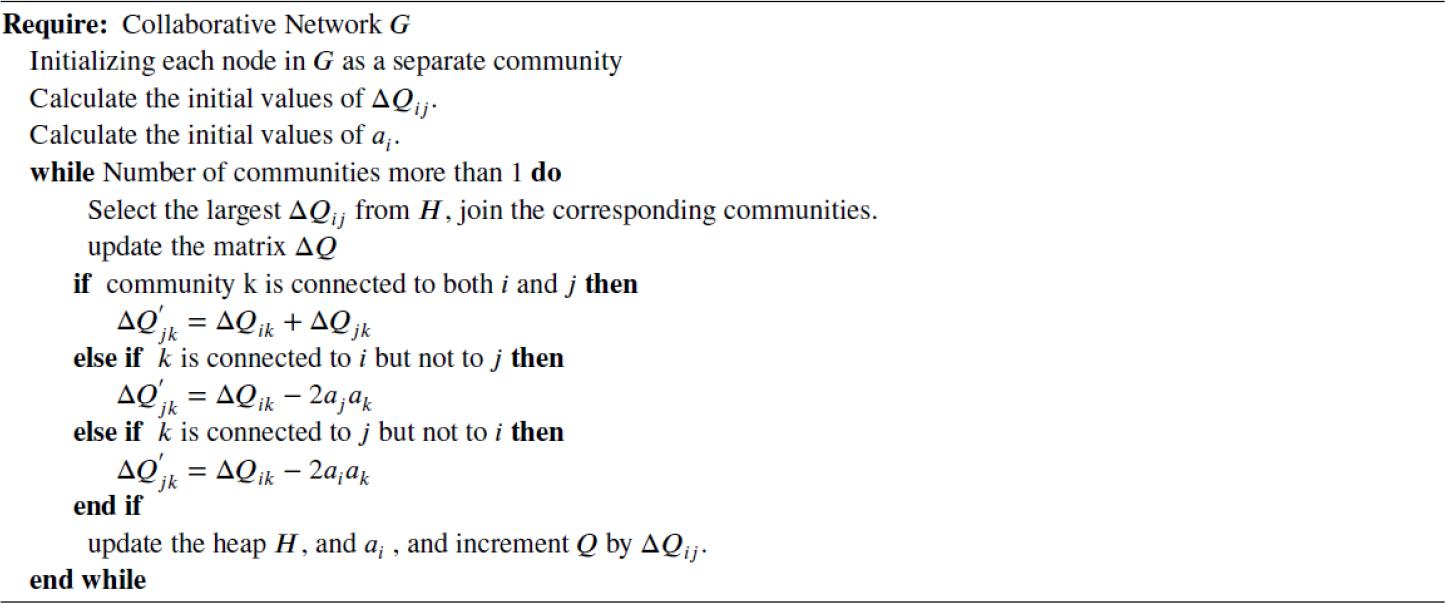
Figure A1.
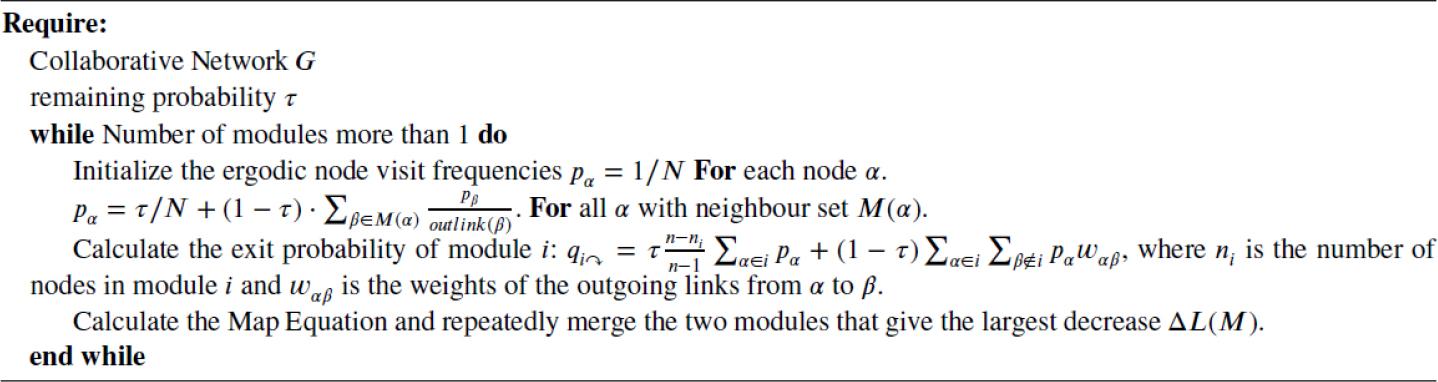
Algorithm 2
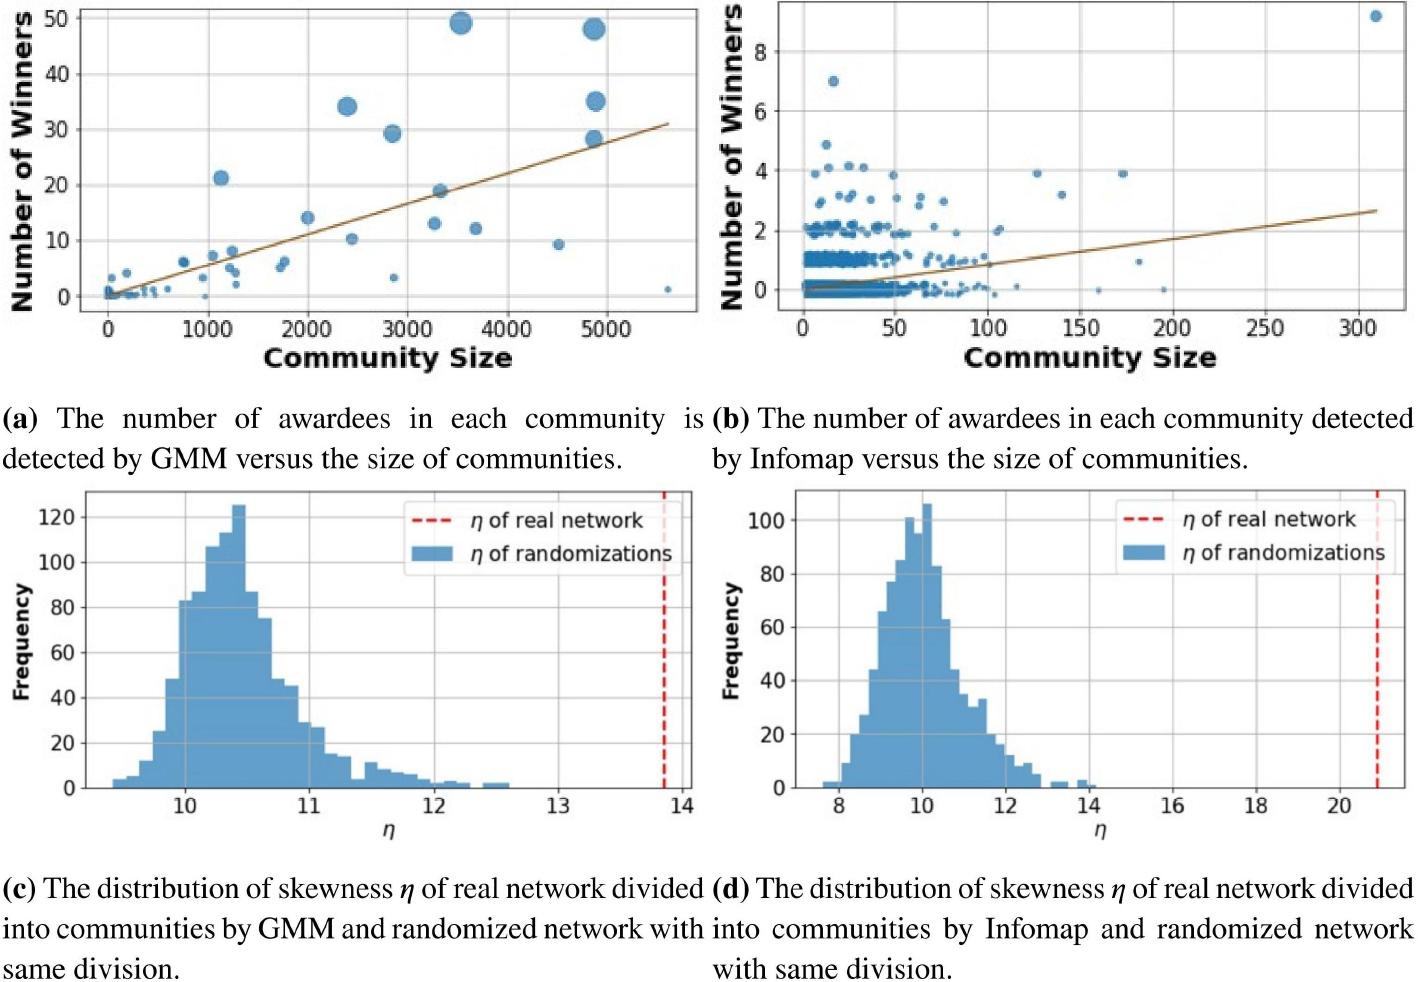
Linear regression analysis on the number of awardees_
| Algorithm | #awardees | |
|---|---|---|
| GMM | Infomap | |
| Community size | 0.0056*** | 0.0092*** |
| Simpson index | -0.1075* | -0.0339*** |
The basic characteristics of mathematicians’ collaborative networks_
| N | L | 〈k〉 | lnN | 〈C〉 | density |
|---|---|---|---|---|---|
| 79,016 | 342,022 | 8.657 | 11.2774 | 0.1972 | 0.0001 |
NMI analysis between true field labels and detected community labels_
| Method | GMM | Infomap |
|---|---|---|
| Real NMI | 0.2222 | 0.2404 |
| Random NMI | (0.03361, 0.03365) | (0.08247, 0.08250) |
The t-test of the difference of centrality metrics between awardees and other mathematicians_
| Betweenness | Closeness | Harmonic centrality | Eigenvector centrality | |
|---|---|---|---|---|
| GMM | 47,777.2381*** | 0.0141*** | 0.0245*** | -0.0455*** |
| Infomap | 96.5236*** | 0.0053 | 0.0323*** | 0.1148*** |