
Despite important advancements in diagnostic methods, treatment, and follow-up, coronary artery disease remains a multifaceted pathology that requires understanding multiple pathophysiological mechanisms, for which no standardized treatment exists.1–8 Coronary angiography represents the gold standard for evaluating atherosclerotic disease and is the main diagnostic method used to indicate the need for revascularization. However, it has several drawbacks. Quantifying the severity of an atherosclerotic lesion by invasive coronary angiography may be subjective and operator-dependent. In addition, moderate stenoses may in fact be hemodynamically significant, whereas apparently severe angiographic stenoses may prove to be without hemodynamic significance.
The need for additional tools has therefore emerged, allowing cardiologists to better determine which coronary lesions should be treated conservatively and which require revascularization (interventional or surgical).9 Unfortunately, both imaging-based methods such as optical coherence tomography (OCT) and hemodynamic assessment with fractional flow reserve (FFR) for evaluating the severity of coronary artery disease present several drawbacks. OCT requires multiple administrations of contrast media, increasing the risk of contrast-induced nephropathy, prolonging the procedure time, and exposing both the patient and medical personnel to higher radiation doses. FFR, on the other hand, requires the administration of adenosine (intravenous or intracoronary).
Several studies have investigated the correlation between minimal luminal area (MLA) measured by OCT and FFR in patients with coronary artery disease and chronic coronary syndromes.10–12 These studies aimed to establish a relationship between the anatomical and physiological assessments of coronary lesions. Positive correlations between MLA and FFR suggest that lesions with a smaller luminal area on OCT may indeed be functionally significant.
Understanding the correlation between OCT-derived MLA and FFR has important clinical and interventional implications. Combining anatomical information from OCT with physiological data from FFR can enhance the accuracy of lesion assessment. This integrated approach assists interventional cardiologists in making informed decisions regarding the need for revascularization procedures, thereby optimizing patient care and outcomes.
The aim of this study was to examine a population of patients with acute myocardial infarction and evaluate the ability of OCT to differentiate the hemodynamic significance of intermediate lesions, with the possibility of achieving complete revascularization during the index hospitalization without the need for FFR assessment. Establishing a clear OCT parameter cut-off for each coronary vessel may translate into shorter hospitalization, reduced costs, and improved patient outcomes.
All patients presented with acute ST-elevation myocardial infarction (STEMI) or non-ST-elevation myocardial infarction (NSTEMI) and were treated according to the latest European guidelines.7,9,13 During the index procedure, the culprit lesion was revascularized, and the presence of intermediate stenoses in non-culprit vessels was assessed. Patients who met the following criteria were included: recent acute myocardial infarction; an intermediate coronary lesion in a non-culprit vessel defined as 30–80% stenosis on angiography (visual estimation or quantitative coronary angiography); absence of left main or distal/small side branch lesions; and an ejection fraction greater than 30%. Clinical characteristics were collected from medical charts, and all patients provided written informed consent before the first and second coronary catheterizations. A total of 114 patients and 151 lesions were selected for analysis.
All patients included in the analysis were Caucasian. The mean patient age was 60 ± 10 years. Baseline demographic, FFR, OCT, and angiographic characteristics are presented in Table 1. In 65 of the 151 lesions (43.04%), FFR was ≤0.80, and coronary angioplasty was performed accordingly. Drug-eluting stents were used in 100% of patients selected for revascularization.
Demographics, FFR, OCT and angiographic findings
| n | Min | Max | Mean | s.d. | FFR ≤ 0.8 | s.d. | FFR > 0.8 | s.d. | p value | |
|---|---|---|---|---|---|---|---|---|---|---|
| FFR | 151 | 0.41 | 0.98 | 0.81 | 0.10 | 0.72 | 0.07 | 0.88 | 0.04 | <0.001 |
| Age | 151 | 36.00 | 81.00 | 60.41 | 10.42 | 61.00 | 10.19 | 59.97 | 10.63 | 0.55 |
| OCT proximal area | 151 | 2.83 | 20.56 | 8.84 | 3.04 | 8.45 | 2.95 | 9.13 | 3.09 | 0.17 |
| OCT distal area | 151 | 1.79 | 18.38 | 6.79 | 2.77 | 6.23 | 2.66 | 7.22 | 2.80 | 0.03 |
| Average area | 151 | 2.68 | 19.47 | 7.82 | 2.55 | 7.34 | 2.37 | 8.17 | 2.64 | 0.04 |
| Lesion length | 151 | 6.20 | 65.60 | 31.33 | 13.20 | 35.55 | 14.52 | 28.14 | 11.18 | 0.001 |
| MLA | 151 | 0.75 | 5.51 | 2.21 | 1.06 | 1.61 | 0.62 | 2.67 | 1.09 | <0.001 |
| %AS average reference | 21.51 | 92.00 | 70.97 | 11.80 | 76.97 | 8.04 | 66.44 | 12.19 | <0.001 | |
| Proximal reference diameter | 1.90 | 5.11 | 3.27 | 0.57 | 1.25 | 0.28 | 1.59 | 0.36 | <0.001 | |
| Distal reference diameter | 1.51 | 4.84 | 2.86 | 0.58 | 2.76 | 0.56 | 2.98 | 0.58 | 0.02 | |
| Average reference diameter | 1.84 | 4.97 | 3.08 | 0.50 | 3.00 | 0.48 | 3.17 | 0.51 | 0.03 | |
| Minimum diameter | 151 | 0.84 | 2.53 | 1.44 | 0.37 | 1.25 | 0.28 | 1.59 | 0.36 | <0.001 |
| %Diameter stenosis (vs. average reference diameter) | 26.18 | 83.69 | 46.78 | 10.19 | 50.35 | 10.17 | 42.05 | 8.15 | <0.001 | |
| FFR ≤ 0.8 | 65 | 43% | 65 | 86 | ||||||
| Vessel | LAD | 80 | 53.30% | 47 (72.3%) | 33 (38.4%) | <0.001 | ||||
| RCA | 38 | 25.30% | ||||||||
| LCX | 33 | 21.85% | ||||||||
| Male | 127 | 84.10% | 56 (86.2%) | 71 (82.6%) | 0.55 | |||||
| Smoker | 46 | 30.50% | 23 (35.4%) | 23 (26.7%) | 0.253 | |||||
| Hypertension | 116 | 76.80% | 45 (69.2%) | 71 (82.6%) | 0.055 | |||||
| Dyslipidemia | 121 | 80310% | 50 (76.9%) | 71 (82.6%) | 0.341 | |||||
| Diabetes mellitus | 47 | 31.10% | 20 (30.8%) | 27 (31.4%) | 0.93 |
After the diagnosis of STEMI or NSTEMI, coronary angiography was performed. In patients with very high-risk NSTEMI, coronary angiography was performed within 2 h of presentation, whereas in high-risk patients it was performed within the first 24 h.
The culprit lesion was treated at the operator’s discretion, and patients with intermediate stenoses in non-culprit vessels were selected for inclusion in the study. A second coronary angiography was performed between days 3 and 5 of the index hospitalization. OCT was performed at the culprit lesion, with image acquisition starting 20 mm proximal to the implanted stent and extending up to 20 mm distal to the stent. Stent expansion, areas of malposition (Figure 2), proximal or distal dissections, plaque protrusion, and thrombotic masses were assessed by OCT. Supplementary post-dilatation was performed when considered necessary by the operator in cases of severe underexpansion or malposition,14 followed by final OCT reevaluation.
The non-culprit vessel(s) with intermediate stenoses (estimated visually or by quantitative coronary angiography) were assessed by FFR using intracoronary administration of adenosine in varying doses, with the aim of obtaining an ECG response or a clear separation of the Pd/Pa curves. Regardless of the FFR result, OCT was performed, with multiple measurements obtained at the level of the atherosclerotic plaque. In cases with FFR <0.80, myocardial revascularization was performed by implantation of one or more stents, followed by OCT and FFR reevaluation. Additional post-dilatation or stent implantation was performed based on OCT findings at the operator’s discretion. After each post-dilatation or stent implantation, OCT was considered a mandatory step to ensure an optimal final result. The following final OCT targets were pursued: malposition <400 μm, stent expansion >90% of the distal reference lumen area, and absence of proximal or distal edge dissections.
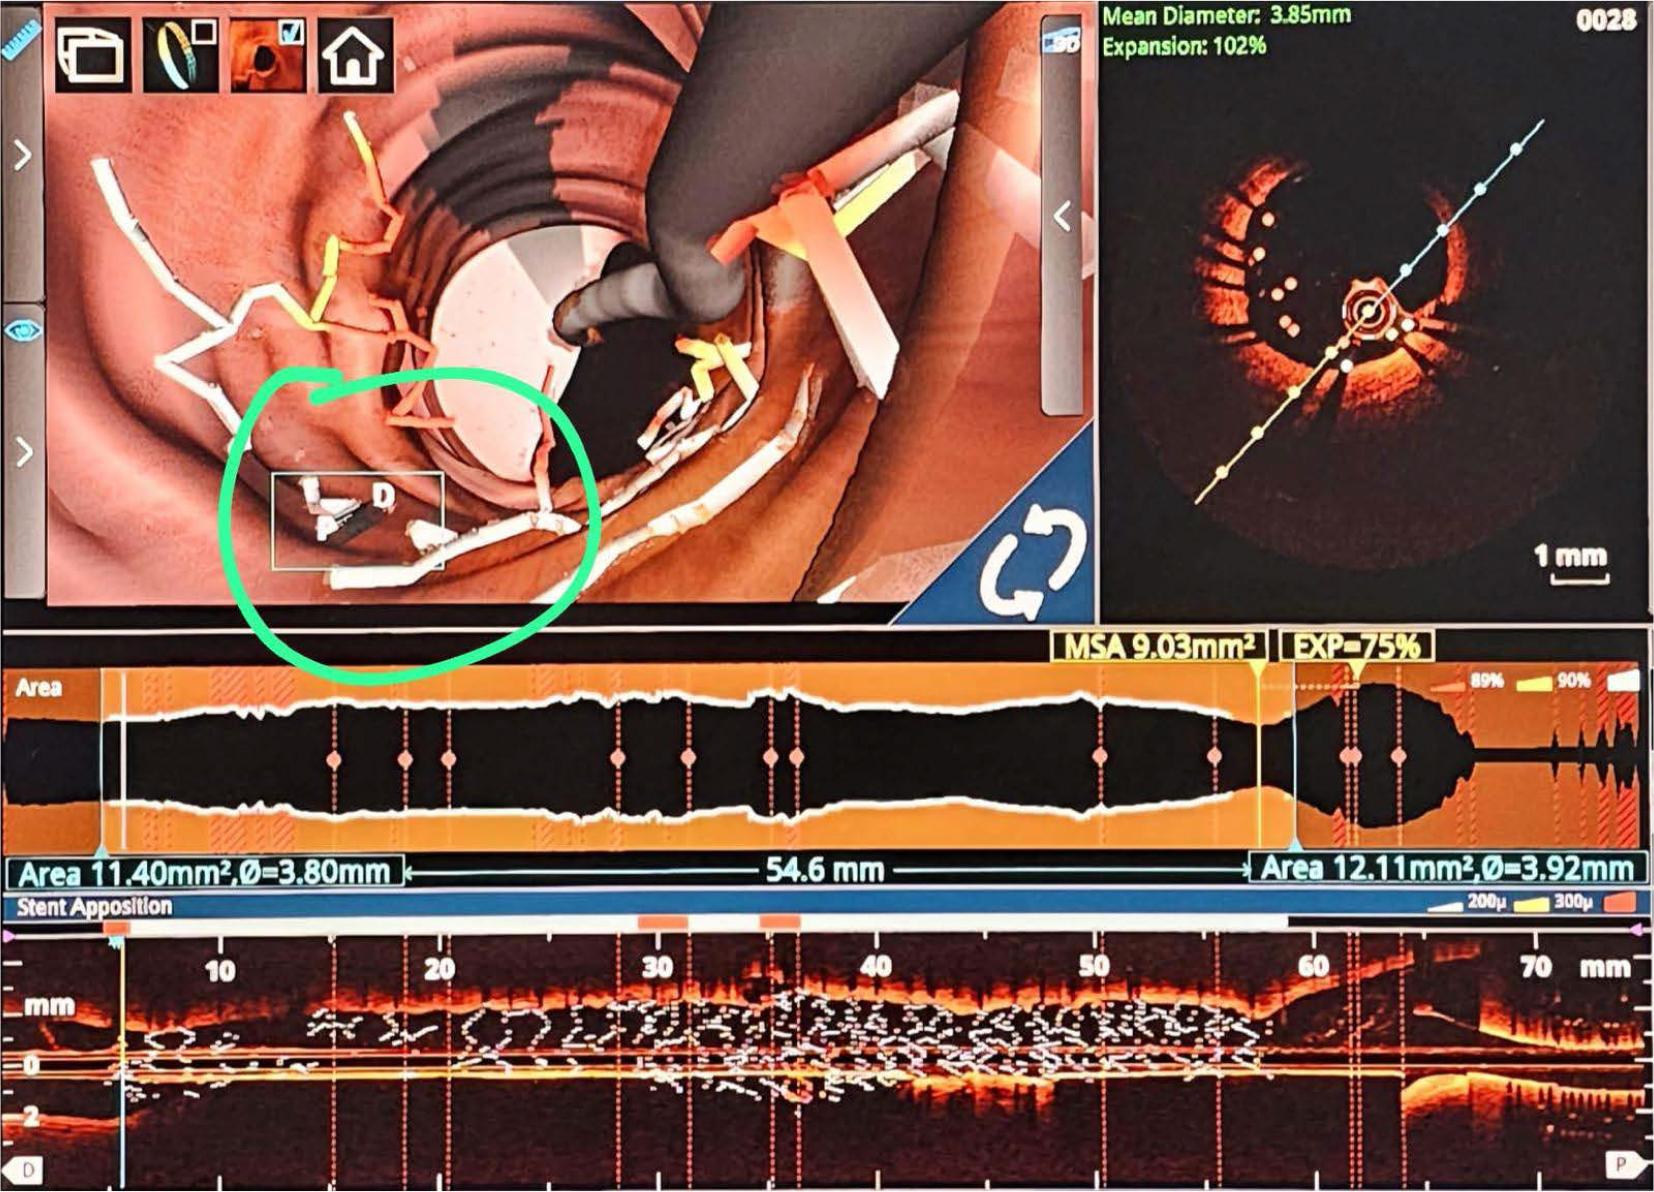
OCT with 3D reconstruction. Severe malposition of the stent requiring 1:1 noncompliant balloon post dilatation.
For the FFR analysis, we used the PressureWire X guidewire (Abbott). After engaging the coronary ostium while avoiding aggressive cannulation, the FFR guidewire was advanced into the vessel proximal to the lesion. The wire was then zeroed and pressure equalization was performed, followed by advancement of the pressure wire distal to the lesion. FFR was performed using intracoronary administration of adenosine in varying doses (50/100/150/200/250/300 μg), depending on the interrogated vessel, aiming to obtain either an ECG response or a clear separation of the Pd/Pa curves. The cut-off value for FFR was 0.80.
OCT was performed in all patients using a St. Jude OCT console system and a Dragonfly OPTIS catheter (Abbott Cardiovascular). The non-culprit vessels with intermediate lesions were analyzed after FFR assessment, and numerous OCT parameters were recorded in a comprehensive database. For the analysis, we extracted the MLA, the length of the atherosclerotic plaque, and the proximal and distal reference luminal areas (Ras), as well as the minimal luminal diameter. MLA was defined as the cross-section with the smallest luminal area.8 The proximal and distal luminal areas were defined as the cross-sections where the plaque begins and ends, with measurements performed at sites where OCT showed a normal or near-normal aspect of the coronary wall.8 The RA was calculated as the average of the proximal and distal luminal areas.8 Percent luminal area stenosis (PAS) was calculated as the difference between the RA and the MLA, divided by RA.
Statistical analysis was performed using SPSS v.26.0 (SPSS). Data analysis was performed on a per-lesion basis. To determine the cut-off values for MLA and PAS in predicting an FFR value ≤0.80, we used the Youden method based on receiver operating characteristic (ROC) curve analysis. Area under the ROC curve (AUC) values and their 95% confidence intervals (CIs) were calculated. Sensitivity, specificity, and accuracy were calculated using the determined cut-off values for MLA and PAS.
To compare the statistical significance of PAS and MLA, a surrogate parameter was used, the remaining luminal area (RMA), defined as the difference between the RA and the MLA.
Binary logistic regression was used to evaluate the independent predictors of an FFR value ≤0.80. The Nagelkerke R2 coefficient and the overall percentage of correctly classified cases were used to select the best logistic regression model.
Data analysis was performed in a structured manner. First, the correlation between MLA and FFR was analyzed. Figure 2 shows the ROC curve for OCT-derived MLA in predicting FFR <0.80.
AUC analysis showed a significant correlation between the MLA value and the proportion of positive FFR results. An AUC value of 0.810 (95% CI 0.741–0.879) indicated good discriminatory capacity. Based on the ROC curve, the best cut-off value for the MLA was 2.08 mm2, with a sensitivity of 83.08%, specificity of 68.60%, and accuracy of 74.80% (Figure 2).
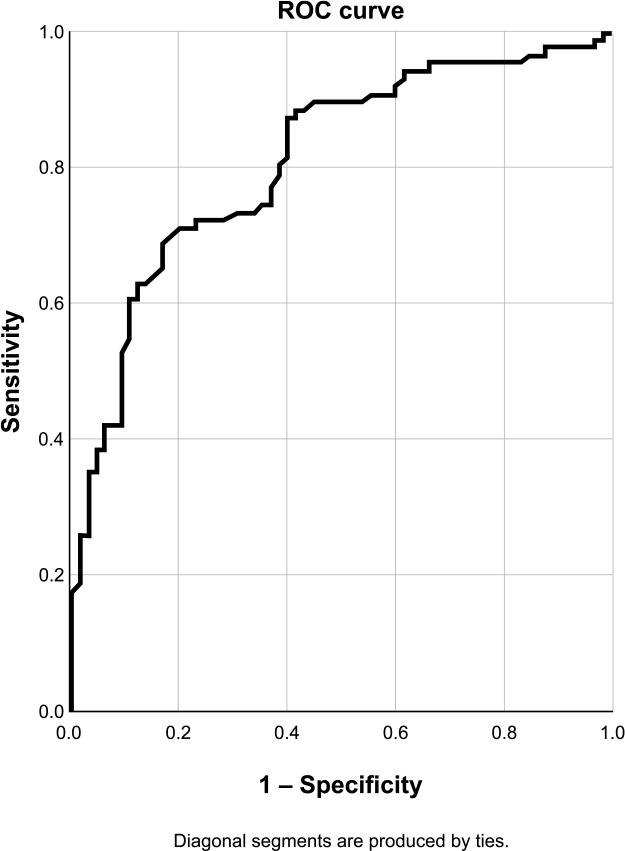
ROC curve for OCT-derived MLA to predict FFR < 0.8. Sensibility 83.1%, specificity 68.6%, accuracy 74.8%.
| AUC, | |||
|---|---|---|---|
| Area | Std. Errora | Asymptotic Sig.b | Asymptotic 95% CI |
| 0.810 | 0.035 | 0.000 | 0.741–0.879 |
| AUC | |||
|---|---|---|---|
| Area | Std. Errora | Asymptotic Sig.b | Asymptotic 95% CI |
| 0.761 | 0.039 | 0.000 | 0.685–0.836 |
| AUC | |||
|---|---|---|---|
| Area | Std. Errora | P | Asymptotic 95% CI |
| 0.835 | 0.045 | 0.000 | 0.747–0.922 |
| Area under the ROC curve | ||||
|---|---|---|---|---|
| Test result variable(s) | Area | Std. Errora | Asymptotic Sig.b | Asymptotic 95% CI |
| %RMA | 0.761 | 0.039 | 0.000 | 0.685–0.837 |
| MLA x | 0.810 | 0.035 | 0.000 | 0.741–0.879 |
| Paired-sample area difference under the ROC curves | |||||
|---|---|---|---|---|---|
| Test result pair(s) | Asymptotic | AUC difference | Std. error difference | Asymptotic 95% CI | |
| RMA | -1.572 | 0.116 | -0.049 | 0.269 | -0.111–0.012 |
| MLA x | |||||
A similar analysis (Figure 3) showed a good correlation between PAS and FFR values, with a cut-off value of 76.85%, which corresponds to a diameter stenosis of approximately 50%.
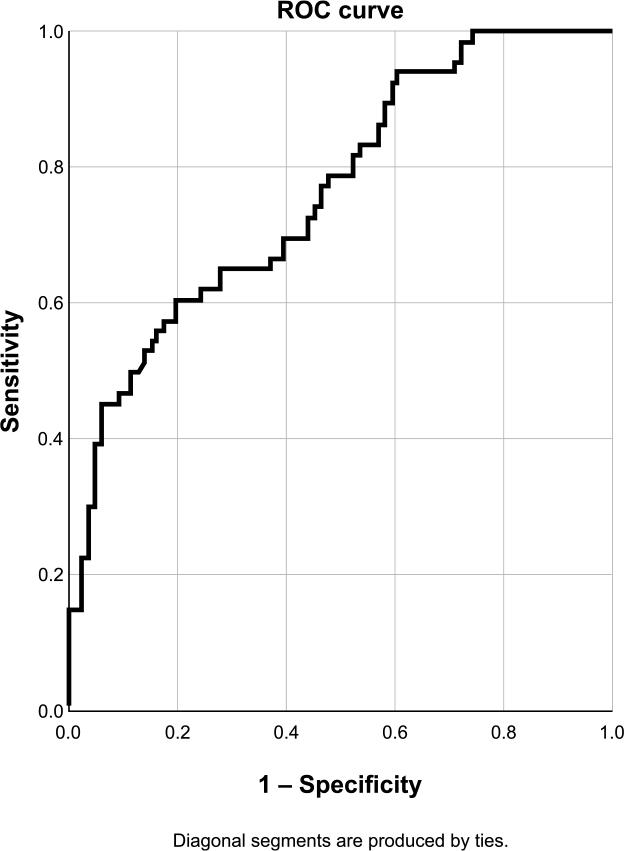
ROC curve for PAS to predict FFR < 0.8. Sensibility 60.0%, specificity 80.2%, accuracy 71.5%.
A comparative analysis of PAS and MLA for predicting an ischemic FFR threshold was also performed (Figure 4). When comparing the two methods, no significant differences were found between MLA and PAS in predicting an FFR value < 0.80 (p > 0.05).
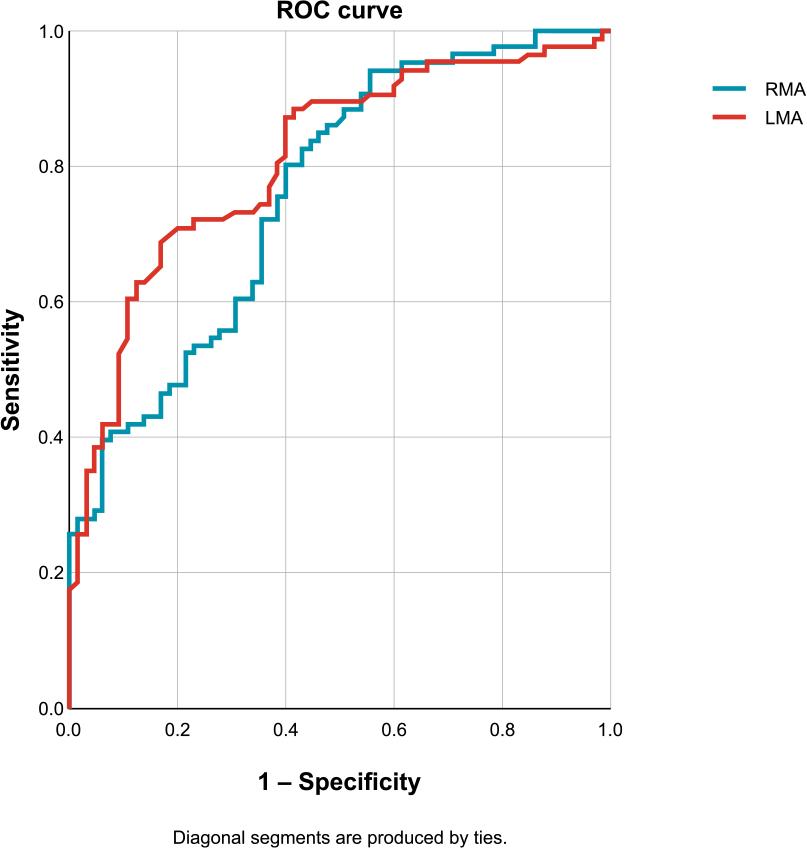
Comparative analysis of RMA and LMA.
An important part of the analysis was the correlation between OCT-derived parameters and FFR values for each coronary territory in order to determine whether significant differences exist. Of the 151 lesions included in the analysis, 80 were located in the left anterior descending artery (LAD), 33 in the circumflex artery (CX), and 44 in the right coronary artery (RCA).
| AUC | |||
|---|---|---|---|
| Area | Std. Errora | Asymptotic Sig.b | Asymptotic 95% CI |
| 0.752 | 0.055 | 0.000 | 0.644–0.861 |
| AUC | |||
|---|---|---|---|
| Area | Std. Errora | Asymptotic Sig.b | Asymptotic 95% CI |
| 0.926 | 0.052 | 0.000 | 0.823–1.000 |
| AUC | |||
|---|---|---|---|
| Area | Std. Errora | Asymptotic Sig.b | Asymptotic 95% CI |
| 0.916 | 0.046 | 0.000 | 0.826–1.000 |
| AUC | |||
|---|---|---|---|
| Area | Std. Errora | Asymptotic Sig.b | Asymptotic 95% CI |
| 0.866 | 0.069 | 0.004 | 0.731–1.000 |
| AUC | |||
|---|---|---|---|
| Area | Std. Errora | Asymptotic Sig.b | Asymptotic 95% CI |
| 0.823 | 0.094 | 0.010 | 0.638–1.000 |
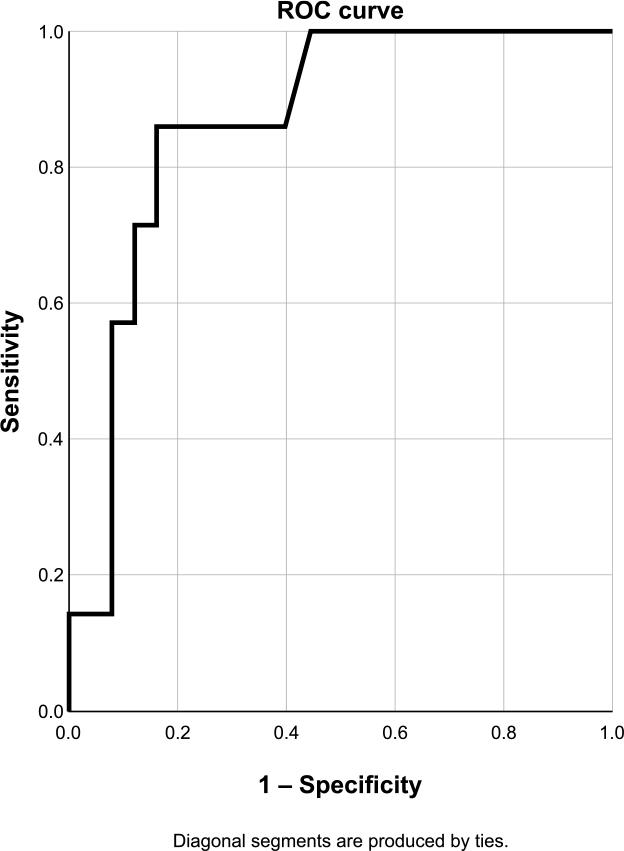
For the LAD (Figures 5 and 6), a cut-off value for MLA of 2.23 mm2 and for PAS of 65.3% were obtained.
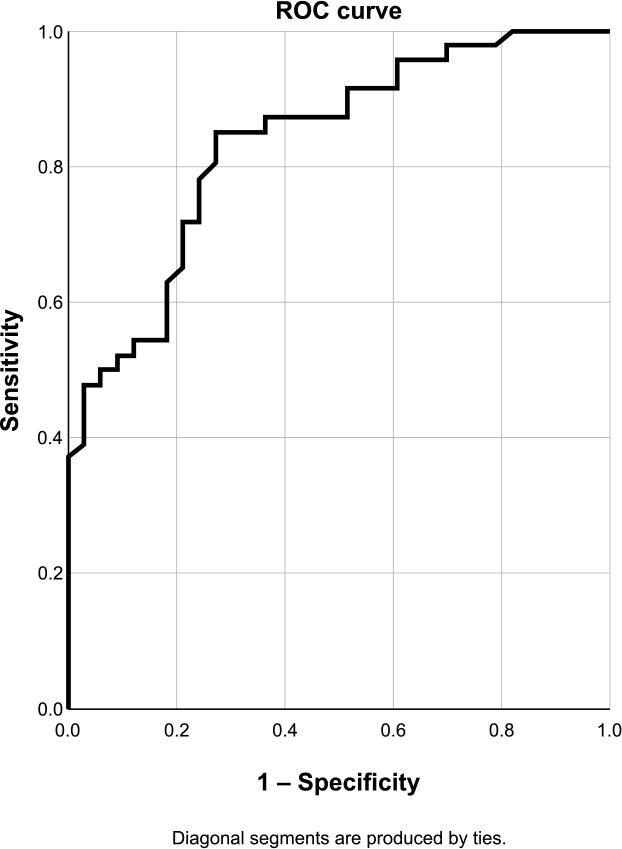
ROC curve for MLA in the LAD. Sensibility 78.3%, specificity 75.8%, accuracy 77.2%.
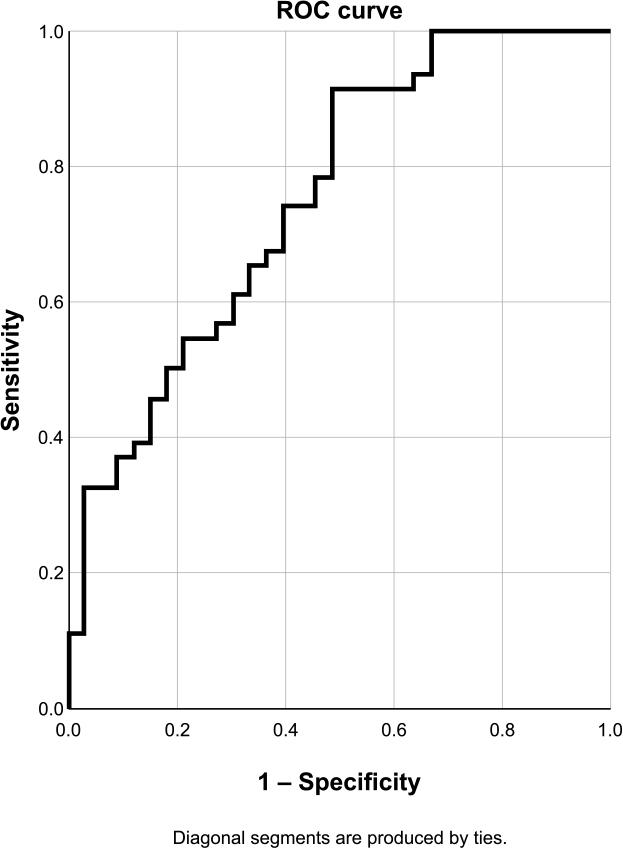
ROC curve for PAS in the LAD. Sensibility 91.3%, specificity 51.5%, accuracy 74.7%.
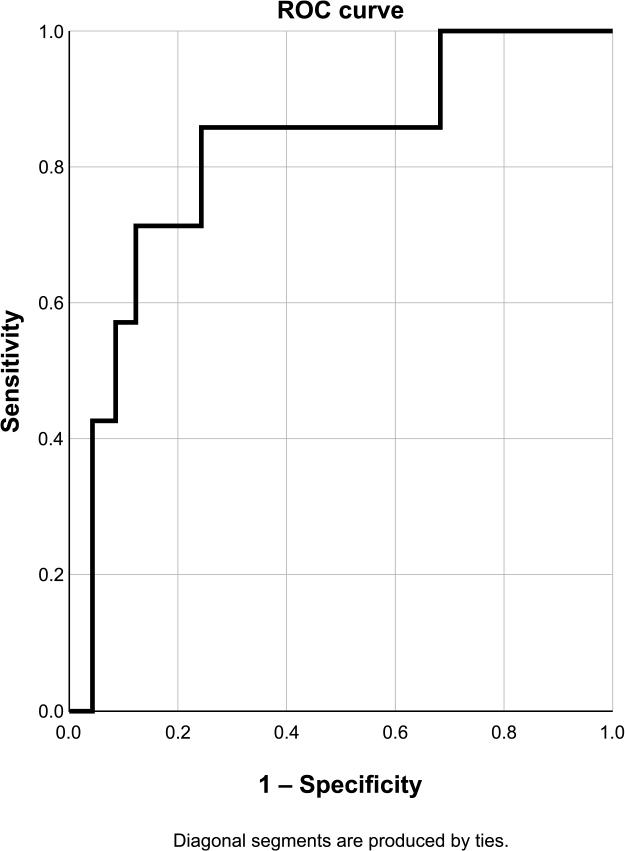
For the RCA, the cut-off value for MLA was 2.28 mm2, with a higher AUC than that observed for the LAD (Figure 7). For PAS (Figure 8), the cut-off value was 78.5%, with low specificity (33.3%) and accuracy (52.6%).
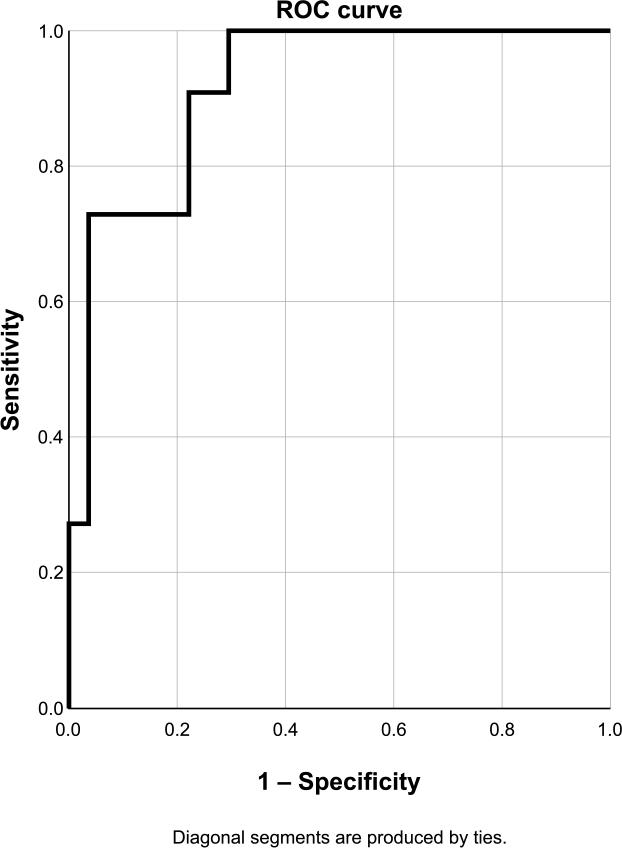
ROC curve for MLA in the RCA. Sensibility 90.1%, specificity 77.8%, accuracy 81.6%.
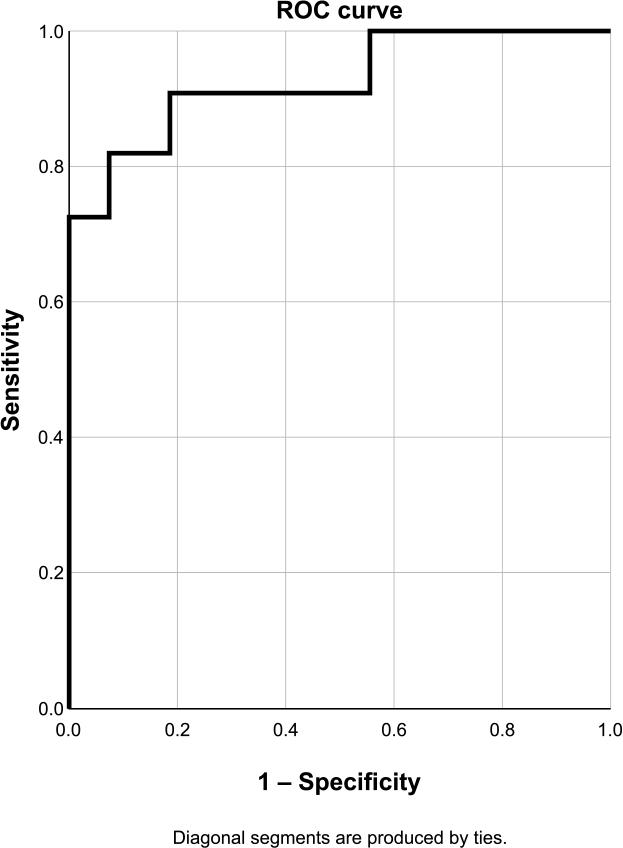
ROC curve for PAS in the RCA. Sensibility 100.0%, specificity 33.3%, accuracy 52.6%.
For the CX, an MLA cut-off value of 1.16 mm2 was obtained, with very high sensitivity (100%) but low specificity (48%) and accuracy (59.4%) (Figure 9). A cut-off value of 76.2% was obtained for PAS (Figure 10).
ROC curve for MLA in the CX. Sensibility 100.0%, specificity 48.0%, accuracy 59.4%.
ROC curve for PAS in the CX. Sensibility 85.7%, specificity 76.0%, accuracy 78.1%.
When comparing the average lesion length between FFR-positive and FFR-negative stenoses, the analysis showed that FFR-positive lesions were longer (35.55 ± 14.52 mm) than FFR-negative lesions (28.14 ± 11.18 mm) (p = 0.001). Based on the ROC curve for the relationship between lesion length and positive FFR, with an AUC of 0.641 (95% CI 0.562–0.741; p = 0.001), a cut-off value of 31 mm was obtained.
Univariate analysis showed that ischemic FFR lesions were more frequently located in the LAD and were associated with lower MLA, longer lesion length, and a higher degree of PAS. However, only some of these variables remained independent predictors in the multivariable analysis (Table 2).
Univariate predictors for FFR ≤ 0.8
| B | p value | Exp(B) (95% CI) | |
|---|---|---|---|
| LAD location | 1.434 | 0.000 | 4.19 (2.09-8.41) |
| OCT proximal reference area | 0.077 | 0.173 | 0.93 (0.83-1.03 |
| OCT distal reference area | 0.140 | 0.034 | 0.87 (0.76-0.99) |
| Average reference area | 0.138 | 0.050 | 0.87 (0.76-1) |
| Lesion length | 0.045 | 0.001 | 1.05 (1.02-1.07 |
| MLA | 1.538 | 0.000 | 0.21 (0.12-0.38) |
| PAS vs. RA | 0.110 | 0.000 | 1.12 (1.07-1.17) |
| PAS vs. proximal reference | 0.103 | 0.000 | 1.11 (1.06-1.16) |
| PAS vs. distal reference | 0.071 | 0.000 | 1.07 (1.04-1.11) |
The best multivariable logistic model included four variables: MLA, LAD location, lesion length, and OCTderived distal reference area (Table 3). This model showed the best performance, correctly classifying 83.4% of lesions and demonstrating a Nagelkerke R2 coefficient of 0.573. Adding PAS to the MLA regression model did not provide significant independent predictive power. Only PAS based on the distal reference area proved to be independently correlated with FFR ≤0.80; however, the overall model was slightly outperformed by the model including the distal reference area, as reflected by a higher Nagelkerke R2 coefficient (0.573 vs. 0.568).
Multivariate predictors for FFR ≤ 0.8
| B | Wald | p value | Exp(B) (95% CI) | |
|---|---|---|---|---|
| MLA | -2.317 | 27.369 | 0.000 | 0.099 (0.041 - 0.235) |
| LAD location | 2.345 | 20.161 | 0.000 | 10.434 (3.749 – 29.04) |
| Lesion length | 0.045 | 6.361 | 0.012 | 1.046 (1.01 – 1.084) |
| OCT distal reference area | 0.241 | 5.215 | 0.022 | 1.273 (1.035 – 1.566) |
Based on our model, combining MLA and PAS did not add incremental value for predicting an FFR value ≤0.80 compared with using the individual parameters.
The therapeutic management of non-critical (intermediate) coronary lesions remains a challenge. FFR remains the gold standard for assessing the severity of coronary stenosis.
Although multiple studies have addressed the possible correlation between OCT and FFR, there are insufficient data to establish a standardized value that can be universally applied to the heterogeneous population encountered in daily clinical practice. All patients included in our study presented with acute myocardial infarction. The present analysis has several findings that are in line with previously reported data.
There is a wide range of OCT parameter values that may correlate strongly with the hemodynamic significance of a coronary lesion; however, these values depend on the cutoff chosen to differentiate between ischemic and nonischemic lesions.11,15,17 Although studies using a cut-off value of 0.75 reported much lower MLA thresholds,11 in the present analysis the FFR cut-off was set at 0.80 to align with the majority of studies addressing these parameters. According to our results, OCT-derived MLA shows a good correlation with an FFR value <0.80.
In our study, the cut-off value for MLA was established at 2.08 mm2, which is slightly above the range of cut-offs published to date, ranging between 1.55 and 2.05 mm2 for the same FFR value. Studies using an FFR cut-off of <0.75 have reported MLA values between 1.39 mm2 and 1.91 mm2.12,15
PAS also proved to be a valuable parameter, showing good correlation with FFR. This parameter is rarely addressed in similar studies. It is important to note that our data show that PAS does not provide additional predictive value beyond MLA for predicting an FFR value <0.80.
The detailed analysis for each coronary artery showed moderate correlations between OCT-derived parameters and FFR values. Although for the LAD a cut-off value of 2.23 mm2 was obtained for MLA, this value was associated with relatively low sensitivity and specificity. Similarly, the PAS value in the LAD territory showed very good sensitivity but relatively low specificity.
In the case of the RCA, MLA proved to be a better predictor of ischemic FFR than in the LAD, with good specificity, sensitivity, and accuracy. For the CX, OCT parameters showed a relatively weak correlation with FFR values.
To our knowledge, the combined analysis of imaging and hemodynamic data has not previously been performed in a population of patients with acute myocardial infarction. However, the results should not be significantly affected by the clinical setting, considering that all lesions included in the analysis were non-culprit lesions and that there are no data in the literature suggesting that FFR is significantly modified by acute myocardial infarction.1–3,17–19
Despite the potential benefits, challenges remain in establishing a universally applicable correlation between OCT-derived MLA and FFR. Variability in image interpretation, operator dependence, and the dynamic nature of coronary physiology are factors that must be considered. Future research should focus on refining these correlations and exploring additional parameters that may improve the accuracy of invasive physiological assessment.
The study presents some limitations. The number of patients and lesions included in the analysis is relatively small; therefore, larger multicenter studies are needed. For this reason, the statistical analysis was challenging, especially as we attempted to determine the significance of OCT parameters for each coronary artery.
The correlation between MLA measured by OCT and FFR in patients with acute myocardial infarction represents an important step forward in the comprehensive evaluation of coronary artery disease in the acute setting. Integrating anatomical and physiological information provides a more holistic understanding of the severity and functional significance of coronary lesions. As technology continues to advance, refining these correlations may further improve the assessment of coronary artery disease and help guide clinicians in delivering personalized and effective patient care.
The synergy between OCT and FFR holds promise for improving the assessment and management of coronary artery disease, including in patients with acute myocardial infarction, representing an important advancement in the field of interventional cardiology. In conclusion, our study showed that OCT-derived parameters may help identify non-critical lesions that could potentially cause ischemia.